Page MenuHomePhabricator

High CPU usage for ats-be ET_NET thread handling PURGE requests on cache_text
Closed, ResolvedPublic

Description

On cache_text nodes, there is one ET_NET ats-be thread doing much more work than all others:

root@cp3052:~# top -b -H -n1 -p `ps xa | awk '/traffic_ser[v]er -M --httpport 3128/ {print $1}'` | head -n 20
top - 12:43:09 up 37 days, 19:53,  1 user,  load average: 12.62, 12.42, 11.68
Threads:  89 total,   1 running,  88 sleeping,   0 stopped,   0 zombie
%Cpu(s): 14.6 us,  5.5 sy,  0.0 ni, 77.8 id,  0.1 wa,  0.0 hi,  2.0 si,  0.0 st
KiB Mem : 39465862+total, 84766352 free, 30453852+used,  5353772 buff/cache
KiB Swap:        0 total,        0 free,        0 used. 82635152 avail Mem 

   PID USER      PR  NI    VIRT    RES    SHR S %CPU %MEM     TIME+ COMMAND
250345 traffic+  20   0 16.812g 0.013t  11492 R 86.7  3.6  52:31.47 [ET_NET 58]
250288 traffic+  20   0 16.812g 0.013t  11492 S  6.7  3.6  34:43.15 [ET_NET 1]
250289 traffic+  20   0 16.812g 0.013t  11492 S  6.7  3.6  36:20.96 [ET_NET 2]
250291 traffic+  20   0 16.812g 0.013t  11492 S  6.7  3.6  51:11.93 [ET_NET 4]
250296 traffic+  20   0 16.812g 0.013t  11492 S  6.7  3.6  34:20.67 [ET_NET 9]
250297 traffic+  20   0 16.812g 0.013t  11492 S  6.7  3.6  35:57.68 [ET_NET 10]
250304 traffic+  20   0 16.812g 0.013t  11492 S  6.7  3.6  74:05.74 [ET_NET 17]
250306 traffic+  20   0 16.812g 0.013t  11492 S  6.7  3.6  34:29.38 [ET_NET 19]
250309 traffic+  20   0 16.812g 0.013t  11492 S  6.7  3.6  47:52.87 [ET_NET 22]
250319 traffic+  20   0 16.812g 0.013t  11492 S  6.7  3.6  35:55.25 [ET_NET 32]
250322 traffic+  20   0 16.812g 0.013t  11492 S  6.7  3.6  61:50.29 [ET_NET 35]
250323 traffic+  20   0 16.812g 0.013t  11492 S  6.7  3.6  79:00.64 [ET_NET 36]
250324 traffic+  20   0 16.812g 0.013t  11492 S  6.7  3.6  34:17.38 [ET_NET 37]
`

Observing the behavior with top -H -p $(ps xa | awk '/traffic_ser[v]er -M --httpport 3128/ {print $1}'), it becomes clear that ET_NET 58 in the example above is consistently using a disproportionate amount of CPU compared to all other threads, even getting somehow close to 90% at times.

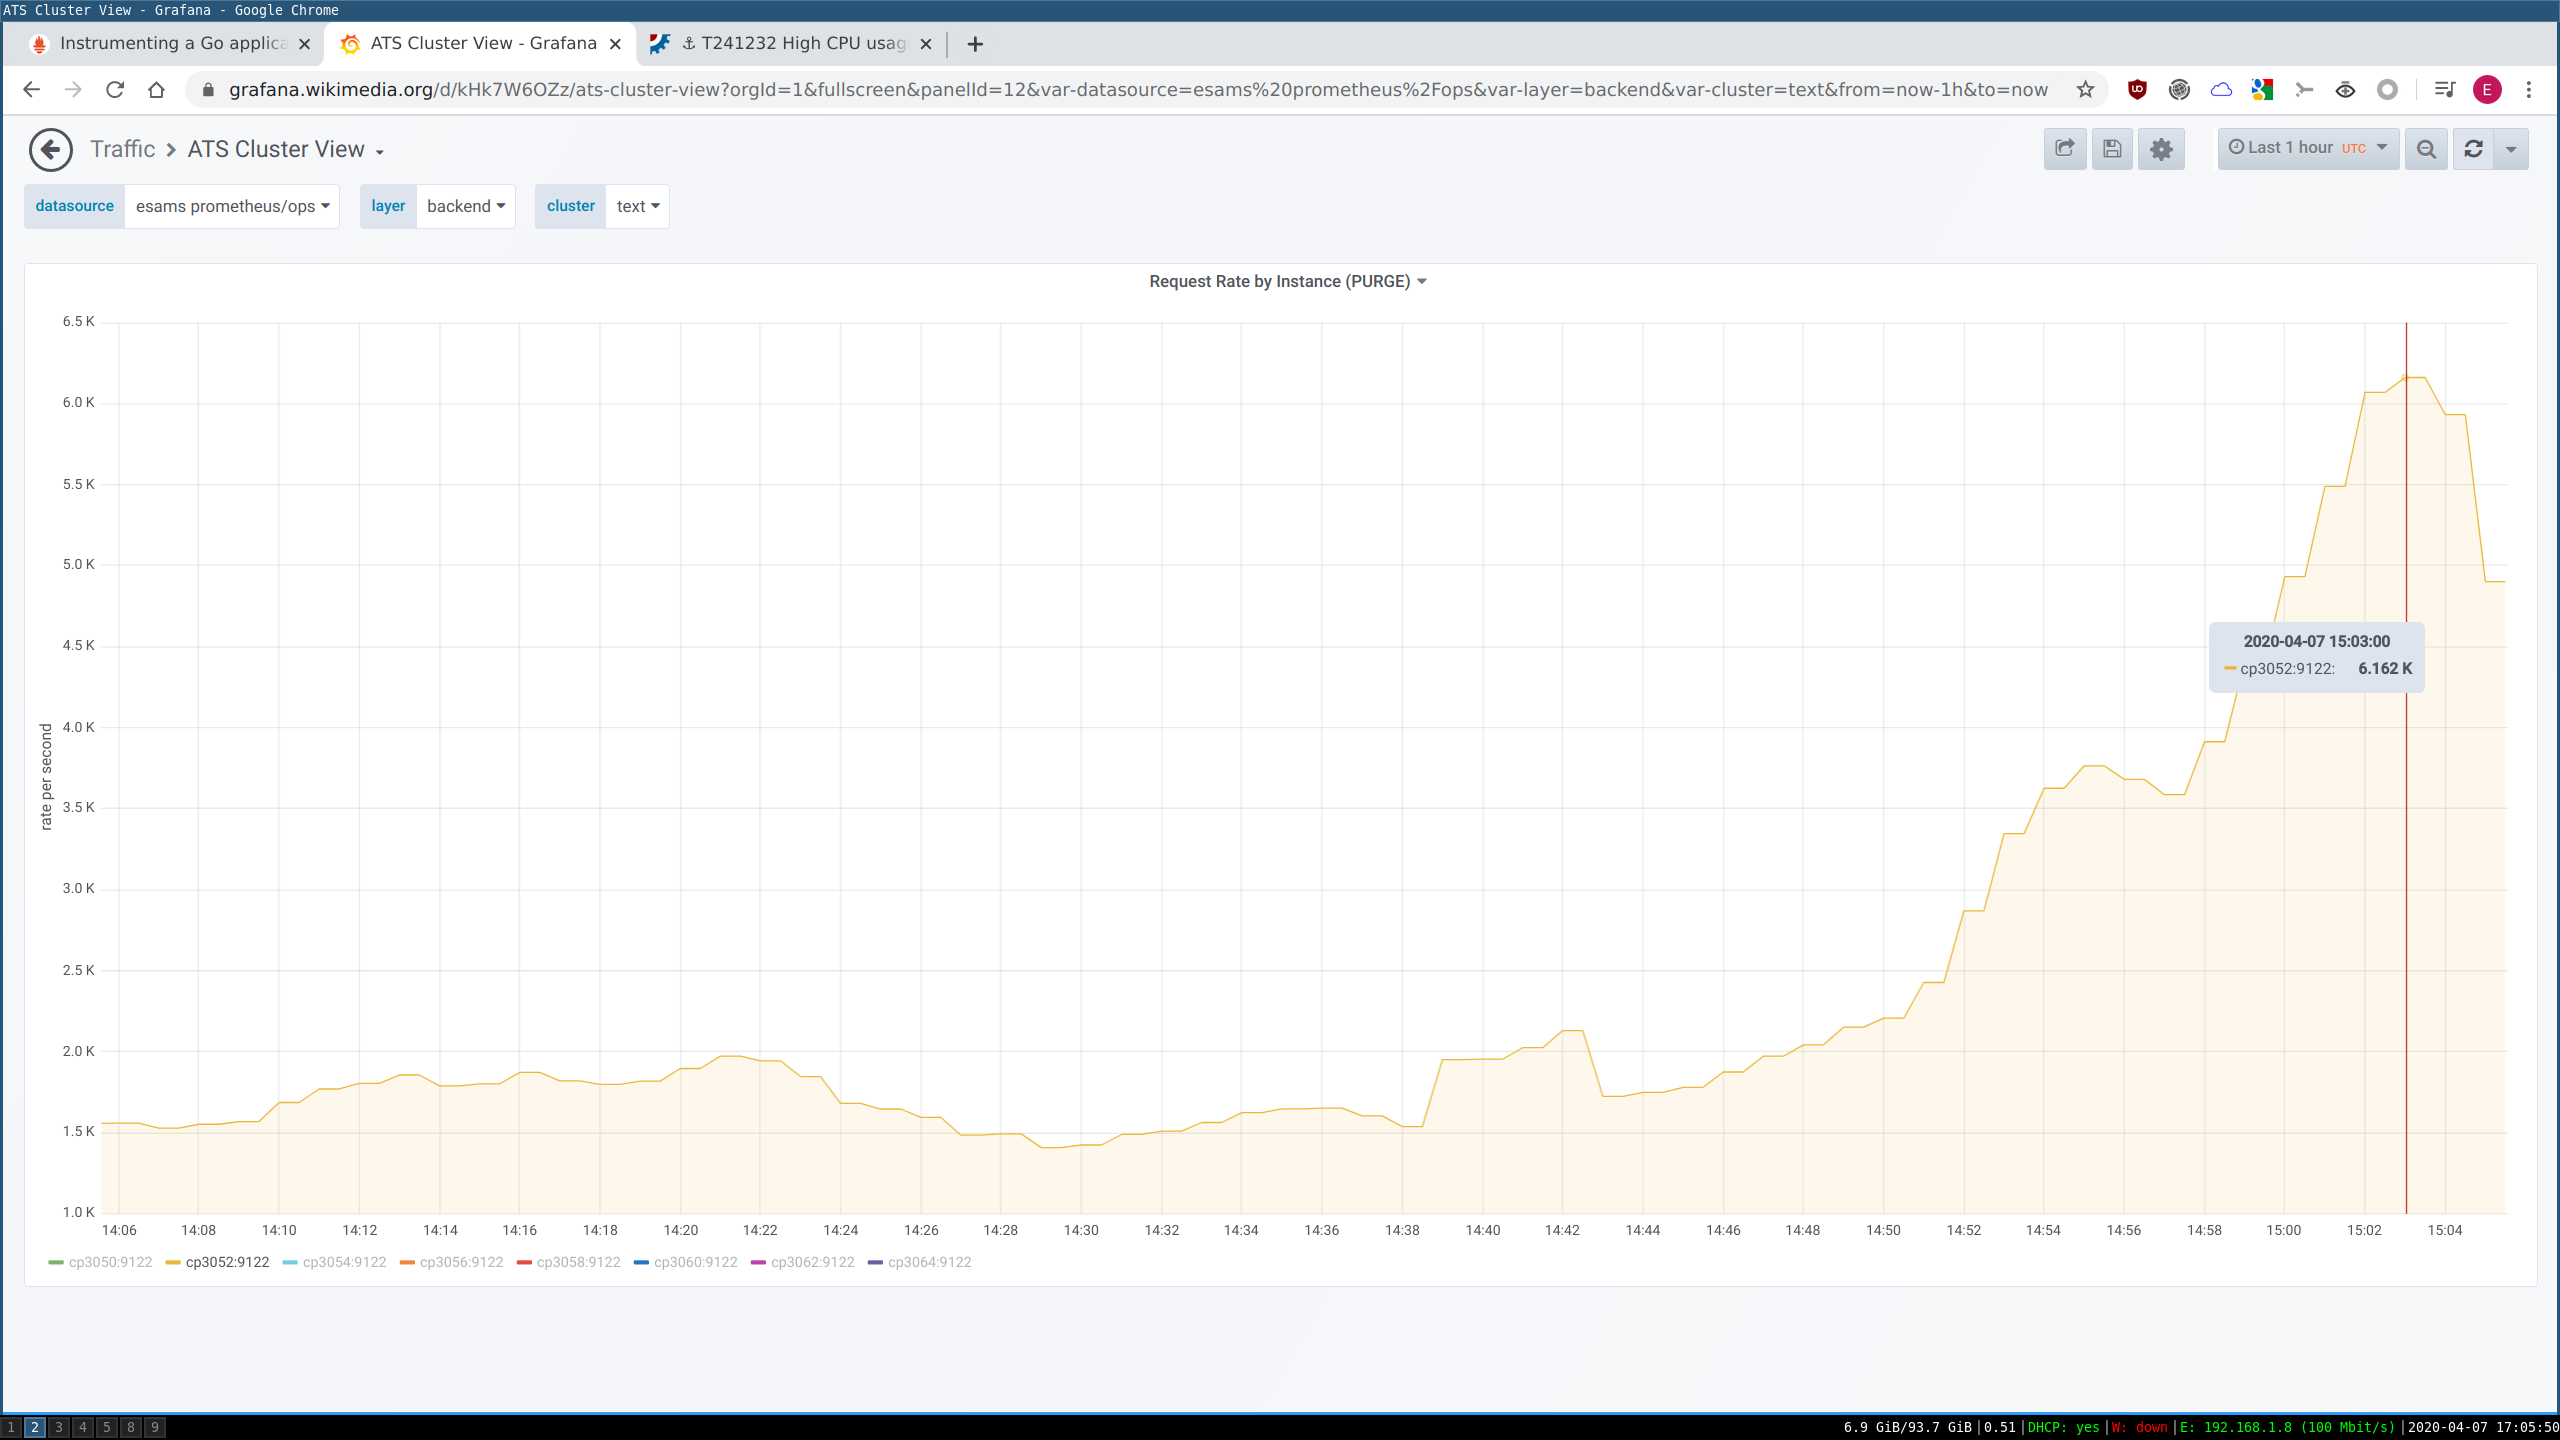
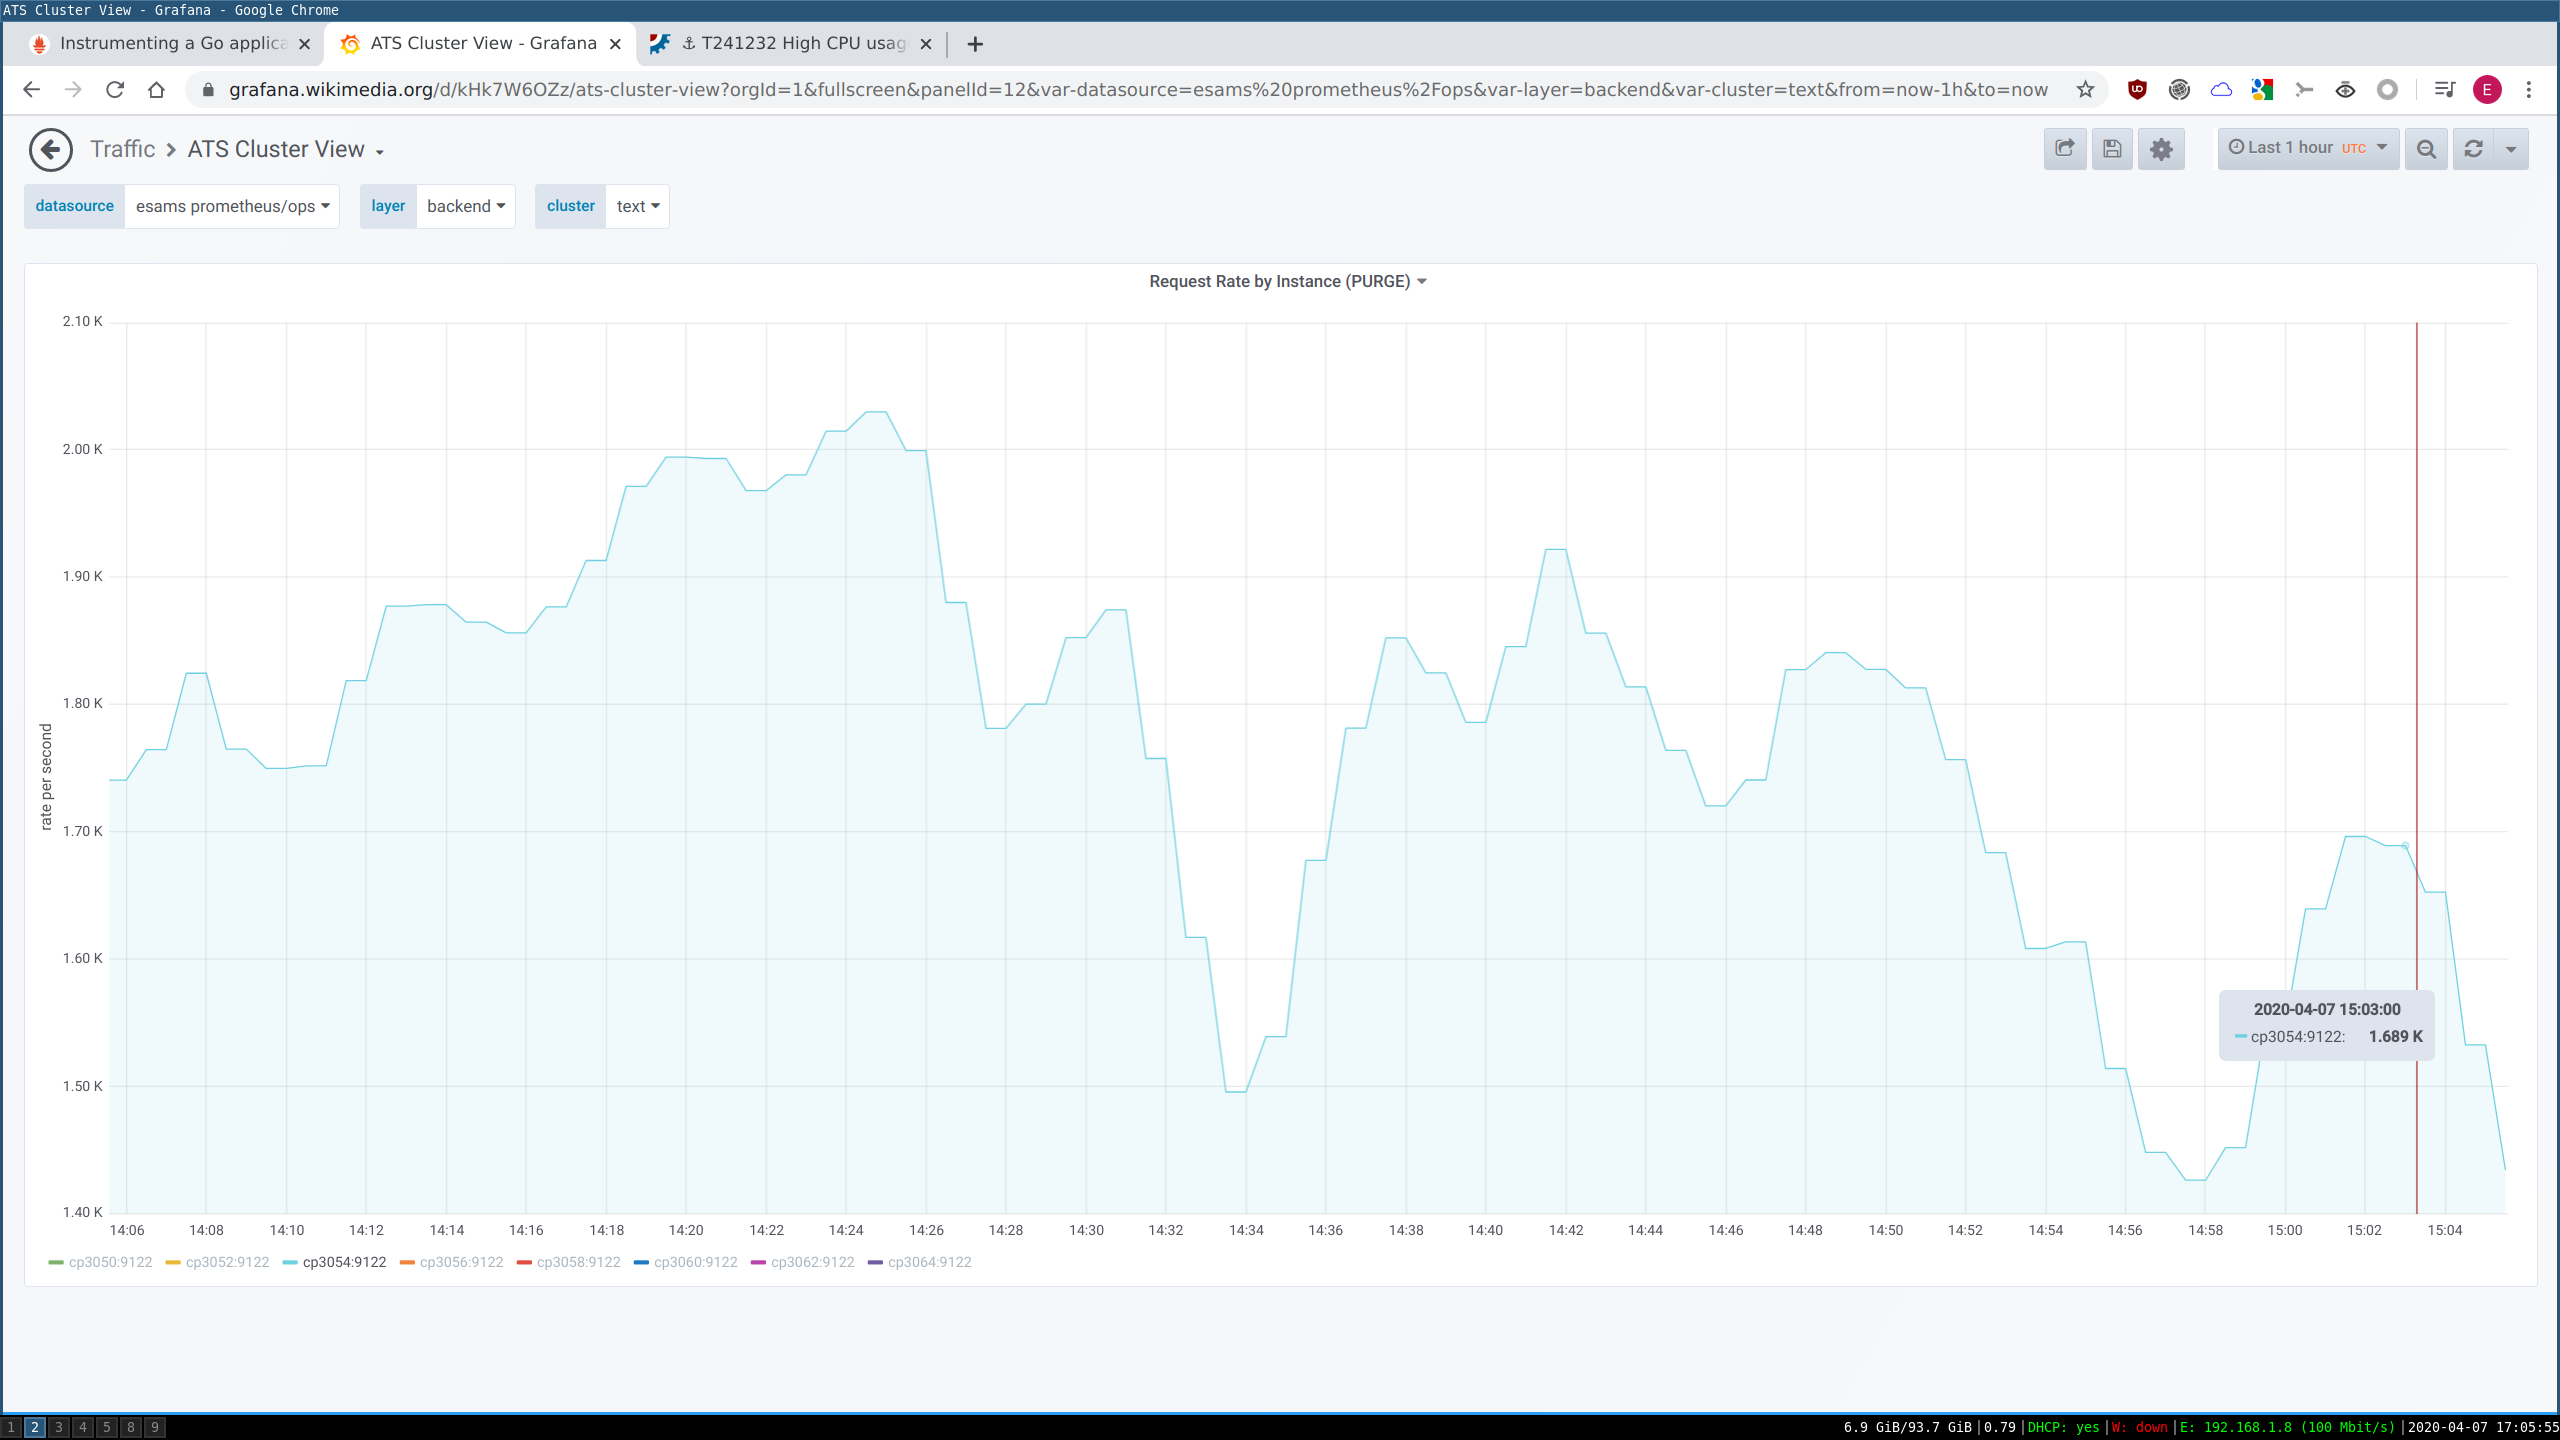
The cause of this is purge traffic sent by vhtcpd: restarting it makes another ET_NET thread become the "busy" one.

Given the current architecture of vhtcpd, we are sending high amounts of requests per second (~5k at the time of this writing) over one single TCP connection. It might be a good idea to explore alternative approaches, such as having vhtcpd spread HTTP requests over a pool of TCP connections instead to spread the load more evenly.

Event Timeline

Restricted Application added a subscriber: Aklapper. · View Herald Transcript
ema triaged this task as Medium priority.Dec 20 2019, 12:54 PM
ema moved this task from Backlog to Caching on the Traffic board.

Mentioned in SAL (#wikimedia-operations) [2019-12-23T08:31:14Z] <ema> cp2023: depool ats-be for Lua path normalization experiment T241232

With the migration to ATS we have moved the URI Path Normalization implementation from native (VCL -> C) to Lua code, so we thought this might have had an impact when it comes to this ticket. I've tried disabling normalize-path.lua altogether on cp2023 by removing it from all remap rules. There seems to be no significant change in CPU usage compared to another text@codfw host, and this would indicate that there is no point in spending much time looking at Lua-level optimizations, at least when it comes to normalize-path.lua itself.

Compare cp2023 (ats-be depooled, lua plugin disabled):

08:46:45 ema@cp2023.codfw.wmnet:~
$ for i in `seq 10`; do top -b -n 1 -H -p 4703 | grep 'ET_NET 58' | ts ; sleep 1 ; done
Dec 23 08:47:03  4893 traffic+  20   0 14.732g 0.010t  11616 S  0.0  4.1  26:35.72 [ET_NET 58]
Dec 23 08:47:04  4893 traffic+  20   0 14.732g 0.010t  11616 S  6.7  4.1  26:35.88 [ET_NET 58]
Dec 23 08:47:05  4893 traffic+  20   0 14.732g 0.010t  11616 S 20.0  4.1  26:36.28 [ET_NET 58]
Dec 23 08:47:06  4893 traffic+  20   0 14.732g 0.010t  11616 S 18.8  4.1  26:36.50 [ET_NET 58]
Dec 23 08:47:08  4893 traffic+  20   0 14.732g 0.010t  11616 R 13.3  4.1  26:36.62 [ET_NET 58]
Dec 23 08:47:09  4893 traffic+  20   0 14.732g 0.010t  11616 S 20.0  4.1  26:36.76 [ET_NET 58]
Dec 23 08:47:10  4893 traffic+  20   0 14.732g 0.010t  11616 S  6.2  4.1  26:36.85 [ET_NET 58]
Dec 23 08:47:11  4893 traffic+  20   0 14.732g 0.010t  11616 S 12.5  4.1  26:36.95 [ET_NET 58]
Dec 23 08:47:12  4893 traffic+  20   0 14.732g 0.010t  11616 S 13.3  4.1  26:37.07 [ET_NET 58]
Dec 23 08:47:13  4893 traffic+  20   0 14.732g 0.010t  11616 S  6.2  4.1  26:37.22 [ET_NET 58]

With cp2013 (ats-be pooled, Lua plugin enabled):

08:46:46 ema@cp2013.codfw.wmnet:~
$ for i in `seq 10` ; do top -b -n 1 -H -p 25000 | grep 'ET_NET 48' | ts ; sleep 1; done
Dec 23 08:47:04 25057 traffic+  20   0 15.451g 0.011t  11452 S  6.2  4.6  40:14.55 [ET_NET 48]
Dec 23 08:47:05 25057 traffic+  20   0 15.451g 0.011t  11452 S 20.0  4.6  40:14.97 [ET_NET 48]
Dec 23 08:47:06 25057 traffic+  20   0 15.451g 0.011t  11452 S 20.0  4.6  40:15.18 [ET_NET 48]
Dec 23 08:47:08 25057 traffic+  20   0 15.451g 0.011t  11452 S  6.2  4.6  40:15.30 [ET_NET 48]
Dec 23 08:47:09 25057 traffic+  20   0 15.451g 0.011t  11452 S 13.3  4.6  40:15.45 [ET_NET 48]
Dec 23 08:47:10 25057 traffic+  20   0 15.451g 0.011t  11452 S  6.7  4.6  40:15.55 [ET_NET 48]
Dec 23 08:47:11 25057 traffic+  20   0 15.451g 0.011t  11452 S 12.5  4.6  40:15.65 [ET_NET 48]
Dec 23 08:47:12 25057 traffic+  20   0 15.451g 0.011t  11452 S  6.7  4.6  40:15.77 [ET_NET 48]
Dec 23 08:47:13 25057 traffic+  20   0 15.451g 0.011t  11452 S  6.7  4.6  40:15.92 [ET_NET 48]
Dec 23 08:47:15 25057 traffic+  20   0 15.451g 0.011t  11452 S  0.0  4.6  40:16.03 [ET_NET 48]

Mentioned in SAL (#wikimedia-operations) [2019-12-23T09:10:38Z] <ema> cp2023: wipe ats-be cache and repool after normalize-path.lua experiment T241232

I am testing a first iteration of purged (T249583) on cp3052. The program sends PURGEs over multiple TCP connections, and ats-be is now doing much better:

15:02:31 ema@cp3052.esams.wmnet:~
$ top -b -H -n1 -p `ps xa | awk '/traffic_ser[v]er -M --httpport 3128/ {print $1}'` | head -n 20
top - 15:02:33 up 55 days,  4:21,  5 users,  load average: 49.71, 39.65, 31.57
Threads:  89 total,   5 running,  84 sleeping,   0 stopped,   0 zombie
%Cpu(s): 40.5 us,  6.8 sy,  0.0 ni, 50.2 id,  0.1 wa,  0.0 hi,  2.3 si,  0.0 st
MiB Mem : 385429.8 total, 109742.8 free, 268982.5 used,   6704.5 buff/cache
MiB Swap:      0.0 total,      0.0 free,      0.0 used. 109128.3 avail Mem 

  PID USER      PR  NI    VIRT    RES    SHR S  %CPU  %MEM     TIME+ COMMAND
22418 traffic+  20   0   10.4g   5.4g  13920 S  13.3   1.4 156:40.35 [ET_NET 26]
22436 traffic+  20   0   10.4g   5.4g  13920 S  13.3   1.4 255:09.68 [ET_NET 44]
22437 traffic+  20   0   10.4g   5.4g  13920 S  13.3   1.4 169:06.73 [ET_NET 45]
22451 traffic+  20   0   10.4g   5.4g  13920 S  13.3   1.4 169:01.10 [ET_NET 59]
22397 traffic+  20   0   10.4g   5.4g  13920 S   6.7   1.4 218:07.35 [ET_NET 5]
22404 traffic+  20   0   10.4g   5.4g  13920 S   6.7   1.4 154:30.77 [ET_NET 12]
22407 traffic+  20   0   10.4g   5.4g  13920 S   6.7   1.4 224:14.45 [ET_NET 15]
22408 traffic+  20   0   10.4g   5.4g  13920 S   6.7   1.4 187:39.67 [ET_NET 16]
22409 traffic+  20   0   10.4g   5.4g  13920 S   6.7   1.4 178:18.44 [ET_NET 17]
22411 traffic+  20   0   10.4g   5.4g  13920 S   6.7   1.4 138:14.48 [ET_NET 19]
22414 traffic+  20   0   10.4g   5.4g  13920 S   6.7   1.4 171:06.85 [ET_NET 22]
22417 traffic+  20   0   10.4g   5.4g  13920 S   6.7   1.4 309:23.81 [ET_NET 25]
22419 traffic+  20   0   10.4g   5.4g  13920 S   6.7   1.4 207:09.87 [ET_NET 27]

Compare with cp3054:

15:04:27 ema@cp3054.esams.wmnet:~
$ top -b -H -n1 -p `ps xa | awk '/traffic_ser[v]er -M --httpport 3128/ {print $1}'` | head -n 20
top - 15:04:30 up 55 days,  8:00,  1 user,  load average: 21.62, 21.36, 21.88
Threads:  89 total,   4 running,  85 sleeping,   0 stopped,   0 zombie
%Cpu(s): 32.2 us,  6.1 sy,  0.0 ni, 58.4 id,  0.1 wa,  0.0 hi,  3.2 si,  0.0 st
MiB Mem : 385429.8 total,  92662.0 free, 283703.2 used,   9064.7 buff/cache
MiB Swap:      0.0 total,      0.0 free,      0.0 used.  94414.9 avail Mem 

  PID USER      PR  NI    VIRT    RES    SHR S  %CPU  %MEM     TIME+ COMMAND
27366 traffic+  20   0   12.1g   7.1g  13832 R  80.0   1.9 161:17.72 [ET_NET 40]
27330 traffic+  20   0   12.1g   7.1g  13832 S   6.7   1.9 201:58.66 [ET_NET 4]
27339 traffic+  20   0   12.1g   7.1g  13832 S   6.7   1.9 210:19.23 [ET_NET 13]
27341 traffic+  20   0   12.1g   7.1g  13832 S   6.7   1.9 178:34.43 [ET_NET 15]
27343 traffic+  20   0   12.1g   7.1g  13832 S   6.7   1.9 326:08.61 [ET_NET 17]
27360 traffic+  20   0   12.1g   7.1g  13832 S   6.7   1.9 173:04.96 [ET_NET 34]
27363 traffic+  20   0   12.1g   7.1g  13832 S   6.7   1.9 284:03.33 [ET_NET 37]
27364 traffic+  20   0   12.1g   7.1g  13832 S   6.7   1.9 282:03.37 [ET_NET 38]
27369 traffic+  20   0   12.1g   7.1g  13832 S   6.7   1.9 180:59.92 [ET_NET 43]
27374 traffic+  20   0   12.1g   7.1g  13832 S   6.7   1.9 185:37.73 [ET_NET 48]
27379 traffic+  20   0   12.1g   7.1g  13832 S   6.7   1.9 127:07.43 [ET_NET 53]
27390 traffic+  20   0   12.1g   7.1g  13832 S   6.7   1.9 294:44.53 [ET_NET 64]
27392 traffic+  20   0   12.1g   7.1g  13832 S   6.7   1.9 167:44.78 [ET_NET 66]

The change is reflected in the number of PURGEs actually being processed:

Screenshot from 2020-04-07 17-05-51.png (1×2 px, 195 KB)

Screenshot from 2020-04-07 17-05-59.png (1×2 px, 211 KB)

Mentioned in SAL (#wikimedia-operations) [2020-04-07T15:10:37Z] <ema> cp3052: stop purged, start vhtcpd T249583 T241232

ema claimed this task.

Fixed by moving to purged (T249583).