Page MenuHomePhabricator

Sustained periods (2-4h) of bad latency on production-search eqiad
Closed, ResolvedPublic

Description

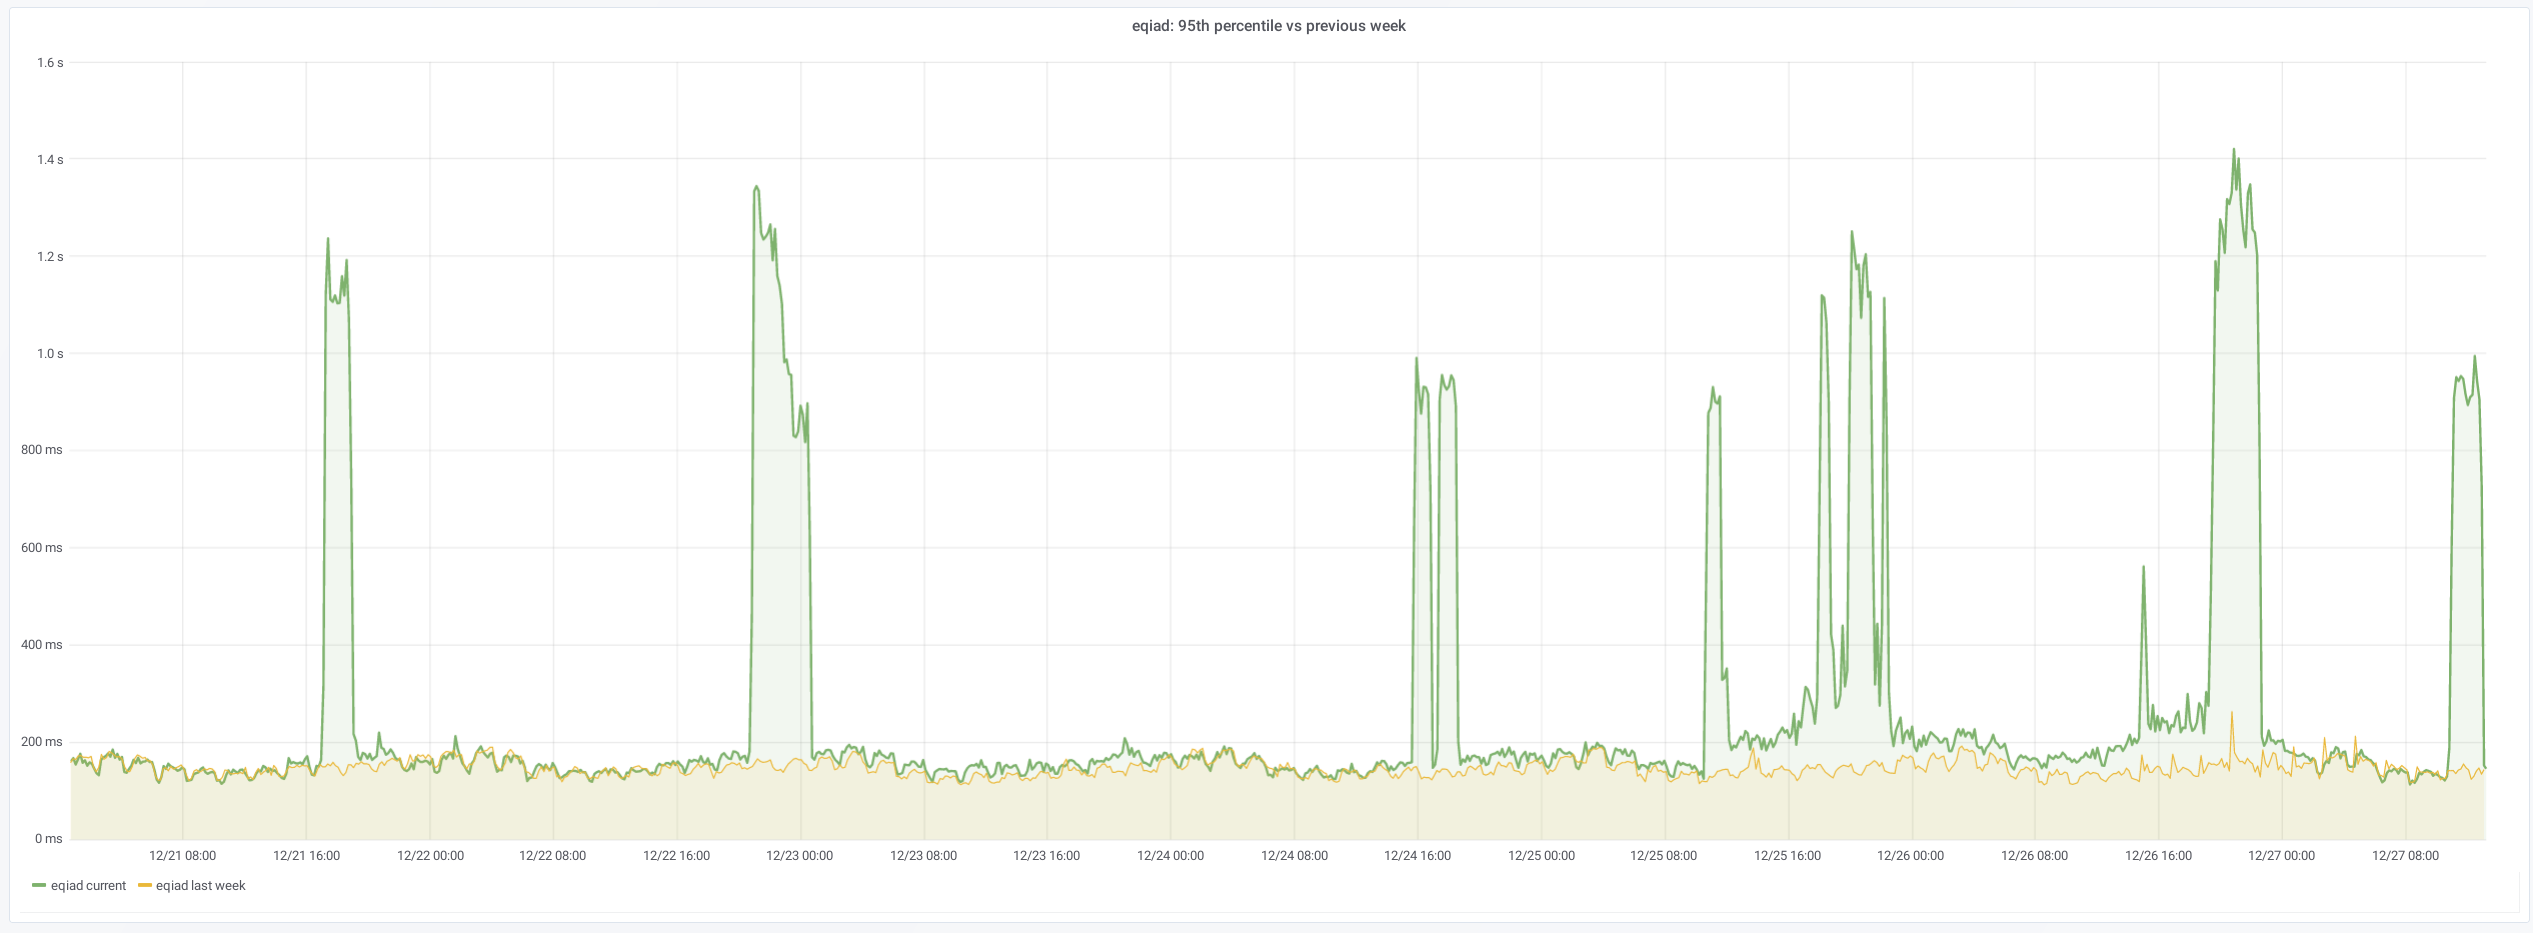
There has been at least 3 occasions in the last week, each on different day, in which the 95% percentile raised over 1 second -the 50% percentile increases too, from ~10ms to ~30ms, but that is less worrying. Last one started at 15:47 (Dec 24).

https://grafana.wikimedia.org/d/000000455/elasticsearch-percentiles?orgId=1&from=1576647991218&to=1577229020000

Screenshot_20200103_110932.png (930×2 px, 127 KB)

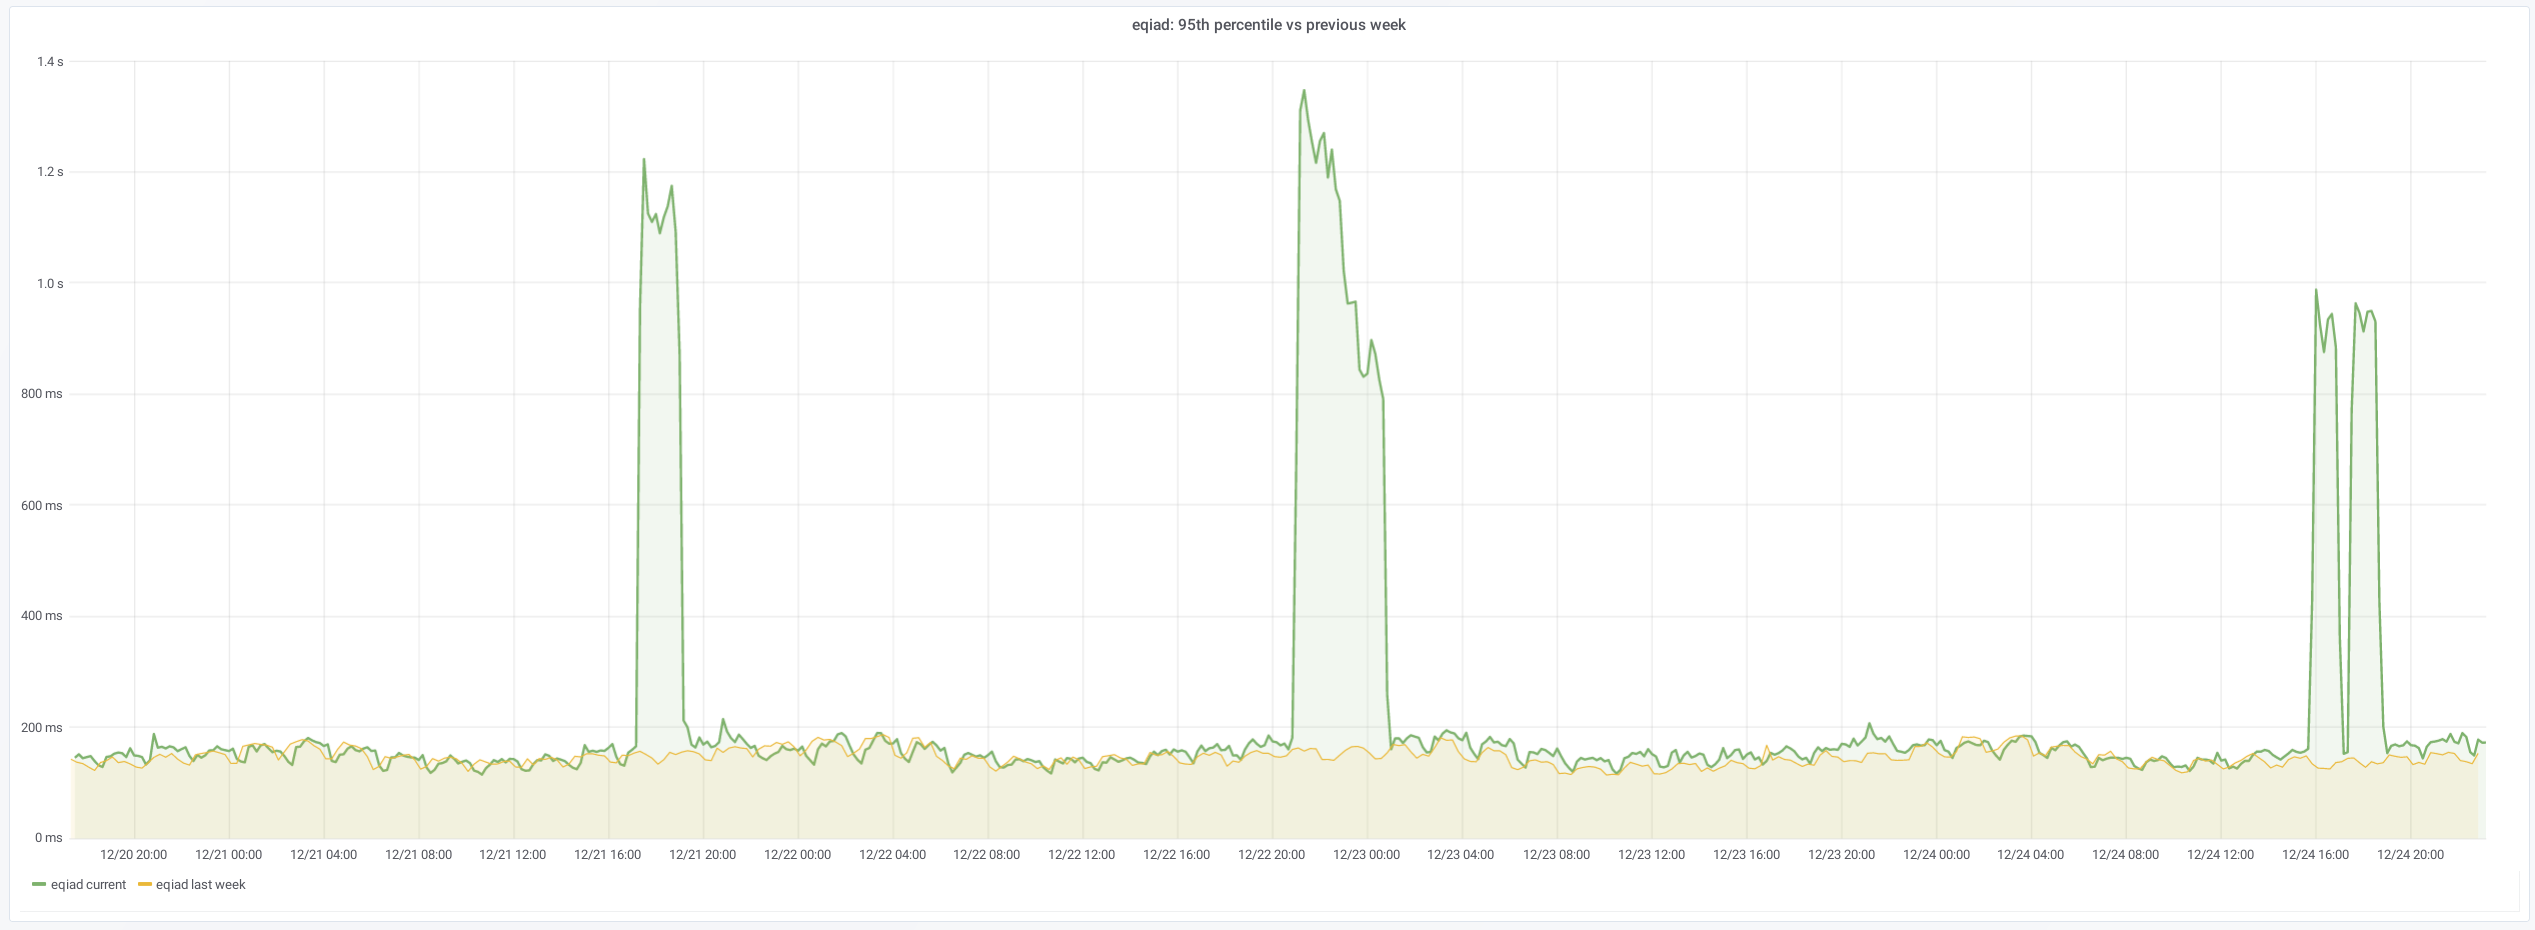
This could be due to traffic (sorry I could not find traffic statistics to confirm that), in which case, there are not many actionables here, but reporting for awareness, to evaluate impact/importance, and in case there is something internally (e.g. indexing, configuration), that could cause it or mitigate the slowdown.

Event Timeline

Restricted Application added a subscriber: Aklapper. · View Herald Transcript

My bet would be media indexing, as an alert on Image uploads coincided, with some shift (which could be explained by the asynchronous nature), but I don't have hard proof of this, other than the matching times.

Edit: one event showed correlation, but no longer showing this, as I didn't see it in the following instances

I believe this is caused by a bot sending a large amount of requests of type:
/w/api.php?format=json&action=query&prop=revisions&list=search&srsearch=search+query
using the UA: wikipedia (https://github.com/goldsmith/Wikipedia/)

from 811 ip addresses which seem to belong to amazon (not checked all of them)

Filtering these requests I can match the pattern we see in grafana;

wik_ama.png (528×704 px, 55 KB)
(Y is requests/hour)
QPS in grafana for the same period:
qps.png (596×838 px, 74 KB)

Removing these requests for the same period I see the usual pattern:
qps_normal.png (528×704 px, 60 KB)

I have a notebook with the IPs on notebook1004 named abuse_goldsmith_ua_from_amazon.
The search cluster cannot support such traffic as it doubles the number of fulltext searches we have to serve.
Pinging traffic for suggestions on how to proceed.

Change 561300 had a related patch set uploaded (by CDanis; owner: CDanis):
[operations/puppet@production] block one U-A running on AWS

https://gerrit.wikimedia.org/r/561300

Change 561300 merged by CDanis:
[operations/puppet@production] block search API traffic from one U-A running on AWS

https://gerrit.wikimedia.org/r/561300

Change 561304 had a related patch set uploaded (by CDanis; owner: CDanis):
[operations/puppet@production] anchor regex to start

https://gerrit.wikimedia.org/r/561304

Change 561304 merged by CDanis:
[operations/puppet@production] AWS search block: anchor regex to start

https://gerrit.wikimedia.org/r/561304

Change 561322 had a related patch set uploaded (by CDanis; owner: CDanis):
[operations/puppet@production] *properly* block search traffic of just one UA from AWS

https://gerrit.wikimedia.org/r/561322

ema triaged this task as High priority.Jan 3 2020, 10:04 AM
ema moved this task from Backlog to Caching on the Traffic board.

I believe this is caused by a bot sending a large amount of requests of type:
/w/api.php?format=json&action=query&prop=revisions&list=search&srsearch=search+query
using the UA: wikipedia (https://github.com/goldsmith/Wikipedia/)

Rather than being one specific bot, the UA in question is a Python library, hence it's likely used by various different bots.

The search cluster cannot support such traffic as it doubles the number of fulltext searches we have to serve.
Pinging traffic for suggestions on how to proceed.

search=srsearch traffic from that User-Agent seems to have gone back to levels that do not cause trouble lately: https://w.wiki/EqB

@CDanis and I have worked on a VCL patch to block this specific type of traffic from that User-Agent that can be merged if the abusive traffic starts again: https://gerrit.wikimedia.org/r/#/c/operations/puppet/+/561322/

Clearly, however, this can easily turn in a cat and mouse game. What is the per-IP request per second rate that the search cluster can support? With this information, we can enforce specific throttling at the edge, different from what we use for the mw api in general (currently set to 100/s).

Clearly, however, this can easily turn in a cat and mouse game. What is the per-IP request per second rate that the search cluster can support? With this information, we can enforce specific throttling at the edge, different from what we use for the mw api in general (currently set to 100/s).

I'm not convinced that per-IP limits are going to help much. During this incident, the per-IP request rate was reasonable, but the traffic came from a number of different AWS instances. @dcausse is still doing some number crunching and might come up with a better answer, but this seems unlikely.

TJones claimed this task.