Page MenuHomePhabricator

Find a better way for WMDE to get impression counts for their banners
Open, Needs TriagePublic

Description

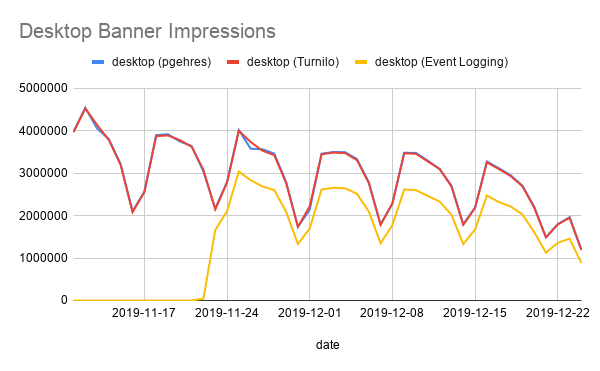
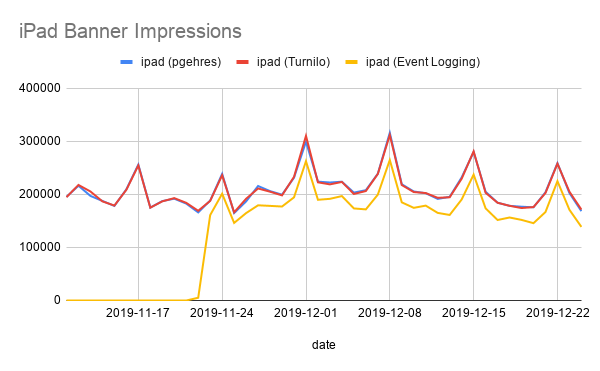
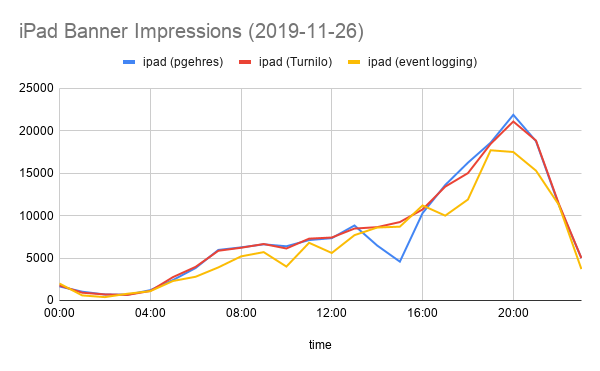
At the moment WMDE get banner impression counts (crucial to their fundraising tests) via a basic script. This runs every 15 minutes as a cron job on pcoombe's account on frdev1001. It simply pulls the past 15 minutes data on WMDE banners from the pgehres.bannerimpressions table, and emails it to a special WMDE email address where it is imported into their systems.

Problems with this:

  • it is highly dependent on one person at WMF (me)
  • it runs year-round, when it probably doesn't need to
  • if there are issues with the database e.g. replication stops, this requires someone to notice, and then manual work to regenerate and re-send the missing data

We really ought to find a better way to do this.

Event Timeline

Restricted Application added a subscriber: Aklapper. · View Herald Transcript

@Pcoombe @Addshore Perhaps I could help, but you need to let me know precisely what solution on WMDE banners you are looking for.

We have our own analytics software that plots the donation data (containing the banner name) against the number of impressions. The data from Peter's script gets imported regularly (With IMAP as our transport protocol 😱). So we definitively need a "machine access" (i.e. no credentials from analytics team used) to the data, to import it in regular intervals. The data itself is quite minimal and should not contain user-identifiable data: Banner name, impressions from a 15-minute period, timestamp.

Whether that access is an API, files downloaded via ssh/sftp does not matter to us, we'll have to write a new import script anyway.

Can someone describe what fields/columns does this dataset have? Where is the pgehres.bannerimpressions table?

Seems like reportupdater here can be of help: https://wikitech.wikimedia.org/wiki/Analytics/Systems/Reportupdater

And also, where does the data that ends up on pgehres.bannerimpression come from?

I'm not sure what information you are looking for. pgehres is only accessible for the wmf advancement team and only pulls data for wmf banners. I don't think this WMDE request is related.

I have no insight into the process on WMF's side. This is what is being sent to our inbox:

2019/11/11 23:30 - 2019/11/11 23:45
CONCAT_WS(',', banner, sum(count) )
B19_WMDE_09_ctrl,5540
B19_WMDE_09_var,5340
B19_WMDE_EN_Desktop_01_ctrl,1440
B19_WMDE_EN_Desktop_01_var,1520
B19_WMDE_EN_Mobile_01_ctrl,6650
B19_WMDE_EN_Mobile_01_var,6510
B19_WMDE_ipad_01_ctrl,620
B19_WMDE_ipad_01_var,540
B19_WMDE_Mobile_01_ctrl,6110
B19_WMDE_Mobile_01_var,7780

@kai.nissen I see so data is not sensitive in nature and seems that the bulk of it should be already published by eventlogging to the events database in hive to the centralnoticeimpression table

I can do some queries but if that is the case the only thing needed would be to setup a reportupdater job that queries hive/aggregates counts and creates a tsv that you can pull remotely, see other files that are created using this methodology, for example:

https://analytics.wikimedia.org/datasets/periodic/reports/metrics/browser/

@kai.nissen the data on events/centralnoticeimpression is sampled 1%

We are working with @AndyRussG to fix issue in https://phabricator.wikimedia.org/T244771 but once fixed if the sampling ratio of the data on that table is good enough then we can help you set up workflows to read from that table the banner counts in question.

if the sampling ratio of the data on that table is good enough then we can help you set up workflows to read from that table the banner counts in question.

Just an additional note here, the client-side sample rate can be adjusted on a per-campaign basis using the CentralNotice administration interface.

Also, if you have access to the Hive WebRequest table, you can get the raw data from the old beacon/impression system yourself. Sample rate for that is also adjustable. Turnilo also has data, if you have access. Pls reach out if you'd like more specifics! Thanks!

So, for logging banner impressions we have

  • beacon/impression
  • Special:RecordImpression
  • Extension:EventLogging

The analytics data sources we have are

  • banner_activity_minutely in Turnilo (WMDE Fundraising Campaign 2019)
  • banner_activity_minutely in druid, which seems to only share the name with the Turnilo one (WMDE Fundraising Campaign 2019)
  • pgehres.bannerimpressions by mail
  • raw data from requests to beacon/impression
  • event.centralnoticeimpression in druid

To me it seems, a new setup should take the EventLogging approach, since all others are referred to as "old" or "legacy". Do I understand correctly, that event.centralnoticeimpression does not contain our data (yet), because of T244771: Refining is failing to refine centranoticeimpression events?

Do I understand correctly, that event.centralnoticeimpression does not contain our data (yet), because of T244771: Refining is failing to refine centranoticeimpression events?

Yes, I think that is correct, now that data is sampled ( @AndyRussG teams owns it) so you would need to look whether you have the data you need given the sampling rates

Now, I think if you rely on that data source strongly you need to communicate that to @AndyRussG team (cc @DStrine) to make sure it is kept up to date and that changes like the ones we have seen do not break the data stream.

ping @kai.nissen that data is accessible in event table in hive, to query the data you can do:

hive (event)> select * from CentralNoticeImpression where year=2019 and month=12 and day=15 and hour=10 limit 10;

It will be easy to setup a reportupdater job that queries this data, aggregates it and puts it on a external http endpoint to be accessed by any dashboard. Ping us as needed.

@Nuria, @AndyRussG
I compared the numbers we received from pgehres.bannerimpressions to data in Turnilo's banner_activity_minutely and data extracted from event.centralnoticeimpression. The charts below show the difference between the numbers.

The numbers from pgehres and Turnilo show only a small deviation of ±1%. There is a larger deviation in some cases, but I could track that down to a lack of data. But apparently the numbers extracted from event logging data are way lower. Is that a known issue or am I missing something?

Turnilo query vs query to retrieve event logging data:

SELECT CONCAT(month, '-', LPAD(day, 2, "0")) AS campaign_day, event.device, COUNT(*) AS impressions FROM centralnoticeimpression
WHERE event.campaign LIKE "C19_WMDE%"
AND event.statusCode = 6
AND year = 2019
AND (month = 11 OR month = 12)
GROUP BY event.device, CONCAT(month, '-', lpad(day, 2, "0"));
banner impressions by daybanner impressions by hour (2019-11-26)
Desktop Banner Impressions.png (371×600 px, 27 KB)
Desktop Banner Impressions (2019-11-26).png (371×600 px, 22 KB)
Mobile Banner Impressions.png (371×600 px, 22 KB)
Mobile Banner Impressions (2019-11-26).png (371×600 px, 22 KB)
iPad Banner Impressions.png (371×600 px, 24 KB)
iPad Banner Impressions (2019-11-26).png (371×600 px, 23 KB)

I do not think those two datasets have the same sample size sample sizes, @AndyRussG can speak to that. Absolute numbers can differ and you still can get the same information from the data, our advice is always to normalize so you do not see a peak of banner impressions that is due to , say, a peak of pageviews.

@Nuria
Sorry, that this has been sitting around for such a long time. I think, we can live with the lack of comparability to banner tests of past campaigns for the sake of replacing the current setup.

There is one open question left, though: Currently, the data is published to the respective hive table with a delay of several hours. We closely monitor running banner campaigns and are used to receiving the numbers with much shorter delay. Do you think, you can provide aggregated data before Hive ingests it?

Currently, the data is published to the respective hive table with a delay of several hours.

At this time data in hive is about 2 hours behind realtime

Do you think, you can provide aggregated data before Hive ingests it?

We can provide realtime data with a bit of work for the eventlogging stream (remember, sampled 1%)

We can provide realtime data with a bit of work for the eventlogging stream (remember, sampled 1%)

That'd be great! We can take the sampling into account when processing the data.

Similar to the current output format (T243092#5865866), the file should contain the time range, the banner name and the number of impressions. We use a naming convention for campaigns and banners, afaik the latter is also relied on in the current setup. Campaign names start with C[\d]{2}_WMDE, banner names start with B[\d]{2}_WMDE, the digits reflecting the year.

The current setup simply returns impressions for any campaign containing the string WMDE.

Thanks for working to find a new solution for this!

I have filed a ticket , please be aware that we might not get to it for a quarter or so: https://phabricator.wikimedia.org/T255446