Page MenuHomePhabricator

Elevated response times and CPU usage after deploy of 1.35.0-wmf.16 to all wikis
Closed, ResolvedPublic

Description

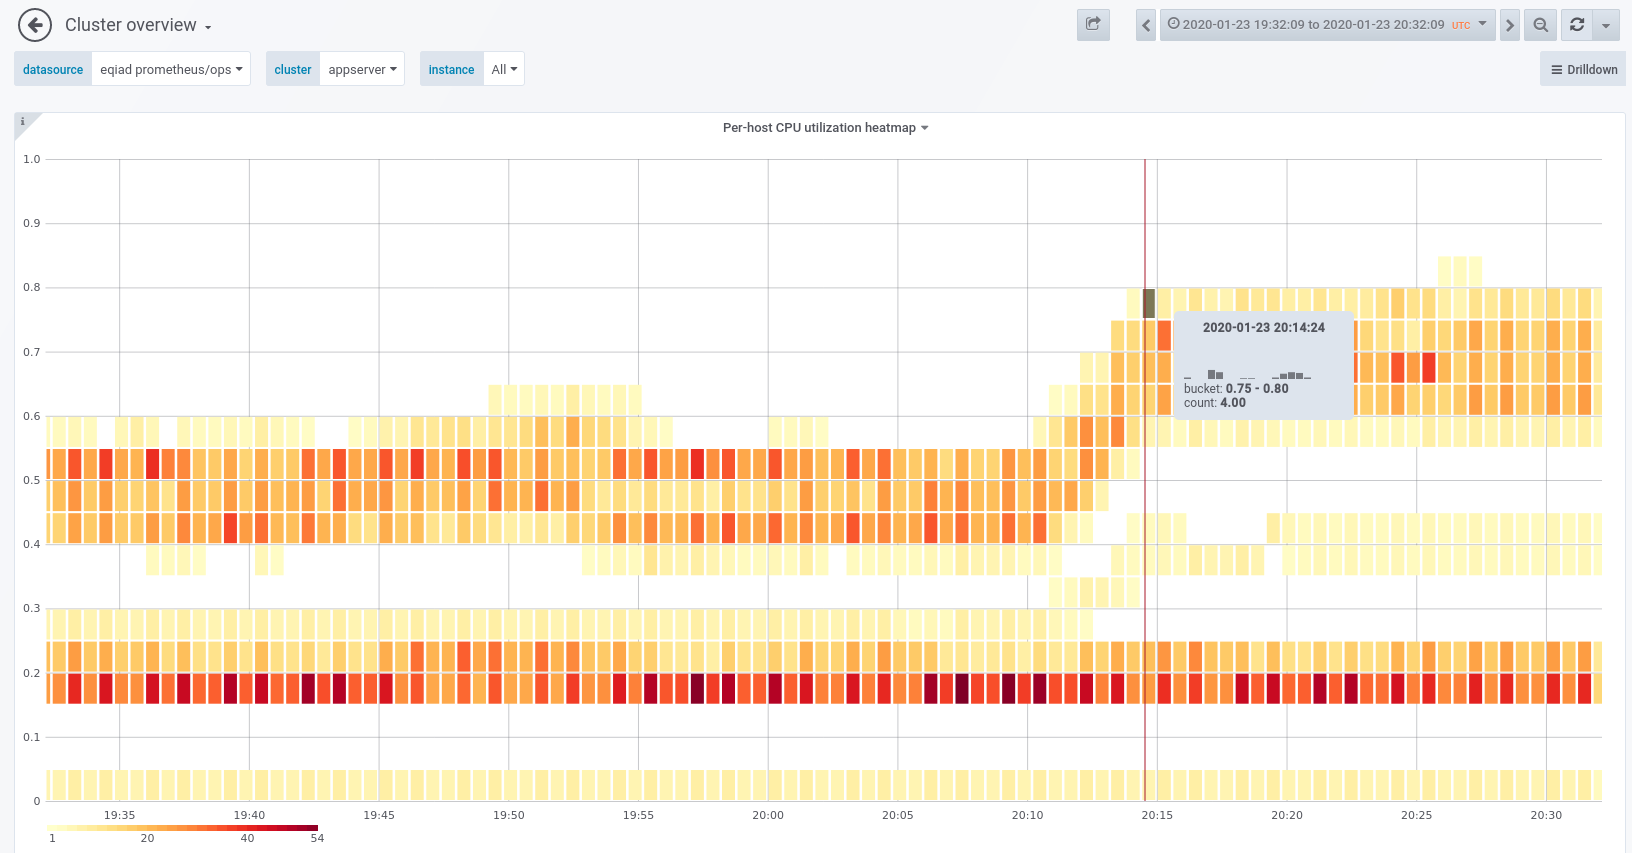
On rolling all wikis to 1.35.0-wmf.16, an alert triggered for GET latency and @CDanis immediately noticed elevated CPU usage on application servers:

Screenshot from 2020-01-23 13-40-39.png (830×1 px, 73 KB)

Screenshot from 2020-01-23 13-40-53.png (853×1 px, 74 KB)

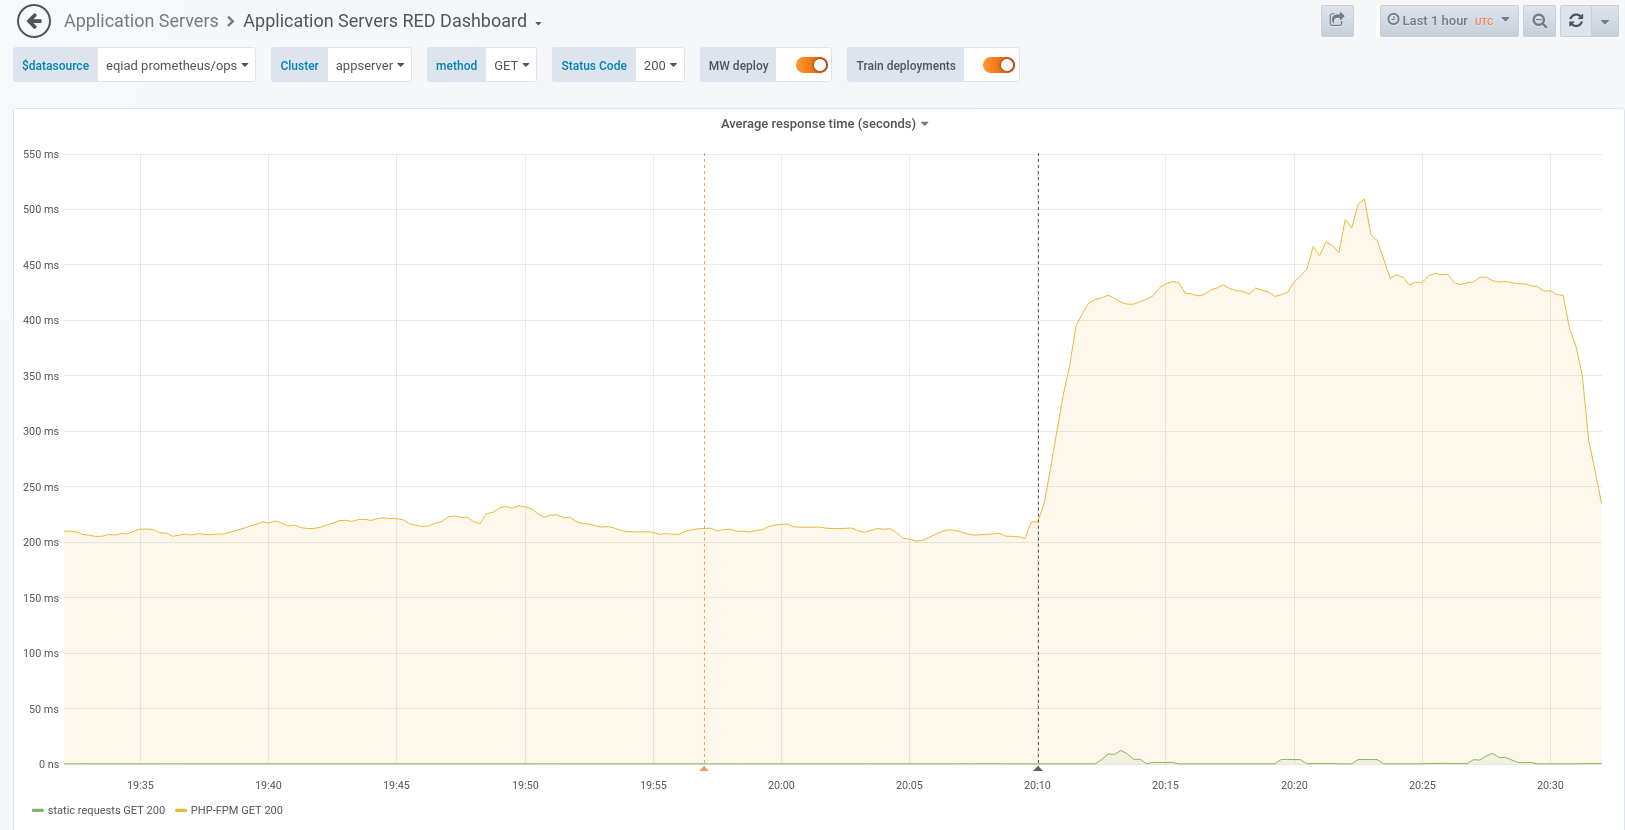
On rollback, situation immediately returned to normal. I didn't observe any serious spike in errors during the window when wmf.16 was fully deployed.

A lightly-edited log from #wikimedia-operations:

13:10 <+logmsgbot> !log brennen@deploy1001 rebuilt and synchronized wikiversions files: all wikis to 1.35.0-wmf.16
13:13 <+icinga-wm> PROBLEM - High average GET latency for mw requests on appserver in eqiad on icinga1001 is CRITICAL: cluster=appserver code=200 handler=proxy:unix:/run/php/fpm-www.sock https://wikitech.wikimedia.org/wiki/Monitoring/Missing_notes_link https://grafana.wikimedia.org/d/RIA1lzDZk/application-servers-red-dashboard?panelId=9&fullscreen&orgId=1&from=now-3h&to=now&var-datasource=eqiad+prometheus/ops&var-cluster=appserver&var-method=GET
13:14 <rlazarus> yow, that's pronounced
13:14 <cdanis> CPU is up a lot
13:14 <mutante> it's during deployment
13:15 <cdanis> yeah
13:15 <cdanis> it is right after the sync-wikiversions
13:15 <brennen> roll back, you think?
13:15 <cdanis> let's see if it continues
13:15 <mutante> i meant to say that it often happens only during the deployment itself
13:15 <cdanis> it's not uncommon to have large CPU consumption right after a deploy
13:15 <mutante> and then recovers
13:15 <mutante> that :)
13:16 <cdanis> btw, plugging the CPU usage heatmap I added to the 'cluster overview' dashboard https://grafana.wikimedia.org/d/000000607/cluster-overview?orgId=1&from=now-30m&to=now&var-datasource=eqiad%20prometheus%2Fops&var-cluster=appserver&var-instance=All&fullscreen&panelId=2607
13:18 <ori> how quickly does it recover?
13:20 <mutante> usually faster than icinga rechecks the grafana graph
13:20 <mutante> but this time it hasnt yet
13:20 <brennen> spike of ~20 "MediaWiki::restInPeace: transaction round 'LinksUpdate::doUpdate' still running" errors a bit ago but otherwise error logs look roughly status quo i think, but CPU still elevated...
13:21 <+icinga-wm> PROBLEM - PHP7 rendering on mw1269 is CRITICAL: CRITICAL - Socket timeout after 10 seconds https://wikitech.wikimedia.org/wiki/Application_servers/Runbook%23PHP7_rendering
13:22 <+icinga-wm> RECOVERY - PHP7 rendering on mw1269 is OK: HTTP OK: HTTP/1.1 200 OK - 75043 bytes in 0.628 second response time https://wikitech.wikimedia.org/wiki/Application_servers/Runbook%23PHP7_rendering
13:26 <brennen> cdanis, rlazarus: doesn't seem to be tapering off.
13:27 <mutante> yea, this case looks different
13:27  * brennen rolling back.
13:30 <+logmsgbot> !log brennen@deploy1001 rebuilt and synchronized wikiversions files: Revert "group2 wikis to 1.35.0-wmf.15"
13:32 <brennen> well, that's pretty much an immediate effect.
13:32 <rlazarus> yup that's an "it hurts when I do this" graph
13:33 <cdanis> hopefully whatever is going on is just as obvious in profiling :)

Event Timeline

brennen triaged this task as Unbreak Now! priority.Jan 23 2020, 8:46 PM

I assume that this issue didn't occur when rolling out to any other group? i.e., there was no noticeable spike in CPU usage after group1?

If that's the case, what do we need to pinpoint the cause here? Should we roll-forward on mwdebug boxen and see if we can reproduce? Is that helpful?

I assume that this issue didn't occur when rolling out to any other group? i.e., there was no noticeable spike in CPU usage after group1?

I didn't think there was anything pronounced, by contrast to the group2 deploy:

Response times 2020-01-22 to 23: https://grafana.wikimedia.org/d/RIA1lzDZk/application-servers-red-dashboard?panelId=9&fullscreen&orgId=1&from=1579651200000&to=1579823999000&var-datasource=eqiad%20prometheus%2Fops&var-cluster=appserver&var-method=GET

Although this kind of looks like elevated CPU for a bit after the group1 deploy, which might align with T243601?

https://grafana.wikimedia.org/d/000000607/cluster-overview?orgId=1&from=1579719600000&to=1579726800000&fullscreen&panelId=2607

Zooming out to a wider time range, I'm not sure if that looks like anything other than noise, though.

Per conversation with @Addshore and @Catrope just now, we're wondering if this could be related to the following work:

$ git log --pretty=oneline --stat remotes/origin/wmf/1.35.0-wmf.15..remotes/origin/wmf/1.35.0-wmf.16 includes/TemplateParser.php
821d8c8e301d73ea77093689c707af84ebd7ab71 TemplateParser: Change cache key and version cache
 includes/TemplateParser.php | 4 +++-
 1 file changed, 3 insertions(+), 1 deletion(-)
82faff75ee9432b42ff79f2288b6bc83a6d6d491 TemplateParser: Use LightnCandy::prepare() instead eval()
 includes/TemplateParser.php | 30 +++---------------------------
 1 file changed, 3 insertions(+), 27 deletions(-)
7c4e9f790a48bedc1c314162a5fd2068faae1cb1 Update zordius/lightncandy v0.23 to v1.2.4
 includes/TemplateParser.php | 16 ++++++++++++++++
 1 file changed, 16 insertions(+)

Planning to cherry-pick 565155: Revert "TemplateParser: Use LightnCandy::prepare() instead eval()" to wmf.16 and try again here.

Mentioned in SAL (#wikimedia-operations) [2020-02-03T21:28:31Z] <brennen@deploy1001> Synchronized php-1.35.0-wmf.16/includes/TemplateParser.php: Syncing https://gerrit.wikimedia.org/r/c/mediawiki/core/+/569643 for T243548 (duration: 01m 08s)

Rolling to group2 appeared to coincide again with a spike in response times and, this time, exceptions/fatals:

14:32 <addshore> i guess its not that then
14:33 <+logmsgbot> !log brennen@deploy1001 rebuilt and synchronized wikiversions files: all wikis to 1.35.0-wmf.16
14:33 <+stashbot> Logged the message at https://wikitech.wikimedia.org/wiki/Server_Admin_Log
14:33 <brennen> welp.
14:35 <+icinga-wm> PROBLEM - High average GET latency for mw requests on appserver in eqiad on icinga1001 is CRITICAL: cluster=appserver code={200,204} handler=proxy:unix:/run/php/fpm-www.sock https://wikitech.wikimedia.org/wiki/Monitoring/Missing_notes_link https://grafana.wikimedia.org/d/RIA1lzDZk/application-servers-red-dashboard?panelId=9&fullscreen&orgId=1&from=now-3h&to=now&var-datasource=eqiad+prometheus/ops&var-cluster=appserver&var-method=
14:35 <brennen> rolling back.
14:39 <+logmsgbot> !log brennen@deploy1001 rebuilt and synchronized wikiversions files: Revert "group2 wikis to 1.35.0-wmf.15"
14:39 <+stashbot> Logged the message at https://wikitech.wikimedia.org/wiki/Server_Admin_Log
14:39 <+icinga-wm> PROBLEM - MediaWiki exceptions and fatals per minute on icinga1001 is CRITICAL: cluster=logstash job=statsd_exporter level=ERROR site=eqiad https://wikitech.wikimedia.org/wiki/Application_servers https://grafana.wikimedia.org/d/000000438/mediawiki-alerts?panelId=2&fullscreen&orgId=1&var-datasource=eqiad+prometheus/ops

Rolled back after waiting a few minutes for response times to level out and noticing an increase in errors. It's possible I jumped the gun and things are just noisy in general at the moment, but I don't *think* so.

After discussion with @thcipriani and combing over graphs / logs from earlier, it started to look like the spike here might be purely coincidental. Things seem essentially stable since a redeploy at 23:24:52. I'll monitor for the next few hours and treat this as resolved if it doesn't flare back up.

brennen claimed this task.