Page MenuHomePhabricator

k8s/mw: traffic to eventgate dropped by iptables
Open, MediumPublic

Description

See https://logstash.wikimedia.org/goto/e7950355bc1e9f8687d9792a95672bdc

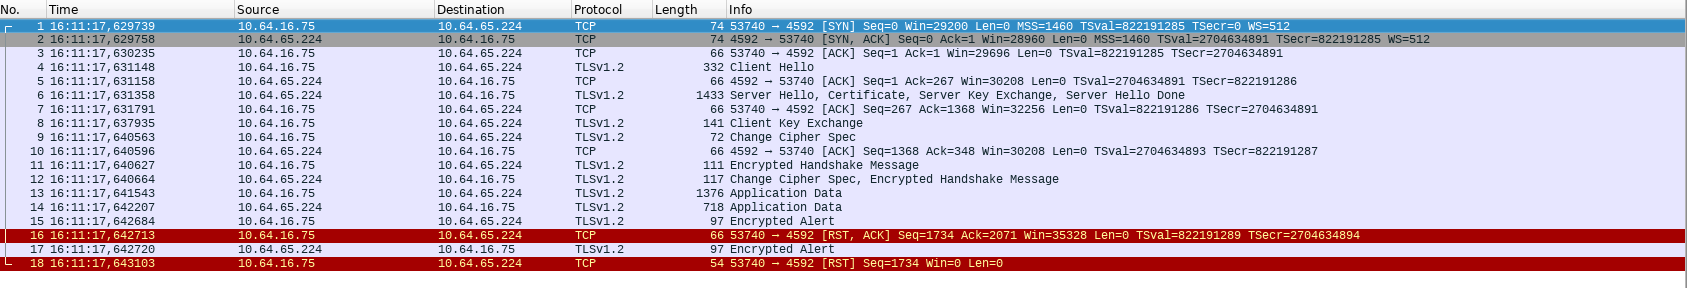
On March 18th (with a previous spike around March 11th), kubernetes hosts started logging a large amount of discarded (by iptables) packets from mw IPs towards eventgate-analytics.svc.eqiad:4592 and eventgate-main.svc.eqiad:4492

It's not urgent, but:
1/ It might be the sign of a miss-configuration or larger issue
2/ It floods the logs with ~30000messages/h :)

Please investigate it and either stop/re-configure what is sending the packets being dropped, or update Ferm to permit them.

Thanks!

Event Timeline

akosiaris triaged this task as Medium priority.Apr 8 2020, 4:13 PM

I 've did a quick investigation and I have a pcap capture capture attached to this task (no PII in there, no worries, everything is encrypted. I also attach an image for those that don't want to fire up wireshark for it.

2020-04-08_18-50.png (288×1 px, 78 KB)

This dump is from a container itself, not the kubernetes host. The reason I dumped there is to have a smaller amount of packets to go through. What is important to note here is that the first endpoint appears to be the kubernetes host, but that's due to SNAT (the way kubeproxy works). The original client is envoy on some mw host. The other endpoint is envoy that runs in the container.

What I notice is that envoy on the client side (envoy on a mediawiki host) sends an encrypted alert and then immediately an RST (and presumably closes the connection). The other end tries to send an encrypted alert again and then gets back an RST. That's probably the RST we are seeing.

Judging by the 1st encrypted alert and the immediate RST, that 1st Encrypted alert is almost certainly of type CLOSE_NOTIFY and it's pretty normal to be sent at the end of a connection (IIRC, HTTP connections are assumed to be short lived and generally don't follow the FIN, FIN/ACK, ACK dance that normal TCP connections do). I am not sure what the second encrypted alert is (probably the same?), but this generates from the client the RST response which is probably what gets stopped from the firewall.

We 'll have to dig in the envoy code to make sure that my hypothesis above is correct, maybe we can find some tuneable to make the client envoy not close the connection so abruptly.

Overall it doesn't not look like it threatens the service itself, it started showing up so much when we switched from talking directly to the services to talking to them via envoy TLS termination.

pcap:

akosiaris claimed this task.

I am gonna tentatively resolve this task. Last updated was >2.5 years ago, it quite possibly doesn't even apply anymore.

I opened T325806: Help refreshing firewall dashboards to get the dashboard back online, I'll re-open it if there is any need. Thanks!

Reopening this task as the issue is still happening. Thanks to o11y the dashboard has been refreshed and have more informations (TCP flags, source/dest hostnames).

Across the whole infra, most of the traffic dropped by iptables are RST packets on kubernetes hosts at a rate of ~3000/min.
See https://logstash.wikimedia.org/goto/4abeedb79fbb6ce17c12c884e60d7d3d

I looked at this last week, and while I didn't get to the bottom of it, my suspicion here is that the logs are due to a race-condition when the connection terminates.

I specifically was looking at the pcap of the tcp sessions initiated by blazegraph on wqds1013 to eventgate.

It seems to me that the client is configured to always send a RST immediately after the FIN it sends. My speculation is it is doing so to quickly close the state on the server, given the short-lived connections it uses, rather than have many connections in the TIME_WAIT state.

Based on the packet capture for most connections there is no problem, and no error logs. The client connects, sends some data, sends a FIN/ACK and then immediately a RST. The server does not send any packets after the FIN and RST. This is shown in this packet capture:

In some cases, however, the client sends multiple RSTs, and we have errors logged, see the below exchange for an example:

Looks to me like this happens when the server also tries to actively close the connection. My guess is in both scenarios client and server know the exchange is over, and both are ready to close the connection. In most cases the client sends its FIN and RST before the server has done anything, and the server tears things down without any more communication. In some cases, however, I'm guessing the server actually starts to close the connection before it gets the FIN and RST from client. And as per this capture sends a HTTP close (packet 18), then FIN (20) and an ACK to the clients FIN (22).

As the client has already sent a RST, and torn down the connection, there is no conntrack entry for it when these 3 packets reach the client. Which causes them to be logged.

If the client did not send the RST immediately on close, trying to hard-reset the session, this would not happen I think. But that may be desirable behaviour for short lived connections like this. I did spend some time looking at the various code-bases involved to find where this might be configured, I believe this is the behvaiour in Linux if SO_LINGER is set to 0 for the connection. But I didn't find where it was explicitly set to do so by default, our configuration does not seem to have anything to specifically enable it.

FYI this seems very similar to what i observed with the mysql <-> mw connections https://phabricator.wikimedia.org/T238823#8597868. For that case it seemd like the issue may only be present for cross dc traffic

Adding one more data point that just might be in some cases related: in T292663 we noticed (after going first down the wrong rabbithole) that in some cases we have connections mw (envoy) -> shellbox (envoy) timing out due to the 250ms connect_timeout configuration we have in those envoys. An interesting graph to paste is the p99 of connection establishment timings.

image.png (1×2 px, 462 KB)

p99 varies a lot and peaks are often above the 200ms mark. Adding also that depooling a host from all traffic made it impossible to reproduce this.

It is not inconceivable some percentage of these RSTs (sent by the client in this case) are because the connection has been already been closed on the client side before a packet, sent by the server, has been received. I don't have data to corroborate this right now, adding it as a hypothesis for when I got time to dive into this deeper.