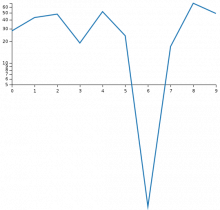
Graph extension ignores or doesn't render "clip" for marks. This feature is useful for plotting parts of larger datasets just with domainMin or ...Max without need to transform data.
Steps to Reproduce:
for actual results see sandbox on wiki or use Graph JSON on GraphSandbox
for expected results copy Vega JSON below to Vega editor
Actual Results:
Expected Results:
since Graph is not 100% compatible with vega syntax below is modified graph JSON working with Vega editor
For this case required change is to replace "properties" with "encoding" in marks.
Graph JSON
{
	"version":2,
  "width": 500,
  "height": 200,


  "data": [
    {
      "name": "table",
      "values": [
        {"x": 0, "y": 28, "c":0},
        {"x": 1, "y": 43, "c":0},
        {"x": 2, "y": 48, "c":0},
        {"x": 3, "y": 19, "c":0},
        {"x": 4, "y": 52, "c":0},
        {"x": 5, "y": 24, "c":0},
        {"x": 6, "y": 1, "c":0},
        {"x": 7, "y": 17, "c":0},
        {"x": 8, "y": 68, "c":0},
        {"x": 9, "y": 49, "c":0}
      ]
    }
  ],

  "scales": [
    {
      "name": "x",
      "type": "linear",
      "range": "width",
      "domain": {"data": "table", "field": "x"}
    },
    {
      "name": "y",
      "type": "log",
      "range": "height",
      "nice": false,
      "clamp": false,
      "zero": true,
      "domain": {"data": "table", "field": "y"},
      "domainMin": 5
    }
  ],
  "axes": [
    {"type":"x","format":"g", "scale": "x","orient":"bottom"},
    {"type":"y","format":"g","scale": "y","orient":"left"}

  ],

 "marks":
  [
    {
         "type": "line",
         "clip":true,
          "from": {"data": "table"},
          "properties": {
            "enter": {
              "x": {"scale": "x", "field": "x"},
              "y": {"scale": "y", "field": "y"},
              "strokeWidth": {"value": 2.5},
              "stroke": {"value": "#1f77b4"}
              }
            }
    }
  ]
}
Vega JSON
{
	"version":2,
  "width": 500,
  "height": 200,


  "data": [
    {
      "name": "table",
      "values": [
        {"x": 0, "y": 28, "c":0},
        {"x": 1, "y": 43, "c":0},
        {"x": 2, "y": 48, "c":0},
        {"x": 3, "y": 19, "c":0},
        {"x": 4, "y": 52, "c":0},
        {"x": 5, "y": 24, "c":0},
        {"x": 6, "y": 1, "c":0},
        {"x": 7, "y": 17, "c":0},
        {"x": 8, "y": 68, "c":0},
        {"x": 9, "y": 49, "c":0}
      ]
    }
  ],

  "scales": [
    {
      "name": "x",
      "type": "linear",
      "range": "width",
      "domain": {"data": "table", "field": "x"}
    },
    {
      "name": "y",
      "type": "log",
      "range": "height",
      "nice": false,
      "clamp": false,
      "zero": true,
      "domain": {"data": "table", "field": "y"},
      "domainMin": 5
    }
  ],
  "axes": [
    {"type":"x","format":"g", "scale": "x","orient":"bottom"},
    {"type":"y","format":"g","scale": "y","orient":"left"}

  ],

 "marks":
  [
    {
         "type": "line",
         "clip":true,
          "from": {"data": "table"},
          "encode": {
            "enter": {
              "x": {"scale": "x", "field": "x"},
              "y": {"scale": "y", "field": "y"},
              "strokeWidth": {"value": 2.5},
              "stroke": {"value": "#1f77b4"}
              }
            }
    }
  ]
}
