Page MenuHomePhabricator

Tendril mysql is stalling
Closed, ResolvedPublic

Description

Cross posting from T231185#6107666 and T231185#6122136

Tue May 5th:

We had an issue with tendril today where tendril was very slow and almost unresponsive, at first I thought it was another case of T231769: Investigate possible memory leak on db1115, but it wasn't.
First of all we realized that after restarting mysql we got some errors with TokuDB not being loaded:

daemon.log:May  5 05:00:00 db1115 mysqld[1029]: 2020-05-05  5:00:00 140204559673088 [ERROR] Event Scheduler: [root@208.80.154.151][tendril.tendril_global_status_log_5m] Unknown storage engine 'TokuDB'

That resulted on a tables failing. This was due to a mistake on https://gerrit.wikimedia.org/r/#/c/operations/puppet/+/585115/3/modules/profile/templates/mariadb/mysqld_config/tendril.my.cnf.erb which as been fixed with: https://gerrit.wikimedia.org/r/#/c/operations/puppet/+/594405/

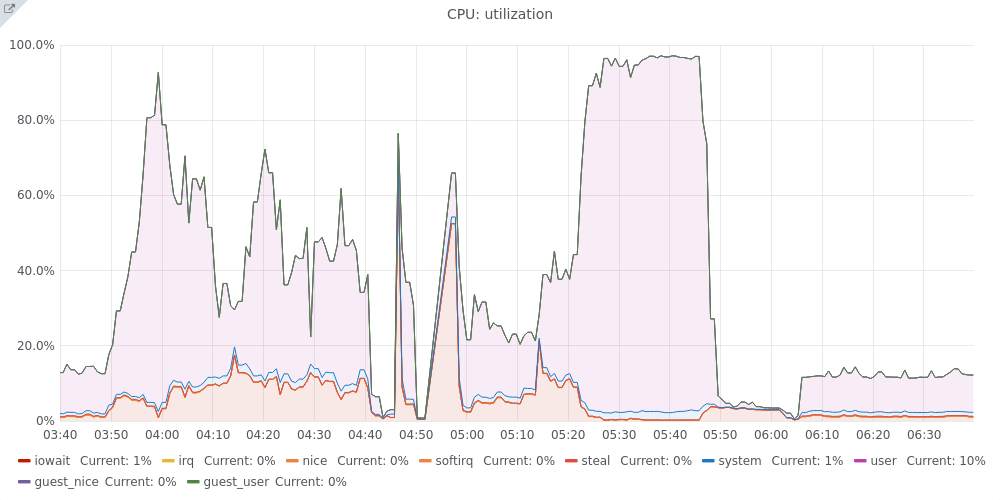
However, after manually enabling TokuDB we also saw that the host was super loaded as soon as MySQL was started, and the CPU was over the roof:

05:31:43 up 36 min,  3 users,  load average: 64.56, 57.27, 36.13

host-overview (5).png (500×1 px, 86 KB)

The host was full of connections that were piling up, but one of them was taking ages to complete:

| 240574 | root     | 10.64.32.25       | tendril            | Connect |  852 | Copying to tmp table | insert into processlist_query_log
        (server_id, stamp, id, user, host, db, time, info)
        select p.server_id, now(), p.id, p.user, p.host, p.db, p.time, p.info
        from processlist p
        left join processlist_query_log q
          on q.server_id = @server_id
          and p.id = q.id
          and p.user = q.user
          and p.host = q.host
          and p.db = q.db
          and p.info = q.info
          and p.time > q.time
          and q.stamp > now() - interval 7 day
        where
          p.server_id = @server_id
          and p.command = 'Query'
          and q.server_id is null

That was the only query that would remain running after stopping the event scheduler.
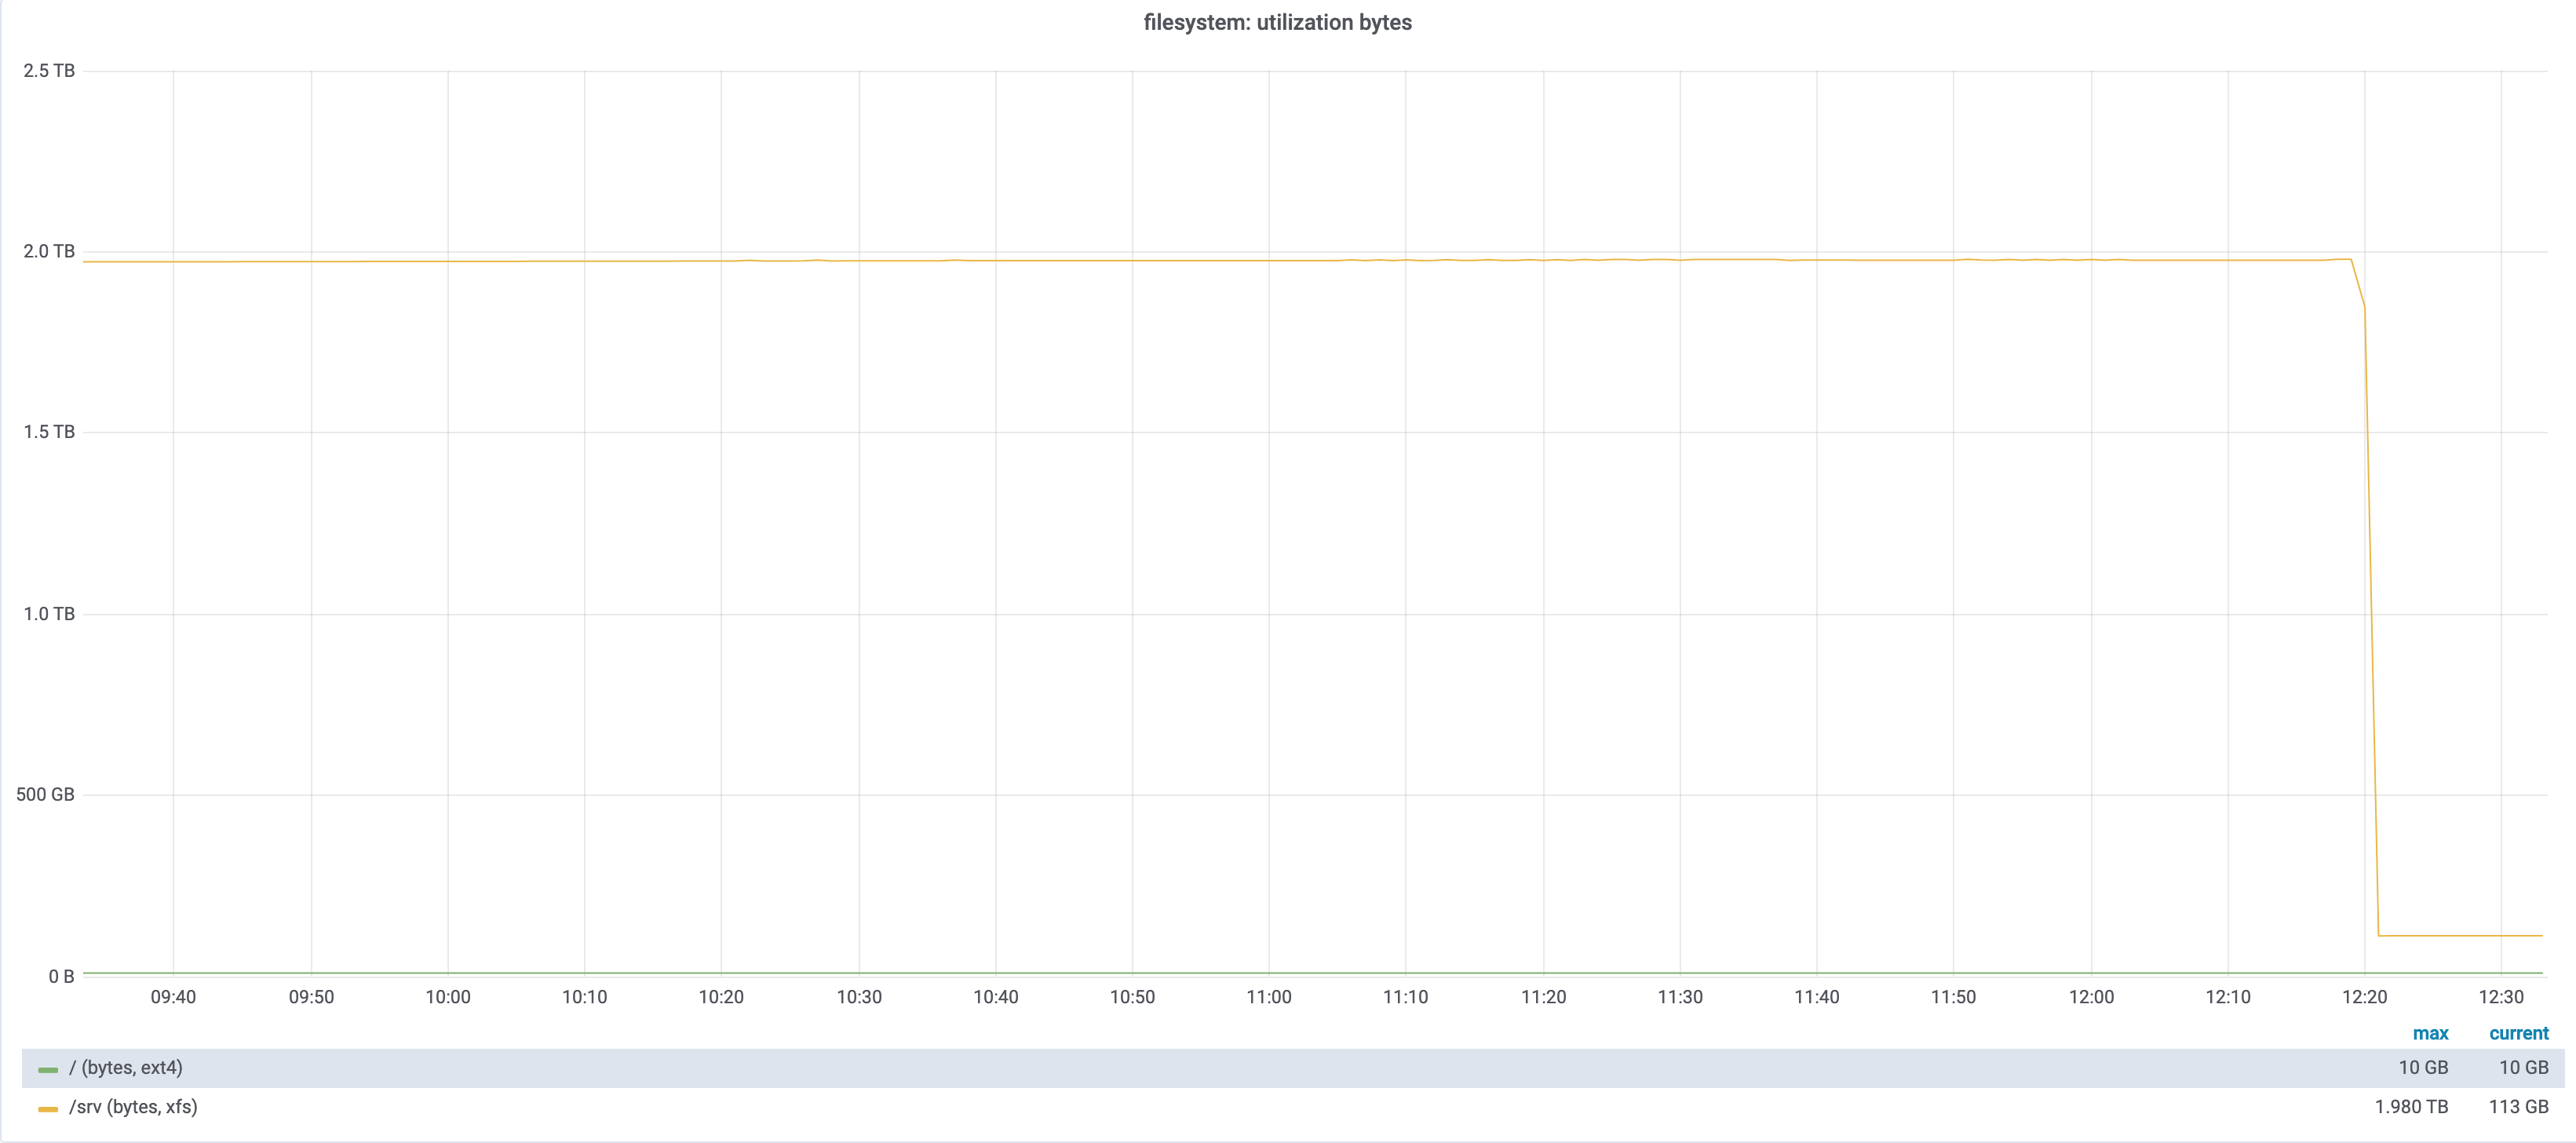
One of the involved tables is: processlist_query_log which is a huge table:

1-rw-rw---- 1 mysql mysql 5.2K May 5 04:57 processlist_query_log.frm
2-rw-rw---- 1 mysql mysql 424 May 5 00:00 processlist_query_log.par
3-rw-rw---- 1 mysql mysql 2.9G Apr 7 01:34 processlist_query_log#P#p737886.ibd
4-rw-rw---- 1 mysql mysql 3.8G Apr 8 01:32 processlist_query_log#P#p737887.ibd
5-rw-rw---- 1 mysql mysql 3.0G Apr 9 00:03 processlist_query_log#P#p737888.ibd
6-rw-rw---- 1 mysql mysql 3.0G Apr 10 02:15 processlist_query_log#P#p737889.ibd
7-rw-rw---- 1 mysql mysql 3.0G Apr 11 02:42 processlist_query_log#P#p737890.ibd
8-rw-rw---- 1 mysql mysql 2.8G Apr 12 02:43 processlist_query_log#P#p737891.ibd
9-rw-rw---- 1 mysql mysql 2.7G Apr 13 03:11 processlist_query_log#P#p737892.ibd
10-rw-rw---- 1 mysql mysql 3.3G Apr 14 02:21 processlist_query_log#P#p737893.ibd
11-rw-rw---- 1 mysql mysql 3.2G Apr 15 03:15 processlist_query_log#P#p737894.ibd
12-rw-rw---- 1 mysql mysql 2.8G Apr 16 03:08 processlist_query_log#P#p737895.ibd
13-rw-rw---- 1 mysql mysql 3.1G Apr 17 03:21 processlist_query_log#P#p737896.ibd
14-rw-rw---- 1 mysql mysql 2.7G Apr 18 03:22 processlist_query_log#P#p737897.ibd
15-rw-rw---- 1 mysql mysql 3.9G Apr 19 03:23 processlist_query_log#P#p737898.ibd
16-rw-rw---- 1 mysql mysql 3.2G Apr 20 03:25 processlist_query_log#P#p737899.ibd
17-rw-rw---- 1 mysql mysql 3.2G Apr 21 06:07 processlist_query_log#P#p737900.ibd
18-rw-rw---- 1 mysql mysql 3.2G Apr 22 03:52 processlist_query_log#P#p737901.ibd
19-rw-rw---- 1 mysql mysql 2.9G Apr 23 03:42 processlist_query_log#P#p737902.ibd
20-rw-rw---- 1 mysql mysql 2.9G Apr 24 03:42 processlist_query_log#P#p737903.ibd
21-rw-rw---- 1 mysql mysql 3.0G Apr 25 03:44 processlist_query_log#P#p737904.ibd
22-rw-rw---- 1 mysql mysql 3.1G Apr 26 03:45 processlist_query_log#P#p737905.ibd
23-rw-rw---- 1 mysql mysql 2.8G Apr 27 03:48 processlist_query_log#P#p737906.ibd
24-rw-rw---- 1 mysql mysql 3.3G Apr 28 00:19 processlist_query_log#P#p737907.ibd
25-rw-rw---- 1 mysql mysql 3.3G Apr 29 00:59 processlist_query_log#P#p737908.ibd
26-rw-rw---- 1 mysql mysql 3.2G Apr 30 00:57 processlist_query_log#P#p737909.ibd
27-rw-rw---- 1 mysql mysql 3.3G May 1 00:54 processlist_query_log#P#p737910.ibd
28-rw-rw---- 1 mysql mysql 11G May 2 00:58 processlist_query_log#P#p737911.ibd
29-rw-rw---- 1 mysql mysql 16G May 3 00:56 processlist_query_log#P#p737912.ibd
30-rw-rw---- 1 mysql mysql 15G May 4 00:56 processlist_query_log#P#p737913.ibd
31-rw-rw---- 1 mysql mysql 14G May 5 01:00 processlist_query_log#P#p737914.ibd
32-rw-rw---- 1 mysql mysql 2.5G May 5 05:55 processlist_query_log#P#p737915.ibd
33-rw-rw---- 1 mysql mysql 160K May 5 00:03 processlist_query_log#P#p737916.ibd

According to the ibd creation dates, it looks like the partitions are purged every month, but for some reason they had lots of rows lately.
For instance:

-rw-rw---- 1 mysql mysql  11G May  2 00:58 processlist_query_log#P#p737911.ibd

-rw-rw---- 1 mysql mysql  16G May  3 00:56 processlist_query_log#P#p737912.ibd

-rw-rw---- 1 mysql mysql  15G May  4 00:56 processlist_query_log#P#p737913.ibd

That's lots of rows for just 24h.

The subquery involving a left join on that huge table was likely going to take hours, creating those CPU usages.
After truncating the table, everything went back to normal, as that query is now able to finish quickly as the table decreased its size.

For some reason, seeing the file sizes, something has made the partitions to increase almost 5 times since 1st May. Normally it used to be around 3GB or 4GB per day, but since 1st May they are bigger than 10GB. That needs some investigation too.

Sun May 9th

IRC alerts start to show the issue (times in UTC):

[18:00:49] <icinga-wm>	 PROBLEM - HTTPS-dbtree on dbmonitor1001 is CRITICAL: CRITICAL - Socket timeout after 10 seconds https://wikitech.wikimedia.org/wiki/Dbtree.wikimedia.org
[18:04:27] <icinga-wm>	 RECOVERY - HTTPS-dbtree on dbmonitor1001 is OK: HTTP OK: HTTP/1.1 200 OK - 85088 bytes in 9.106 second response time https://wikitech.wikimedia.org/wiki/Dbtree.wikimedia.org
[18:24:49] <icinga-wm>	 PROBLEM - HTTPS-dbtree on dbmonitor1001 is CRITICAL: CRITICAL - Socket timeout after 10 seconds https://wikitech.wikimedia.org/wiki/Dbtree.wikimedia.org
[18:30:19] <icinga-wm>	 RECOVERY - HTTPS-dbtree on dbmonitor1001 is OK: HTTP OK: HTTP/1.1 200 OK - 85467 bytes in 8.924 second response time https://wikitech.wikimedia.org/wiki/Dbtree.wikimedia.org
[18:35:53] <icinga-wm>	 PROBLEM - HTTPS-dbtree on dbmonitor1001 is CRITICAL: CRITICAL - Socket timeout after 10 seconds https://wikitech.wikimedia.org/wiki/Dbtree.wikimedia.org
[18:43:23] <icinga-wm>	 RECOVERY - HTTPS-dbtree on dbmonitor1001 is OK: HTTP OK: HTTP/1.1 200 OK - 85560 bytes in 9.687 second response time https://wikitech.wikimedia.org/wiki/Dbtree.wikimedia.org
[18:54:37] <icinga-wm>	 PROBLEM - HTTPS-dbtree on dbmonitor1001 is CRITICAL: CRITICAL - Socket timeout after 10 seconds https://wikitech.wikimedia.org/wiki/Dbtree.wikimedia.org
[19:03:53] <icinga-wm>	 RECOVERY - HTTPS-dbtree on dbmonitor1001 is OK: HTTP OK: HTTP/1.1 200 OK - 85565 bytes in 9.664 second response time https://wikitech.wikimedia.org/wiki/Dbtree.wikimedia.org
[19:13:11] <icinga-wm>	 PROBLEM - HTTPS-dbtree on dbmonitor1001 is CRITICAL: CRITICAL - Socket timeout after 10 seconds https://wikitech.wikimedia.org/wiki/Dbtree.wikimedia.org

Sun May 10th:

IRC alerts continue (times in UTC):

[00:46:34] <icinga-wm>	 RECOVERY - Check systemd state on an-launcher1001 is OK: OK - running: The system is fully operational https://wikitech.wikimedia.org/wiki/Monitoring/check_systemd_state
[02:59:12] <icinga-wm>	 RECOVERY - HTTPS-dbtree on dbmonitor1001 is OK: HTTP OK: HTTP/1.1 200 OK - 81635 bytes in 9.852 second response time https://wikitech.wikimedia.org/wiki/Dbtree.wikimedia.org
[03:08:36] <icinga-wm>	 PROBLEM - HTTPS-dbtree on dbmonitor1001 is CRITICAL: CRITICAL - Socket timeout after 10 seconds https://wikitech.wikimedia.org/wiki/Dbtree.wikimedia.org
[03:12:16] <icinga-wm>	 RECOVERY - HTTPS-dbtree on dbmonitor1001 is OK: HTTP OK: HTTP/1.1 200 OK - 82035 bytes in 8.368 second response time https://wikitech.wikimedia.org/wiki/Dbtree.wikimedia.org
[03:17:48] <icinga-wm>	 PROBLEM - HTTPS-dbtree on dbmonitor1001 is CRITICAL: CRITICAL - Socket timeout after 10 seconds https://wikitech.wikimedia.org/wiki/Dbtree.wikimedia.org
[03:32:34] <icinga-wm>	 RECOVERY - HTTPS-dbtree on dbmonitor1001 is OK: HTTP OK: HTTP/1.1 200 OK - 81955 bytes in 5.473 second response time https://wikitech.wikimedia.org/wiki/Dbtree.wikimedia.org
[03:38:16] <icinga-wm>	 PROBLEM - HTTPS-dbtree on dbmonitor1001 is CRITICAL: CRITICAL - Socket timeout after 10 seconds https://wikitech.wikimedia.org/wiki/Dbtree.wikimedia.org
[03:40:04] <icinga-wm>	 RECOVERY - HTTPS-dbtree on dbmonitor1001 is OK: HTTP OK: HTTP/1.1 200 OK - 83275 bytes in 7.526 second response time https://wikitech.wikimedia.org/wiki/Dbtree.wikimedia.org
[03:45:42] <icinga-wm>	 PROBLEM - HTTPS-dbtree on dbmonitor1001 is CRITICAL: CRITICAL - Socket timeout after 10 seconds https://wikitech.wikimedia.org/wiki/Dbtree.wikimedia.org
[04:11:48] <icinga-wm>	 RECOVERY - HTTPS-dbtree on dbmonitor1001 is OK: HTTP OK: HTTP/1.1 200 OK - 81635 bytes in 9.260 second response time https://wikitech.wikimedia.org/wiki/Dbtree.wikimedia.org
[04:17:26] <icinga-wm>	 PROBLEM - HTTPS-dbtree on dbmonitor1001 is CRITICAL: CRITICAL - Socket timeout after 10 seconds https://wikitech.wikimedia.org/wiki/Dbtree.wikimedia.org
[04:23:00] <icinga-wm>	 RECOVERY - HTTPS-dbtree on dbmonitor1001 is OK: HTTP OK: HTTP/1.1 200 OK - 81675 bytes in 9.036 second response time https://wikitech.wikimedia.org/wiki/Dbtree.wikimedia.org
[04:28:36] <icinga-wm>	 PROBLEM - HTTPS-dbtree on dbmonitor1001 is CRITICAL: CRITICAL - Socket timeout after 10 seconds https://wikitech.wikimedia.org/wiki/Dbtree.wikimedia.org

At around 06:46 investigation starts and this is the cross posting:

This has happened again:

root@cumin1001:~# mysql.py -hdb1115 -e "show processlist" | grep Copy
35178632	root	10.64.32.25	tendril	Connect	15049	Copying to tmp table	insert into processlist_query_log \n        (server_id, stamp, id, user, host, db, time, info)\n       	0.000
35964338	root	10.64.32.13	tendril	Connect	5533	Copying to tmp table	insert into processlist_query_log\n        (server_id, stamp, id, user, host, db, time, info)\n       	0.000
36340984	root	10.64.32.13	tendril	Connect	1032	Copying to tmp table	insert into processlist_query_log\n        (server_id, stamp, id, user, host, db, time, info)\n       	0.000
36421610	root	10.64.32.25	tendril	Connect	10	Copying to tmp table	insert into processlist_query_log\n        (server_id, stamp, id, user, host, db, time, info)\n       	0.000
36423267	root	10.64.32.25	tendril	Connect	2	Copying to tmp table	insert into processlist_query_log\n        (server_id, stamp, id, user, host, db, time, info)\n       	0.000
36429799	root	10.64.32.25	tendril	Connect	0	Copying to tmp table	insert into strings (string)\n                  select lower(concat( NAME_CONST('con_prefix',_latin1'	0.000

For some reason that processlist_query_log table is getting lots more data and the select which is under that insert take ages to complete:

-rw-rw---- 1 mysql mysql  11G May  6 00:56 processlist_query_log#P#p737915.ibd
-rw-rw---- 1 mysql mysql  16G May  7 00:56 processlist_query_log#P#p737916.ibd
-rw-rw---- 1 mysql mysql  16G May  8 00:57 processlist_query_log#P#p737917.ibd
-rw-rw---- 1 mysql mysql  15G May  9 01:01 processlist_query_log#P#p737918.ibd
-rw-rw---- 1 mysql mysql 9.2G May 10 06:27 processlist_query_log#P#p737919.ibd
-rw-rw---- 1 mysql mysql  48M May 10 06:47 processlist_query_log#P#p737920.ibd

After truncating processlist_query_log again I stopped the event_scheduler to let all the threads stop, once it was fully clean, I started it but the spike was massive and the host stalled again.
Finally, I restarted MySQL.

CPU graph is scary with a sudden spike:

Captura de pantalla 2020-05-10 a las 9.13.28.png (512×1 px, 125 KB)

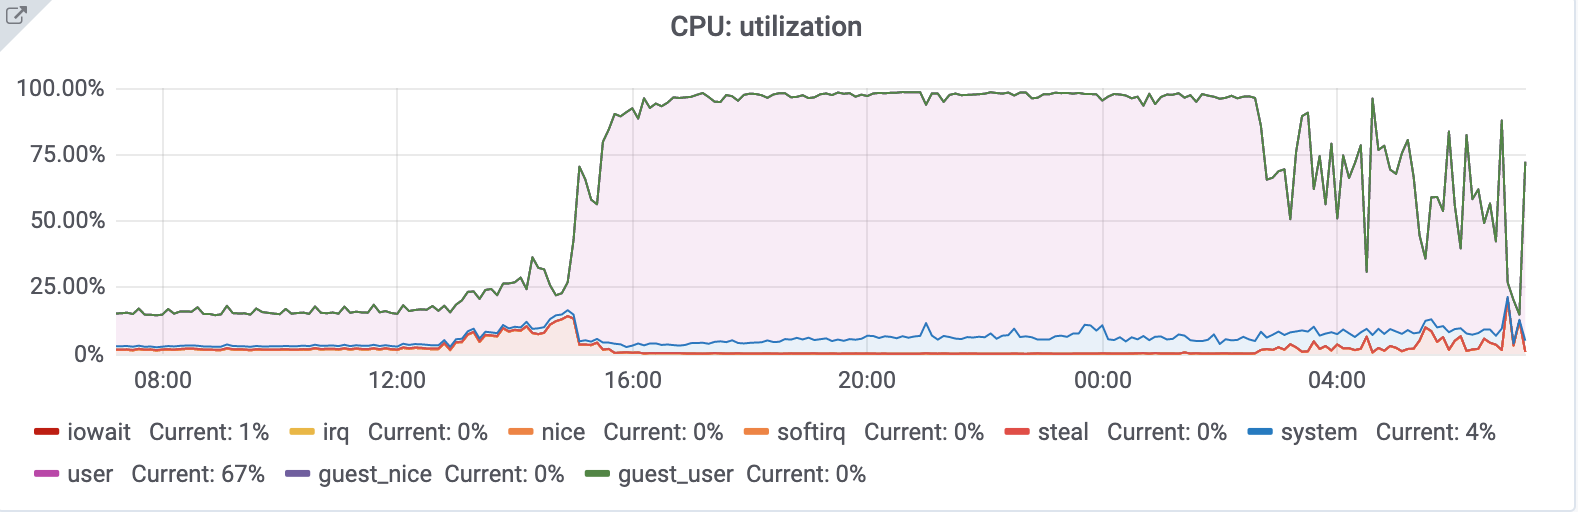
After restarting mysql the server went back to crazy values and had like 1200 connections again

I am still investigating

Event Timeline

Marostegui created this task.

Right after restarting mysql:

07:35:12 up 5 days,  2:39,  2 users,  load average: 492.22, 411.17, 215.39

Also noticed lots of:

delete from global_status where server_id = @server_id and variable_name not like '%.%'

They were taking ages to complete cause that table was around 15GB (and I don't think we ever use it really - as it gets filled on every iteration for each's server procedure):

mysql:root@localhost [tendril]>  select * from global_variables limit 10;
+-----------+---------------------------------------------------+----------------+
| server_id | variable_name                                     | variable_value |
+-----------+---------------------------------------------------+----------------+
|      1101 | max_prepared_stmt_count                           | 16382          |
|      1101 | innodb_write_io_threads                           | 8              |
|      1101 | have_crypt                                        | YES            |
|      1101 | performance_schema_events_waits_history_long_size | -1             |
|      1101 | innodb_compression_pad_pct_max                    | 50             |
|      1101 | performance_schema_max_cond_classes               | 80             |
|      1101 | relay_log                                         |                |
|      1101 | performance_schema_max_cond_instances             | -1             |
|      1101 | performance_schema_max_rwlock_classes             | 40             |
|      1101 | innodb_flush_log_at_timeout                       | 1              |
+-----------+---------------------------------------------------+----------------+
10 rows in set (0.00 sec)

Queries like the following were also doing massive scans:

mysql:root@localhost [tendril]> explain select  `server_id`, `variable_value` from tendril.global_variables  where `server_id` in (1227,1228,1229,1230,1231,1232,1233,1234,1235,1270,1271,1272,1273,1274,1275,1276,1277,1278,1281,1282,1283,1303,1304,1305,1306,1307,1308,1310,1311,1312,1313,1314,1315,1316,1317,1318,1334,1342,1344,1345,1352,1358,1366,1370,1373,1374,1375,1378,1379,1381,1389,1390,1391,1392,1394,1395,1397,1399,1400,1408,1409,1410,1413,1422,1423,1425,1426,1427,1434,1438,1440,1448,1449,1453,1455,1456,1461,1463,1468,1478,1480,1481,1486,1487,1488,1489,1490,1491,1492,1493,1494,1497,1498,1499,1500,1501,1502,1503,1504,1505,1506,1513,1528,1531,1532,1534,1535,1537,1541,1553,1558,1559,1560,1561,1562,1563,1564,1565,1567,1569,1570,1595,1596,1597,1598,1599,1600,1602,1603,1605,1607,1608,1609,1610,1611,1612,1614,1616,1617,1618,1620,1621,1622,1623,1627,1628,1629,1630,1631,1632,1633,1634,1636,1637,1638,1640,1645,1648,1649,1650,1651,1652,1654,1655,1656,1657,1660,1662,1663,1664,1665,1669,1670,1671,1672,1674,1675,1676,1677,1679,1680,1681,1682,1683,1684,1685,1686,1687,1688,1690,1691,1692,1693,1694,1695,1696,1697,1698,1699,1700,1701,1705,1706,1707,1708,1710,1711,1712,1713,1714,1715,1716) and `variable_name` = 'version';
+------+-------------+------------------+------+---------------+------+---------+------+---------+-------------+
| id   | select_type | table            | type | possible_keys | key  | key_len | ref  | rows    | Extra       |
+------+-------------+------------------+------+---------------+------+---------+------+---------+-------------+
|    1 | SIMPLE      | global_variables | ALL  | i1            | NULL | NULL    | NULL | 3545683 | Using where |
+------+-------------+------------------+------+---------------+------+---------+------+---------+-------------+
1 row in set (0.86 sec)

I truncated it (and the data already got repopulated for each server).

Most of the connections are getting stalled now on:

69415	root	10.64.32.13	tendril	Connect	1084	updating	delete from global_status where server_id = @server_id and variable_name not like '%.%'	0.000
69435	root	10.64.32.13	tendril	Connect	1084	updating	delete from global_status where server_id = @server_id and variable_name not like '%.%'	0.000

I have finally truncated also global_status as its data isn't really super used and it gets repopulated by the cronjobs and by the events - the table was around 10GB:
An example of its data:

mysql:root@localhost [tendril]> select * from global_status limit 10;
+-----------+------------------------+--------------------+
| server_id | variable_name          | variable_value     |
+-----------+------------------------+--------------------+
|      1331 | s1.connect_retry       | 60                 |
|      1331 | s1.exec_master_log_pos | 321566436          |
|      1331 | s1.last_errno          | 0                  |
|      1331 | s1.last_error          |                    |
|      1331 | s1.last_io_errno       | 0                  |
|      1331 | s1.last_io_error       |                    |
|      1331 | s1.last_sql_errno      | 0                  |
|      1331 | s1.last_sql_error      |                    |
|      1331 | s1.master_host         | db1124.eqiad.wmnet |
|      1331 | s1.master_log_file     | db1124-bin.002603  |
+-----------+------------------------+--------------------+
10 rows in set (0.02 sec)

Once it was done, I have enabled the event_scheduler again and the table is being repopulated.
After a big spike in connections and CPU, looks like things are getting more stable - tendril is still slow but looking better:

root@db1115:/srv/sqldata/tendril# w
 08:20:30 up 5 days,  3:25,  3 users,  load average: 116.14, 104.02, 135.74

And it is again almost unresponsive

Mentioned in SAL (#wikimedia-operations) [2020-05-10T08:50:50Z] <marostegui> Restart mysql on db1115 to change buffer pool size from 20GB to 40GB T252324 (

I have given double its buffer pool size: from 20 to 40GB to innodb and from 30GB to 40GB to tokudb.

At this point I think we've either hit some sort of limits on concurrency (we have 2273 events enabled) or there's some underlying HW issue that is making the host perform slower than usual.
Random connections get stuck all the time, on different tables (even small) ones, and the rest just pile up:

| 46025 | root            | 10.64.32.13         | tendril            | Connect |   62 | updating                                           | delete from master_status where server_id = @server_id
-rw-rw---- 1 mysql mysql  40M May 10 09:05 master_status.ibd
root@db1115:/srv/sqldata/tendril# mysql tendril -e "select count(*) from master_status"
+----------+
| count(*) |
+----------+
|     2104 |
+----------+

The server hits max CPU usage all the time.
What I don't see yet is what happened yesterday when the CPU just sky rocketed all of a sudden and never recovered:

Captura de pantalla 2020-05-10 a las 9.13.28.png (512×1 px, 125 KB)

There are many of these entries:

May  9 19:25:39 db1115 smartd[807]: Device: /dev/sda [SAT], SMART Prefailure Attribute: 1 Raw_Read_Error_Rate changed from 100 to 77
May  9 19:25:39 db1115 smartd[807]: Device: /dev/sda [SAT], SMART Usage Attribute: 195 Hardware_ECC_Recovered changed from 100 to 1
May  9 19:25:39 db1115 smartd[807]: Device: /dev/sdb [SAT], SMART Prefailure Attribute: 1 Raw_Read_Error_Rate changed from 75 to 79
May  9 19:25:39 db1115 smartd[807]: Device: /dev/sdb [SAT], SMART Usage Attribute: 190 Airflow_Temperature_Cel changed from 65 to 64
May  9 19:25:39 db1115 smartd[807]: Device: /dev/sdb [SAT], SMART Usage Attribute: 194 Temperature_Celsius changed from 35 to 36
May  9 19:55:39 db1115 smartd[807]: Device: /dev/sda [SAT], SMART Prefailure Attribute: 1 Raw_Read_Error_Rate changed from 77 to 79
May  9 19:55:40 db1115 smartd[807]: Device: /dev/sdb [SAT], SMART Prefailure Attribute: 1 Raw_Read_Error_Rate changed from 79 to 81
May  9 19:55:40 db1115 smartd[807]: Device: /dev/sdb [SAT], SMART Usage Attribute: 190 Airflow_Temperature_Cel changed from 64 to 65
May  9 19:55:40 db1115 smartd[807]: Device: /dev/sdb [SAT], SMART Usage Attribute: 194 Temperature_Celsius changed from 36 to 35
May  9 20:25:39 db1115 smartd[807]: Device: /dev/sda [SAT], SMART Prefailure Attribute: 1 Raw_Read_Error_Rate changed from 79 to 81
May  9 20:25:39 db1115 smartd[807]: Device: /dev/sdb [SAT], SMART Prefailure Attribute: 1 Raw_Read_Error_Rate changed from 81 to 82
May  9 20:55:39 db1115 smartd[807]: Device: /dev/sda [SAT], SMART Prefailure Attribute: 1 Raw_Read_Error_Rate changed from 81 to 82
May  9 20:55:39 db1115 smartd[807]: Device: /dev/sdb [SAT], SMART Prefailure Attribute: 1 Raw_Read_Error_Rate changed from 82 to 83
May  9 20:55:39 db1115 smartd[807]: Device: /dev/sdb [SAT], SMART Usage Attribute: 190 Airflow_Temperature_Cel changed from 65 to 64
May  9 20:55:39 db1115 smartd[807]: Device: /dev/sdb [SAT], SMART Usage Attribute: 194 Temperature_Celsius changed from 35 to 36
May  9 21:25:39 db1115 smartd[807]: Device: /dev/sda [SAT], SMART Prefailure Attribute: 1 Raw_Read_Error_Rate changed from 82 to 83
May  9 21:25:40 db1115 smartd[807]: Device: /dev/sdb [SAT], SMART Usage Attribute: 190 Airflow_Temperature_Cel changed from 64 to 65
May  9 21:25:40 db1115 smartd[807]: Device: /dev/sdb [SAT], SMART Usage Attribute: 194 Temperature_Celsius changed from 36 to 35
May  9 21:25:40 db1115 smartd[807]: Device: /dev/sdb [SAT], SMART Usage Attribute: 195 Hardware_ECC_Recovered changed from 29 to 28
May  9 21:55:39 db1115 smartd[807]: Device: /dev/sda [SAT], SMART Prefailure Attribute: 1 Raw_Read_Error_Rate changed from 83 to 84
May  9 21:55:39 db1115 smartd[807]: Device: /dev/sdb [SAT], SMART Prefailure Attribute: 1 Raw_Read_Error_Rate changed from 83 to 71
May  9 21:55:39 db1115 smartd[807]: Device: /dev/sdb [SAT], SMART Usage Attribute: 195 Hardware_ECC_Recovered changed from 28 to 30
May  9 22:25:39 db1115 smartd[807]: Device: /dev/sda [SAT], SMART Prefailure Attribute: 1 Raw_Read_Error_Rate changed from 84 to 75
May  9 22:25:40 db1115 smartd[807]: Device: /dev/sdb [SAT], SMART Prefailure Attribute: 1 Raw_Read_Error_Rate changed from 71 to 77
May  9 22:55:39 db1115 smartd[807]: Device: /dev/sda [SAT], SMART Prefailure Attribute: 1 Raw_Read_Error_Rate changed from 75 to 78
May  9 22:55:39 db1115 smartd[807]: Device: /dev/sdb [SAT], SMART Prefailure Attribute: 1 Raw_Read_Error_Rate changed from 77 to 79
May  9 22:55:39 db1115 smartd[807]: Device: /dev/sdb [SAT], SMART Usage Attribute: 195 Hardware_ECC_Recovered changed from 30 to 29
May  9 23:25:39 db1115 smartd[807]: Device: /dev/sda [SAT], SMART Prefailure Attribute: 1 Raw_Read_Error_Rate changed from 78 to 80
May  9 23:25:39 db1115 smartd[807]: Device: /dev/sdb [SAT], SMART Prefailure Attribute: 1 Raw_Read_Error_Rate changed from 79 to 81
May  9 23:25:39 db1115 smartd[807]: Device: /dev/sdb [SAT], SMART Usage Attribute: 190 Airflow_Temperature_Cel changed from 65 to 64
May  9 23:25:39 db1115 smartd[807]: Device: /dev/sdb [SAT], SMART Usage Attribute: 194 Temperature_Celsius changed from 35 to 36
 May  9 23:55:39 db1115 smartd[807]: Device: /dev/sda [SAT], SMART Prefailure Attribute: 1 Raw_Read_Error_Rate changed from 80 to 81
May  9 23:55:40 db1115 smartd[807]: Device: /dev/sdb [SAT], SMART Prefailure Attribute: 1 Raw_Read_Error_Rate changed from 81 to 82

I don't think that's a big deal, but just posting it for posterity.

Mentioned in SAL (#wikimedia-operations) [2020-05-10T09:25:52Z] <marostegui> Stop MySQL and restart db1115 - T252324

Mentioned in SAL (#wikimedia-operations) [2020-05-10T09:56:27Z] <marostegui> Change scaling_governor from powersave to performance on db1115 - T252324

The CPU's were running powersave as scaling_governor I have changed them to performance. I don't expect miracles, but...

The problem is still that not very big transactions take lots to finish and everything piles up:

| 49066 | root            | 10.64.32.13         | tendril            | Connect |  166 | updating                                           | delete from slave_status where server_id = @server_id

Fully rebooted the host, and started it with the event_scheduler disabled.
I went to tendril's web and caught this query:

select  `server_id`, `variable_value` from tendril.global_variables  where `variable_name` = 'version' and `server_id` in (1281,1283,1282,1693,1677,1313,1308,1312,1305,1306,1310,1318,1314,1303,1316,1307,1455,1456,1311,1304,1317,1315,1700,1675,1701,1684,1679,1413,1422,1680,1681,1427,1426,1366,1408,1423,1648,1649,1682,1683,1370,1708,1707,1373,1657,1399,1409,1410,1676,1434,1448,1449,1699,1440,1650,1651,1478,1486,1480,1481,1553,1463,1513,1461,1453,1468,1487,1488,1489,1490,1491,1492,1493,1494,1618,1610,1623,1611,1612,1616,1628,1629,1617,1627,1622,1694,1614,1569,1570,1334,1342,1345,1344,1506,1352,1358,1713,1714,1715,1716,1374,1375,1381,1379,1378,1686,1685,1687,1688,1394,1425,1710,1395,1389,1390,1400,1397,1438,1392,1391,1505,1696,1501,1502,1503,1504,1497,1498,1499,1500,1528,1559,1558,1560,1563,1561,1562,1567,1565,1564,1705,1595,1596,1597,1598,1599,1600,1692,1602,1603,1645,1605,1690,1695,1607,1608,1620,1609,1621,1691,1640,1630,1706,1632,1633,1636,1631,1634,1637,1638,1652,1654,1655,1656,1549,1542,1543,1546,1547,1545,1551,1552,1550,1554,1227,1229,1230,1228,1233,1232,1231,1235,1234,1669,1670,1672,1671,1712,1674,1276,1277,1278,1270,1273,1271,1274,1272,1275,1660,1662,1663,1664,1665,1711,1331,1332,1702,1557,1541,1698,1537,1535,1531,1697,1534,1532);
..
226 rows in set (1 min 6.87 sec)

mysql:root@localhost [tendril]> select count(*) from global_variables;
+----------+
| count(*) |
+----------+
|   137687 |
+----------+
1 row in set (0.59 sec)

mysql:root@localhost [tendril]> explain select  `server_id`, `variable_value` from tendril.global_variables  where `variable_name` = 'version' and `server_id` in (1281,1283,1282,1693,1677,1313,1308,1312,1305,1306,1310,1318,1314,1303,1316,1307,1455,1456,1311,1304,1317,1315,1700,1675,1701,1684,1679,1413,1422,1680,1681,1427,1426,1366,1408,1423,1648,1649,1682,1683,1370,1708,1707,1373,1657,1399,1409,1410,1676,1434,1448,1449,1699,1440,1650,1651,1478,1486,1480,1481,1553,1463,1513,1461,1453,1468,1487,1488,1489,1490,1491,1492,1493,1494,1618,1610,1623,1611,1612,1616,1628,1629,1617,1627,1622,1694,1614,1569,1570,1334,1342,1345,1344,1506,1352,1358,1713,1714,1715,1716,1374,1375,1381,1379,1378,1686,1685,1687,1688,1394,1425,1710,1395,1389,1390,1400,1397,1438,1392,1391,1505,1696,1501,1502,1503,1504,1497,1498,1499,1500,1528,1559,1558,1560,1563,1561,1562,1567,1565,1564,1705,1595,1596,1597,1598,1599,1600,1692,1602,1603,1645,1605,1690,1695,1607,1608,1620,1609,1621,1691,1640,1630,1706,1632,1633,1636,1631,1634,1637,1638,1652,1654,1655,1656,1549,1542,1543,1546,1547,1545,1551,1552,1550,1554,1227,1229,1230,1228,1233,1232,1231,1235,1234,1669,1670,1672,1671,1712,1674,1276,1277,1278,1270,1273,1271,1274,1272,1275,1660,1662,1663,1664,1665,1711,1331,1332,1702,1557,1541,1698,1537,1535,1531,1697,1534,1532);
+------+-------------+------------------+-------+---------------+------+---------+------+------+------------------------------------+
| id   | select_type | table            | type  | possible_keys | key  | key_len | ref  | rows | Extra                              |
+------+-------------+------------------+-------+---------------+------+---------+------+------+------------------------------------+
|    1 | SIMPLE      | global_variables | range | i1            | i1   | 4       | NULL |    1 | Using index condition; Using where |
+------+-------------+------------------+-------+---------------+------+---------+------+------+------------------------------------+
1 row in set (0.01 sec)

mysql:root@localhost [tendril]> FLUSH STATUS; pager cat > /dev/null; select  `server_id`, `variable_value` from tendril.global_variables  where `variable_name` = 'version' and `server_id` in (1281,1283,1282,1693,1677,1313,1308,1312,1305,1306,1310,1318,1314,1303,1316,1307,1455,1456,1311,1304,1317,1315,1700,1675,1701,1684,1679,1413,1422,1680,1681,1427,1426,1366,1408,1423,1648,1649,1682,1683,1370,1708,1707,1373,1657,1399,1409,1410,1676,1434,1448,1449,1699,1440,1650,1651,1478,1486,1480,1481,1553,1463,1513,1461,1453,1468,1487,1488,1489,1490,1491,1492,1493,1494,1618,1610,1623,1611,1612,1616,1628,1629,1617,1627,1622,1694,1614,1569,1570,1334,1342,1345,1344,1506,1352,1358,1713,1714,1715,1716,1374,1375,1381,1379,1378,1686,1685,1687,1688,1394,1425,1710,1395,1389,1390,1400,1397,1438,1392,1391,1505,1696,1501,1502,1503,1504,1497,1498,1499,1500,1528,1559,1558,1560,1563,1561,1562,1567,1565,1564,1705,1595,1596,1597,1598,1599,1600,1692,1602,1603,1645,1605,1690,1695,1607,1608,1620,1609,1621,1691,1640,1630,1706,1632,1633,1636,1631,1634,1637,1638,1652,1654,1655,1656,1549,1542,1543,1546,1547,1545,1551,1552,1550,1554,1227,1229,1230,1228,1233,1232,1231,1235,1234,1669,1670,1672,1671,1712,1674,1276,1277,1278,1270,1273,1271,1274,1272,1275,1660,1662,1663,1664,1665,1711,1331,1332,1702,1557,1541,1698,1537,1535,1531,1697,1534,1532); ; nopager; SHOW STATUS like 'Hand%';
Query OK, 0 rows affected (0.00 sec)

PAGER set to 'cat > /dev/null'
226 rows in set (0.96 sec)

ERROR: No query specified

PAGER set to stdout
+----------------------------+--------+
| Variable_name              | Value  |
+----------------------------+--------+
| Handler_commit             | 1      |
| Handler_delete             | 0      |
| Handler_discover           | 0      |
| Handler_external_lock      | 0      |
| Handler_icp_attempts       | 137687 |
| Handler_icp_match          | 137687 |
| Handler_mrr_init           | 0      |
| Handler_mrr_key_refills    | 0      |
| Handler_mrr_rowid_refills  | 0      |
| Handler_prepare            | 0      |
| Handler_read_first         | 0      |
| Handler_read_key           | 226    |
| Handler_read_last          | 0      |
| Handler_read_next          | 137687 |
| Handler_read_prev          | 0      |
| Handler_read_retry         | 0      |
| Handler_read_rnd           | 0      |
| Handler_read_rnd_deleted   | 0      |
| Handler_read_rnd_next      | 0      |
| Handler_rollback           | 0      |
| Handler_savepoint          | 0      |
| Handler_savepoint_rollback | 0      |
| Handler_tmp_update         | 0      |
| Handler_tmp_write          | 0      |
| Handler_update             | 0      |
| Handler_write              | 0      |
+----------------------------+--------+
26 rows in set (0.01 sec)

I would expect that query to fly, not to take more than 1 minute to complete when the system is doing nothing.

And as soon as the event_scheduler is started the host hits CPU limits again.

This is quite insane - how can we have that crazy amount of rows for just one month of data:

mysql:root@localhost [tendril]> show explain for 283543;
+------+-------------+-------------------+-------+---------------+---------+---------+------+-------------+-------------+
| id   | select_type | table             | type  | possible_keys | key     | key_len | ref  | rows        | Extra       |
+------+-------------+-------------------+-------+---------------+---------+---------+------+-------------+-------------+
|    1 | SIMPLE      | global_status_log | index | NULL          | PRIMARY | 24      | NULL | 10164518550 | Using index |
+------+-------------+-------------------+-------+---------------+---------+---------+------+-------------+-------------+
1 row in set, 1 warning (0.00 sec)

mysql:root@localhost [tendril]> select min(stamp),max(stamp) from global_status_log;
+---------------------+---------------------+
| min(stamp)          | max(stamp)          |
+---------------------+---------------------+
| 2020-04-11 00:00:00 | 2020-05-10 10:44:52 |
+---------------------+---------------------+
1 row in set (0.01 sec)

And not that the data is very useful anyways:

mysql:root@localhost [tendril]> select * from global_status_log limit 15;
+-----------+---------------------+---------+-------+
| server_id | stamp               | name_id | value |
+-----------+---------------------+---------+-------+
|      1227 | 2020-04-11 00:00:05 |       1 | 68849 |
|      1227 | 2020-04-11 00:00:35 |       1 | 68849 |
|      1227 | 2020-04-11 00:01:05 |       1 | 68849 |
|      1227 | 2020-04-11 00:01:35 |       1 | 68849 |
|      1227 | 2020-04-11 00:02:05 |       1 | 68849 |
|      1227 | 2020-04-11 00:02:35 |       1 | 68849 |
|      1227 | 2020-04-11 00:03:05 |       1 | 68849 |
|      1227 | 2020-04-11 00:03:35 |       1 | 68849 |
|      1227 | 2020-04-11 00:04:05 |       1 | 68851 |
|      1227 | 2020-04-11 00:04:35 |       1 | 68851 |
|      1227 | 2020-04-11 00:05:05 |       1 | 68851 |
|      1227 | 2020-04-11 00:05:35 |       1 | 68851 |
|      1227 | 2020-04-11 00:06:05 |       1 | 68854 |
|      1227 | 2020-04-11 00:06:35 |       1 | 68857 |
|      1227 | 2020-04-11 00:07:05 |       1 | 68857 |
+-----------+---------------------+---------+-------+
15 rows in set (0.00 sec)
mysql:root@localhost [(none)]> show explain for 291612;
+------+-------------+----------------------+-------+---------------+------+---------+------+-------------+-------------+
| id   | select_type | table                | type  | possible_keys | key  | key_len | ref  | rows        | Extra       |
+------+-------------+----------------------+-------+---------------+------+---------+------+-------------+-------------+
|    1 | SIMPLE      | global_status_log_5m | index | NULL          | i2   | 8       | NULL | 87877089565 | Using index |
+------+-------------+----------------------+-------+---------------+------+---------+------+-------------+-------------+
1 row in set, 1 warning (0.00 sec)

So looks like we have an event to purge that table but doesn't seem to be working at all based on the dates below:

mysql:root@localhost [tendril]> show create event tendril_purge_global_status_log_5m;
+------------------------------------+----------+-----------+--------------------------------------------------------------------------------------------------------------------------------------------------------------------------------+
| Event                              | sql_mode | time_zone | Create Event                                                                                                                                                                   |
+------------------------------------+----------+-----------+--------------------------------------------------------------------------------------------------------------------------------------------------------------------------------+
| tendril_purge_global_status_log_5m |          | SYSTEM    | CREATE DEFINER=`root`@`208.80.154.151` EVENT `tendril_purge_global_status_log_5m` ON SCHEDULE EVERY 5 MINUTE STARTS '2014-05-23 00:00:00' ON COMPLETION NOT PRESERVE ENABLE DO n

    if (get_lock('tendril_purge_global_status_log_5m', 1) = 0) then
      signal sqlstate value '45000' set message_text = 'get_lock';
    end if;

    select @stamp := now() - interval 7 day;
    delete from global_status_log_5m where stamp < @stamp limit 10000;

    do release_lock('tendril_purge_global_status_log_5m');
  end | utf8                 | utf8_general_ci      | latin1_swedish_ci  |
+------------------------------------+----------+-----------+--------------------------------------------------------------------------------------------------------------------------------------------------------------------------------+
1 row in set (0.00 sec)

mysql:root@localhost [tendril]> select min(stamp),max(stamp) from global_status_log_5m;
+---------------------+---------------------+
| min(stamp)          | max(stamp)          |
+---------------------+---------------------+
| 2015-06-19 11:40:00 | 2020-05-10 10:40:00 |
+---------------------+---------------------+
1 row in set (0.11 sec)

mysql:root@localhost [tendril]> select @stamp := now() - interval 7 day;
+----------------------------------+
| @stamp := now() - interval 7 day |
+----------------------------------+
| 2020-05-03 11:00:35              |
+----------------------------------+
1 row in set (0.00 sec)

mysql:root@localhost [tendril]> select * from global_status_log_5m where stamp < @stamp limit 2;
+-----------+---------------------+---------+-------------+
| server_id | stamp               | name_id | value       |
+-----------+---------------------+---------+-------------+
|      1082 | 2015-06-19 11:40:00 |     352 | 13561583583 |
|      1209 | 2015-06-19 11:40:00 |     348 |           0 |
+-----------+---------------------+---------+-------------+
2 rows in set (0.10 sec)

I am going to manually execute what that delete (without the LIMIT) does to get that data purged. The table is almost 1TB in size.

mysql:root@localhost [tendril]> set session sql_log_bin=0;
Query OK, 0 rows affected (0.00 sec)

mysql:root@localhost [tendril]> select @stamp := now() - interval 7 day;
+----------------------------------+
| @stamp := now() - interval 7 day |
+----------------------------------+
| 2020-05-03 11:03:15              |
+----------------------------------+
1 row in set (0.00 sec)

mysql:root@localhost [tendril]> delete from global_status_log_5m where stamp < @stamp;

Mentioned in SAL (#wikimedia-operations) [2020-05-10T11:05:38Z] <marostegui> Stop event scheduler on db1115 to perform a massive delete - T252324

So looks like the above event was never able to execute when the scheduler is enable due to, basically, locking issues due to all the concurrency:

daemon.log:May 10 07:35:01 db1115 mysqld[9874]: 2020-05-10  7:35:01 140524036028160 [ERROR] Event Scheduler: [root@208.80.154.151][tendril.tendril_purge_global_status_log_5m] get_lock
daemon.log:May 10 07:35:01 db1115 mysqld[9874]: 2020-05-10  7:35:01 140524036028160 [Note] Event Scheduler: [root@208.80.154.151].[tendril.tendril_purge_global_status_log_5m] event execution failed.

Mentioned in SAL (#wikimedia-operations) [2020-05-10T12:18:49Z] <marostegui> Start event scheduler on db1115 after a massive delete - T252324

Marostegui claimed this task.

I decided to finally fully truncate global_status_log_5m as we don't really use those values anyways.
truncate + optimize fixed the thing.
Tendril is now back at its normal speed and there are no pile ups happening. Processlist shows around 40-60 connections and they are all going quite fast.
Looks like we do need to make sure the above event works, so maybe it is easier just to set a cronjob that:

  • Stops the event scheduler
  • Waits for the output to be clean
  • Perform the delete + optimize
  • Starts the event scheduler

If we don't stop the event_scheduler, with the amount of concurrency it will probably keep failing anyways.
Going to consider this fixed and will create an specific task for the cronjob discussion above.

Btw, the effect of truncating those tables on the used disk space:

Captura de pantalla 2020-05-10 a las 14.33.50.png (1×3 px, 229 KB)

I would suggest to move zarcillo database away- it is very annoying to have the db down for an unrelated (to backups) reason, which will result in backup alerting on Monday.

Unless you give me a good reason not to, I will move the db to the tendril db host on codfw on Monday, after the Sunday backups finish.