In order to prioritize items in the app navigation (T253238), we would like to know which items are used a lot (e.g. in percentage within a session)
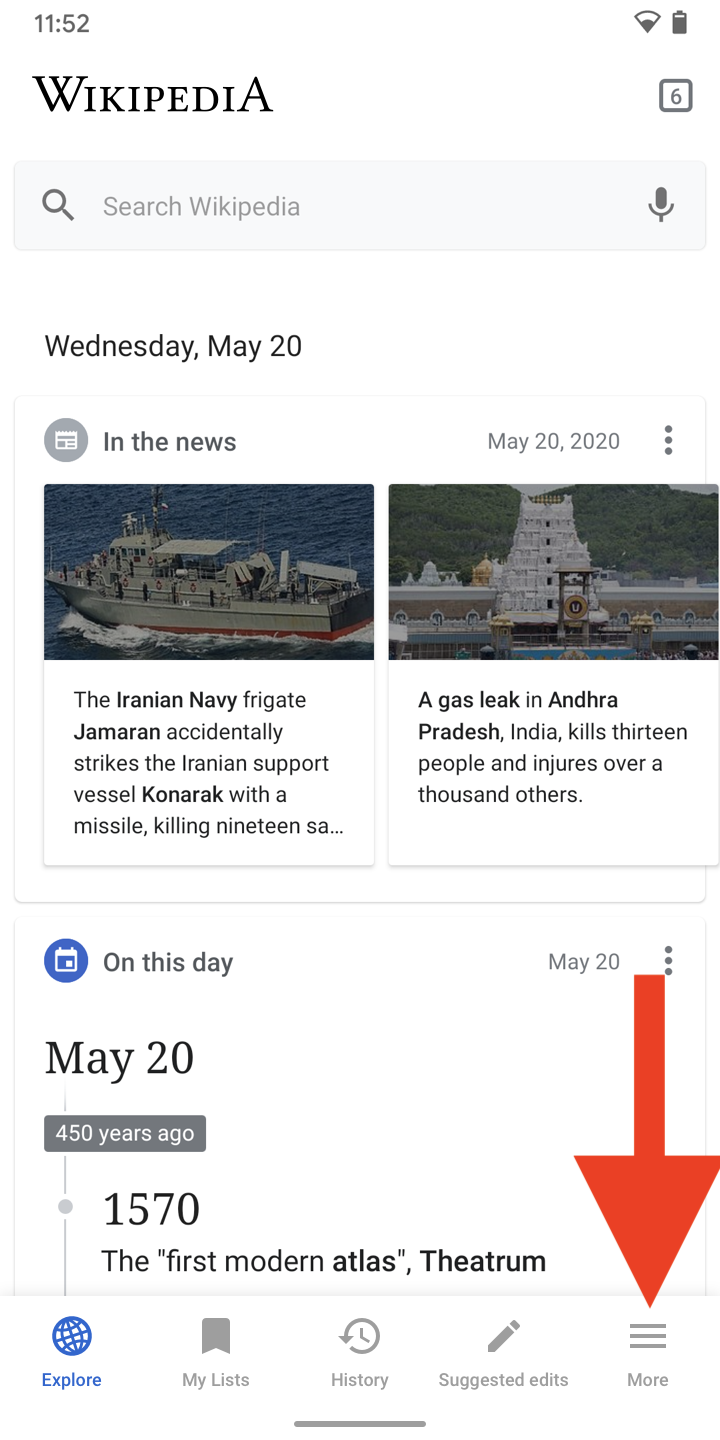
Main tab navigation
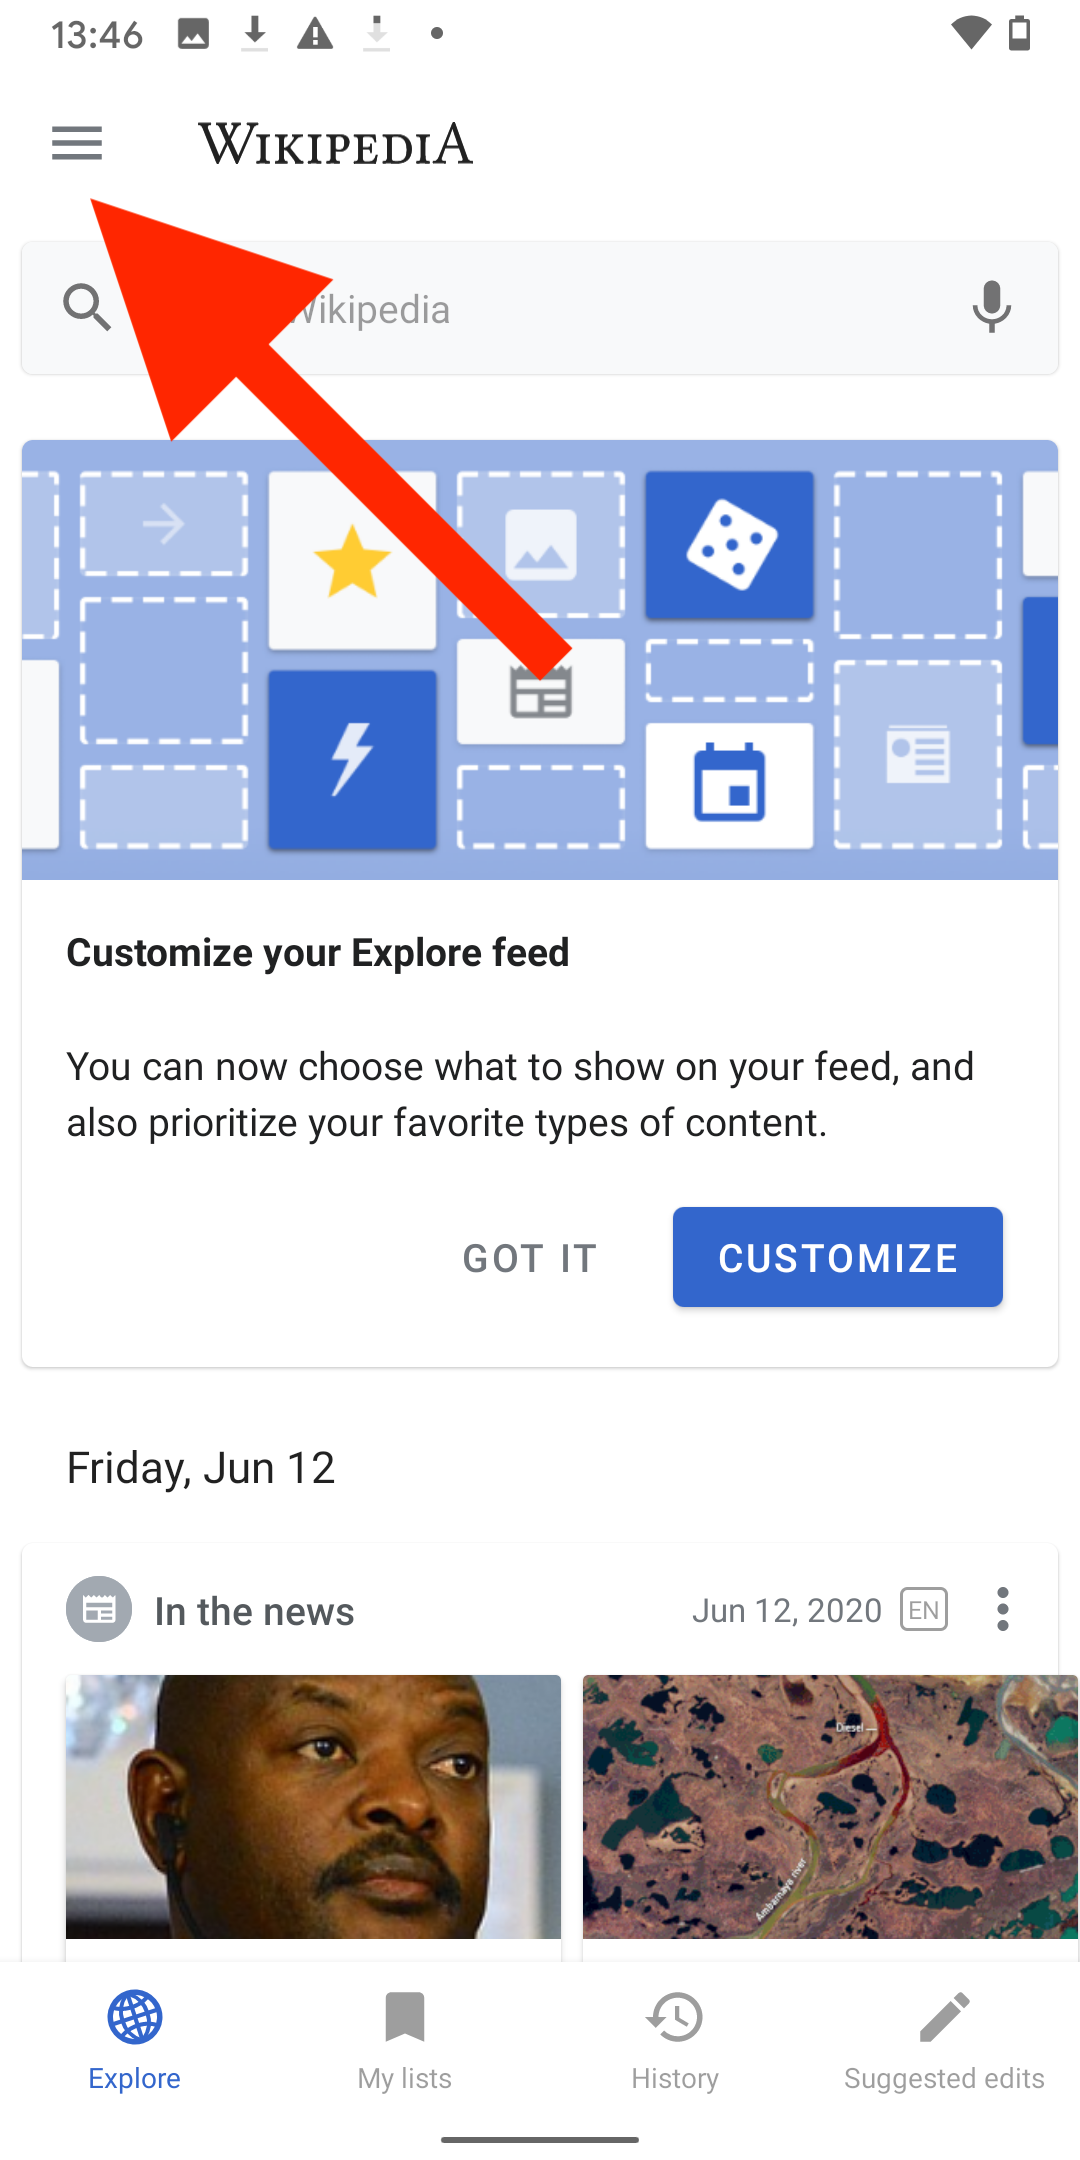
- Explore
- My lists
- History
- Suggested edits (as % of logged-in users only since this is only visible to them)
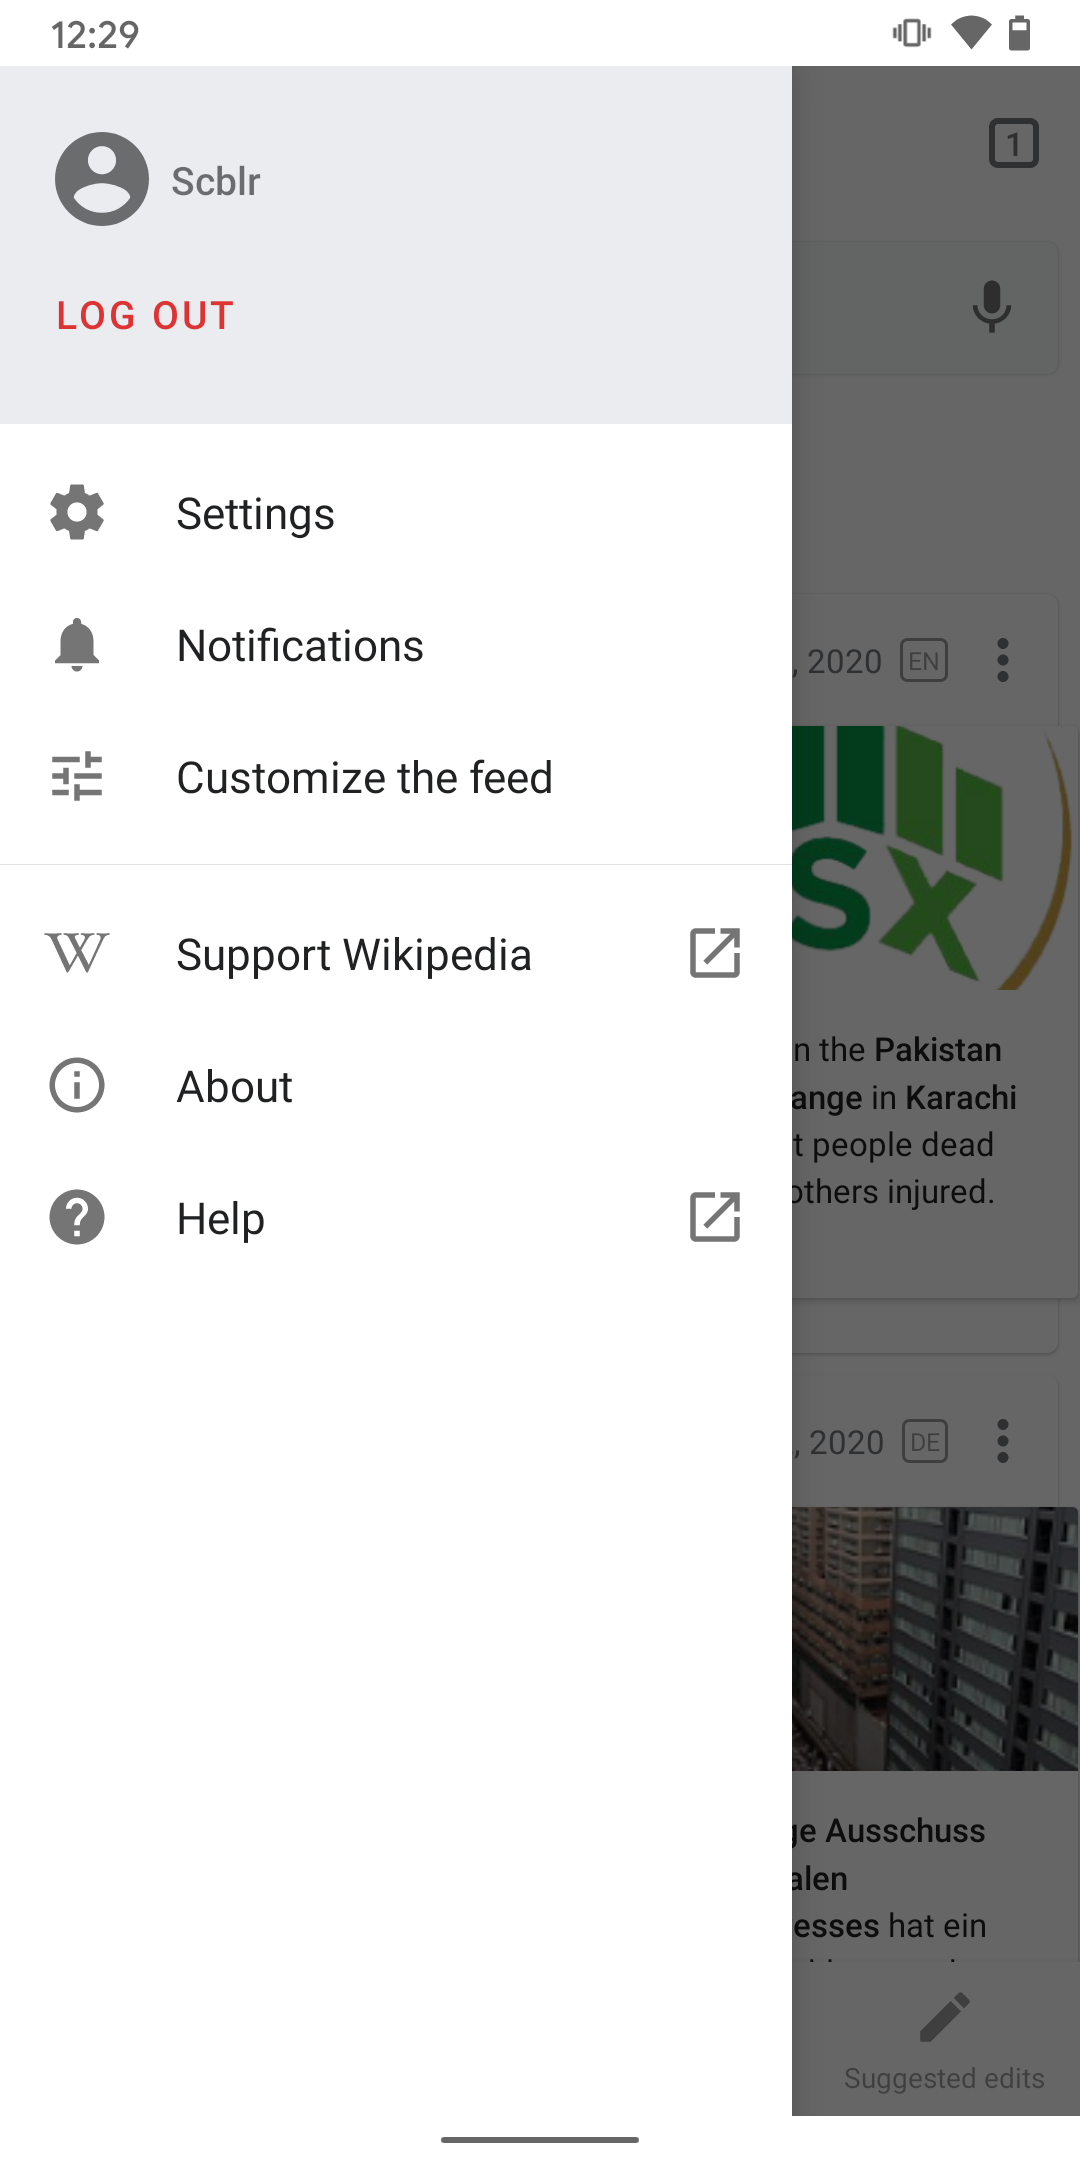
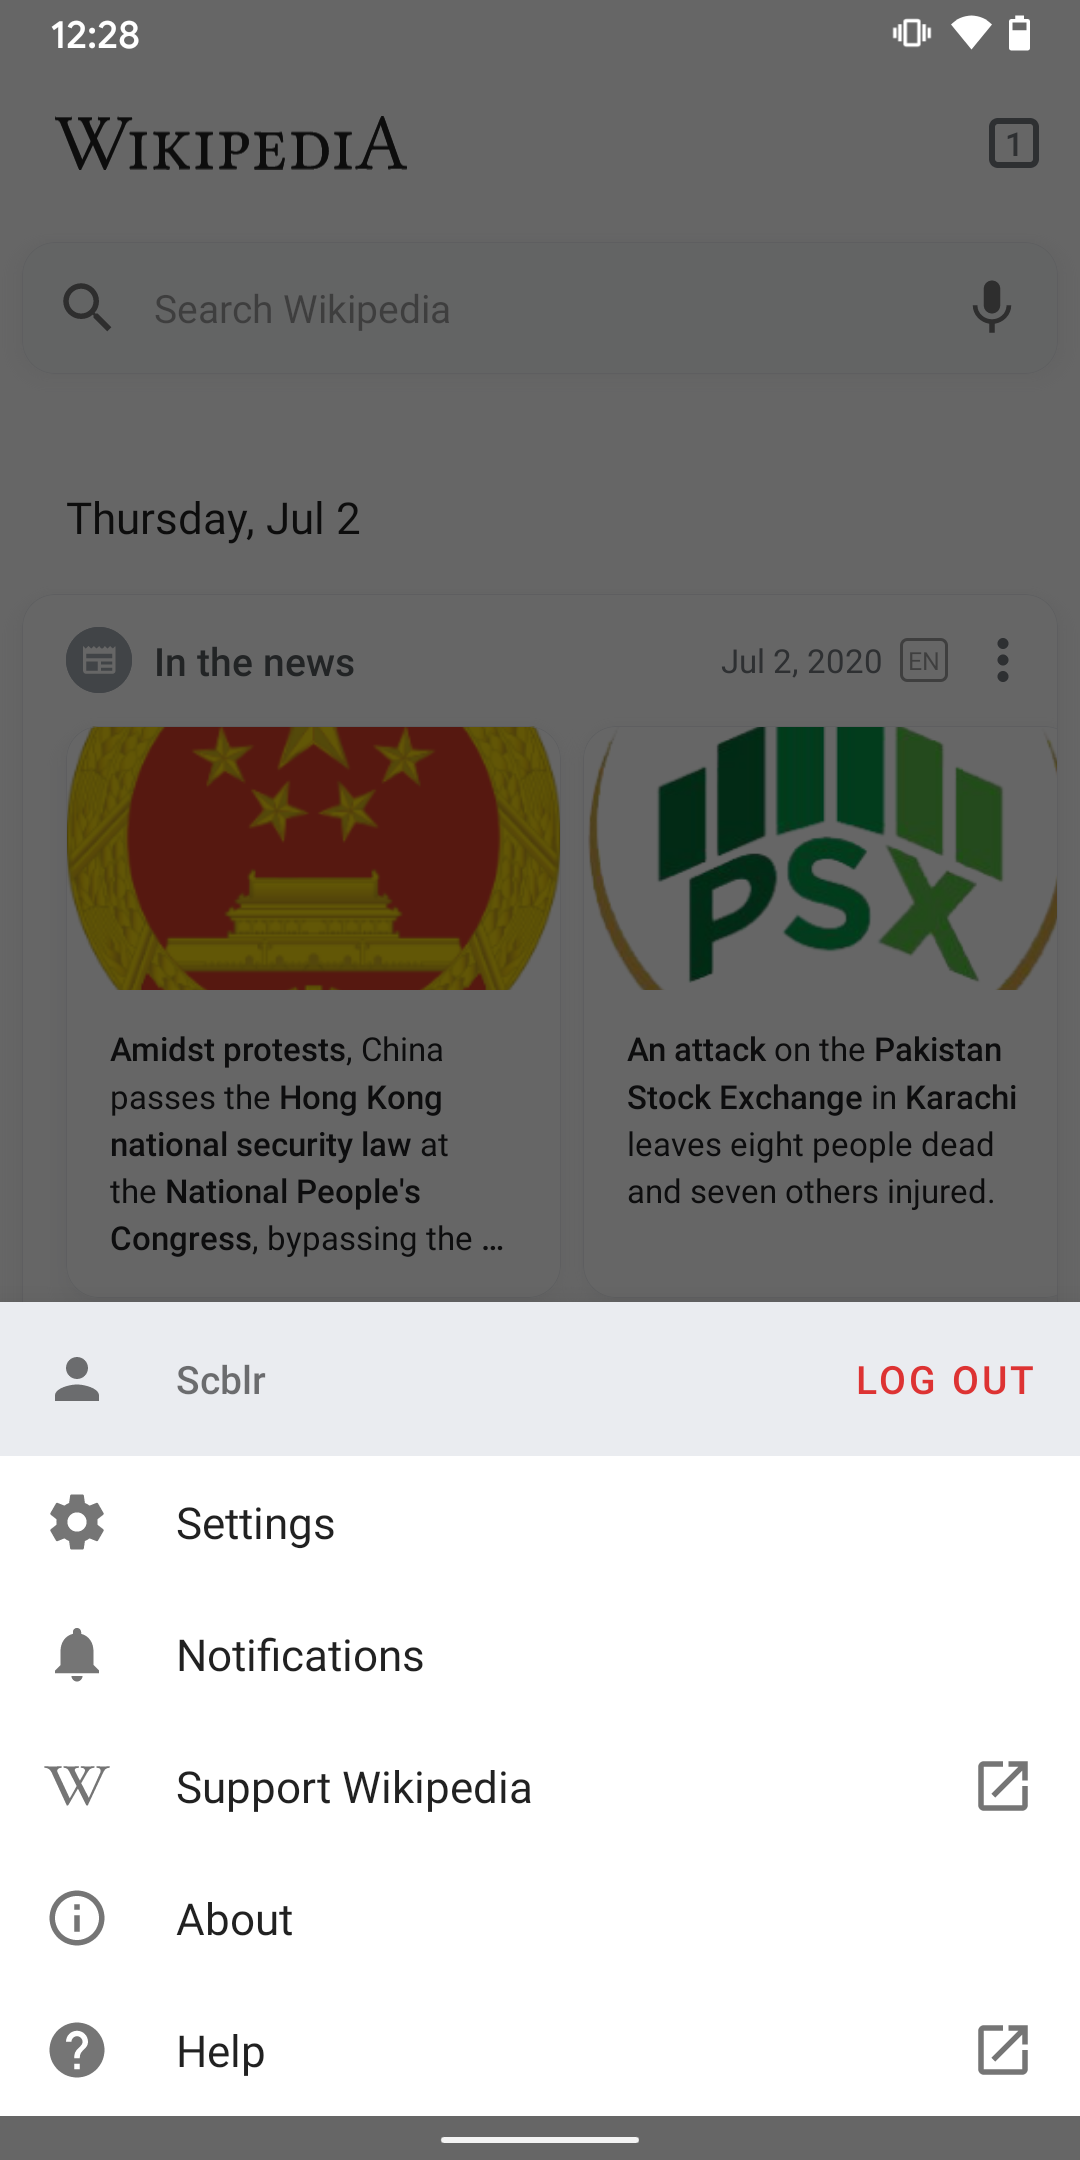
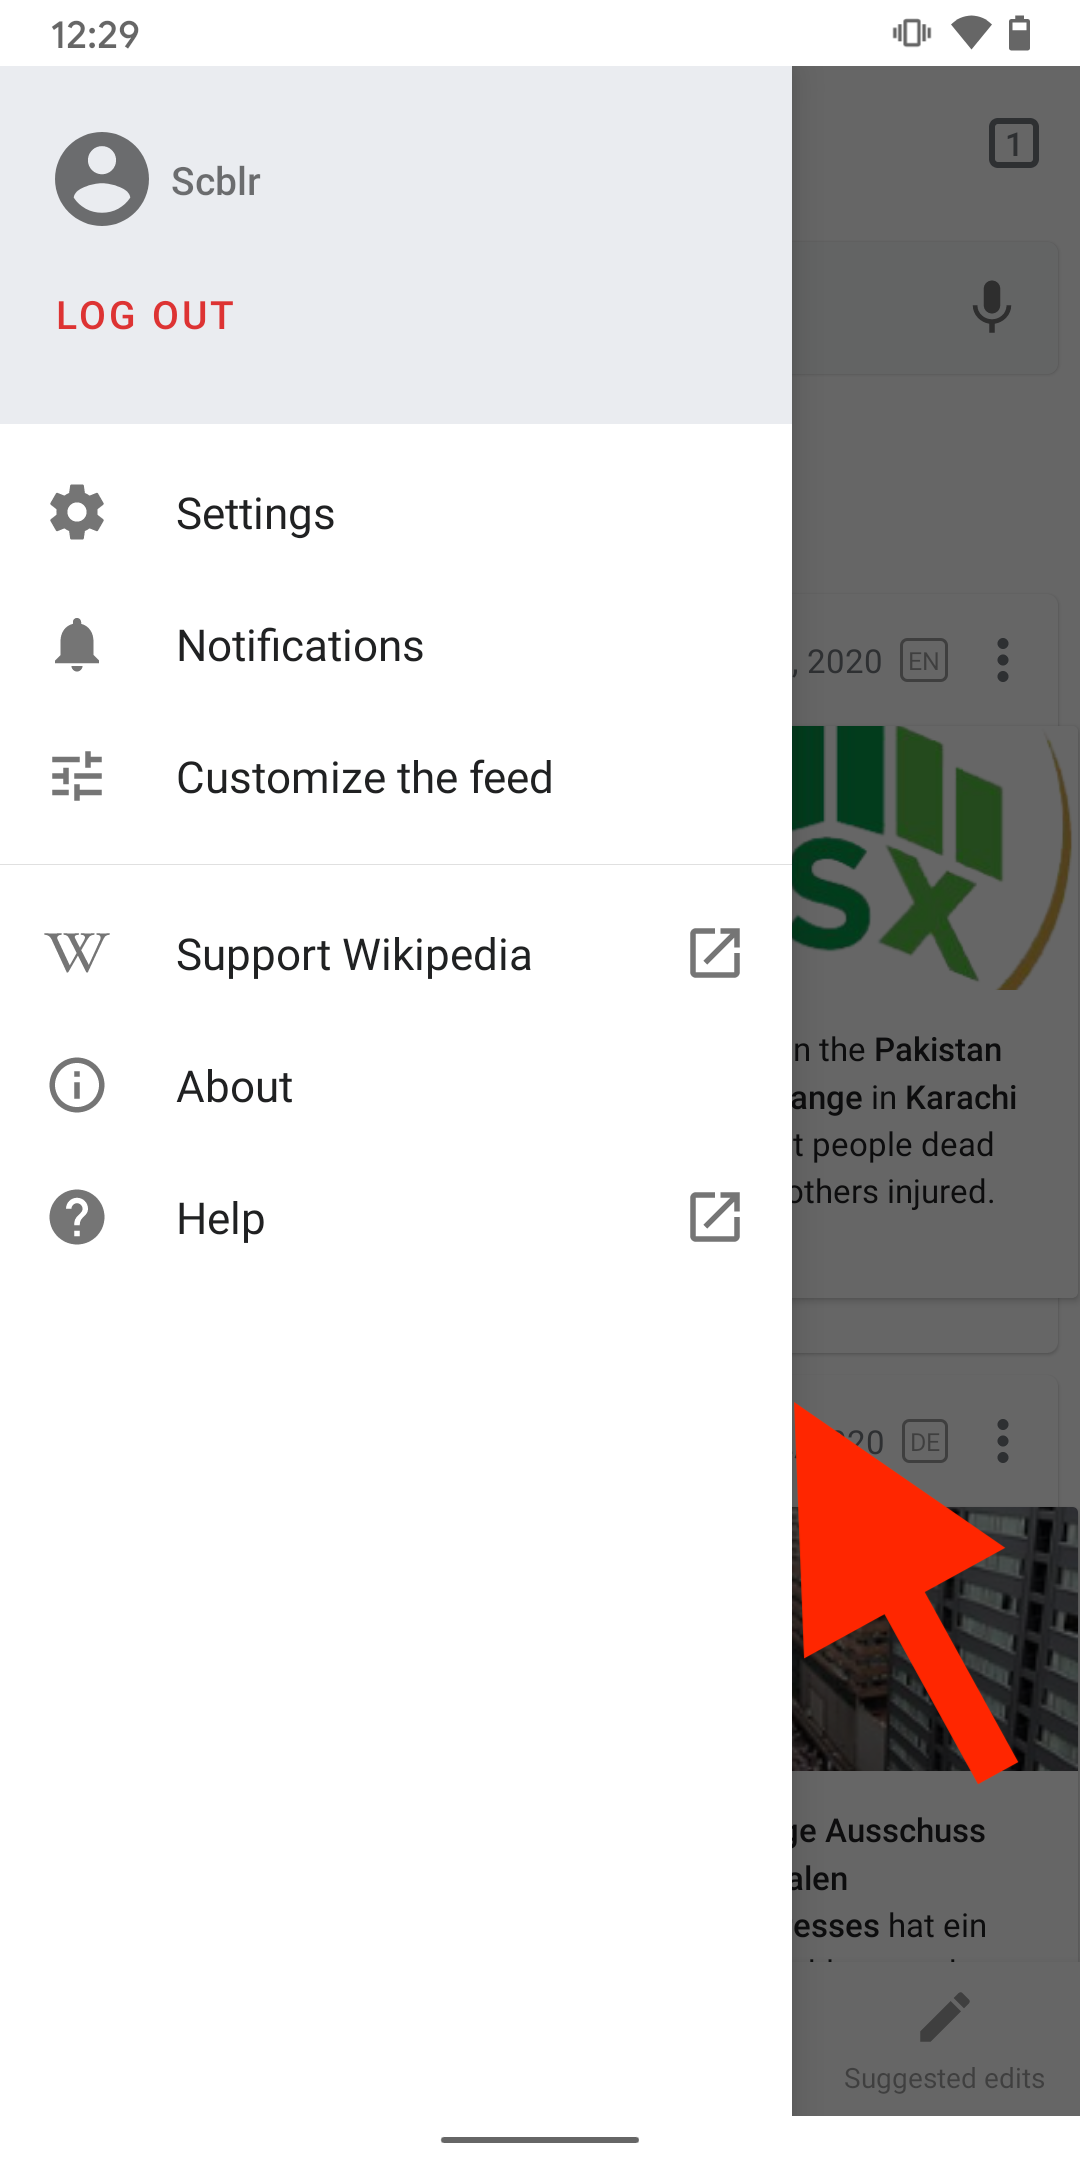
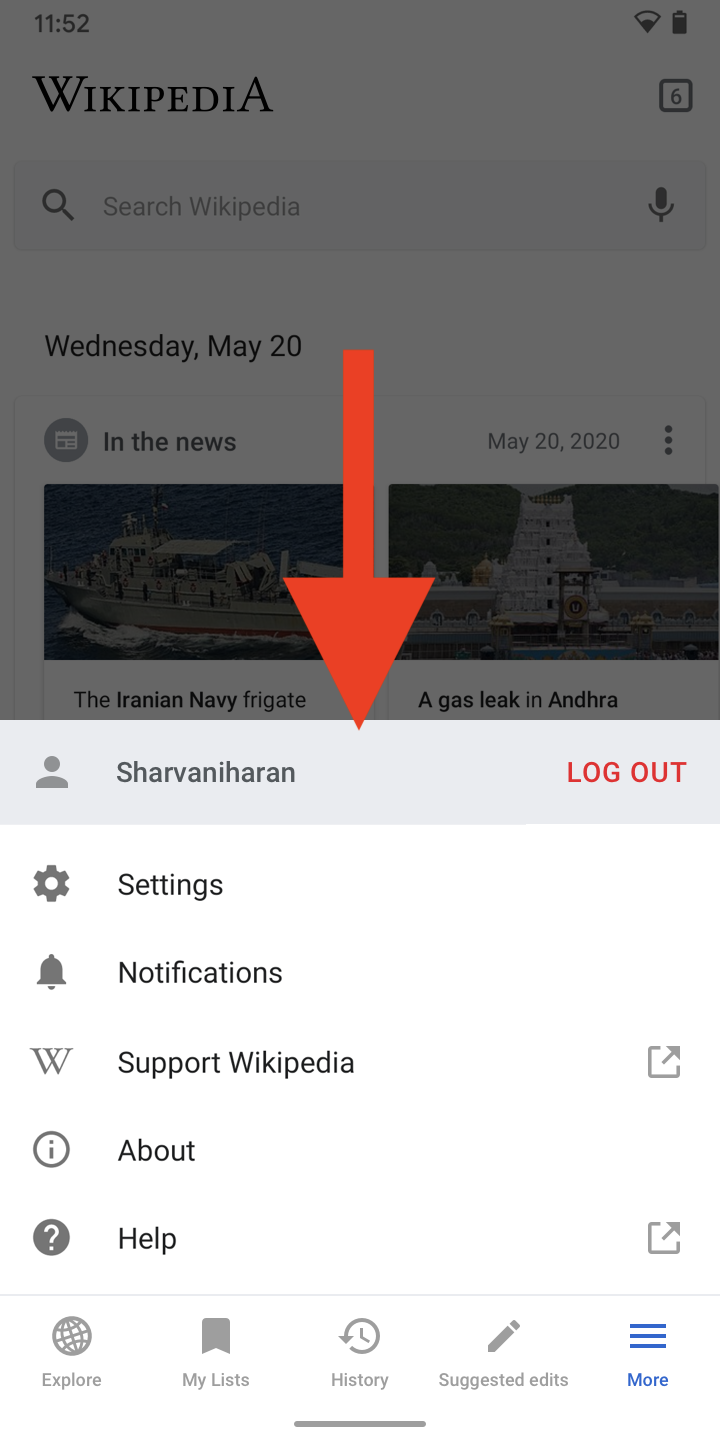
Menu on ”Explore” (top left)
- Log in / Join Wikipedia
- Settings
- Customize the feed
- Support Wikipedia
- About
- Help
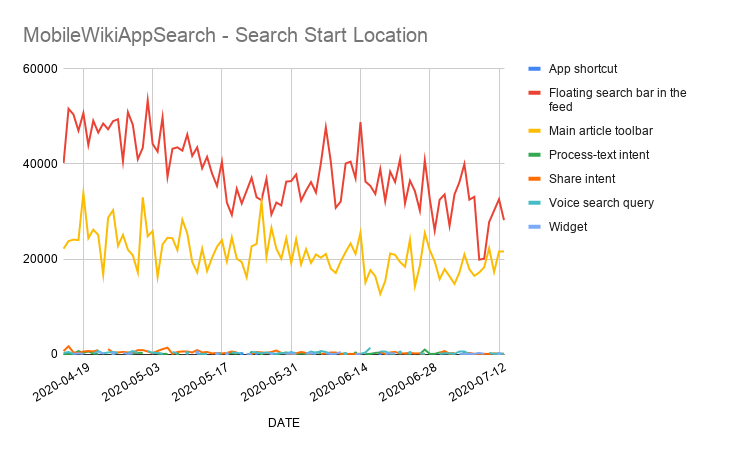
Search
- Uses global search within a session
- Uses global Search below Wikipedia Logo on “Explore”
- Uses search icon at top right that’s visible when scrolling down on “Explore”
- Uses global search on an article page
- Uses contextual search on “My lists” and “History”
- Uses contextual search on “My lists” and “History” with no results
Also happy to discuss and clarify these on a call with Shay this or next week.