Steps to Reproduce:
- Create a new chart from a data source like edits_hourly or druid.edits_hourly
- Choose table visualization and pick any kind of granularity
- Check 'Include Time' in the GROUP BY section
- Run query
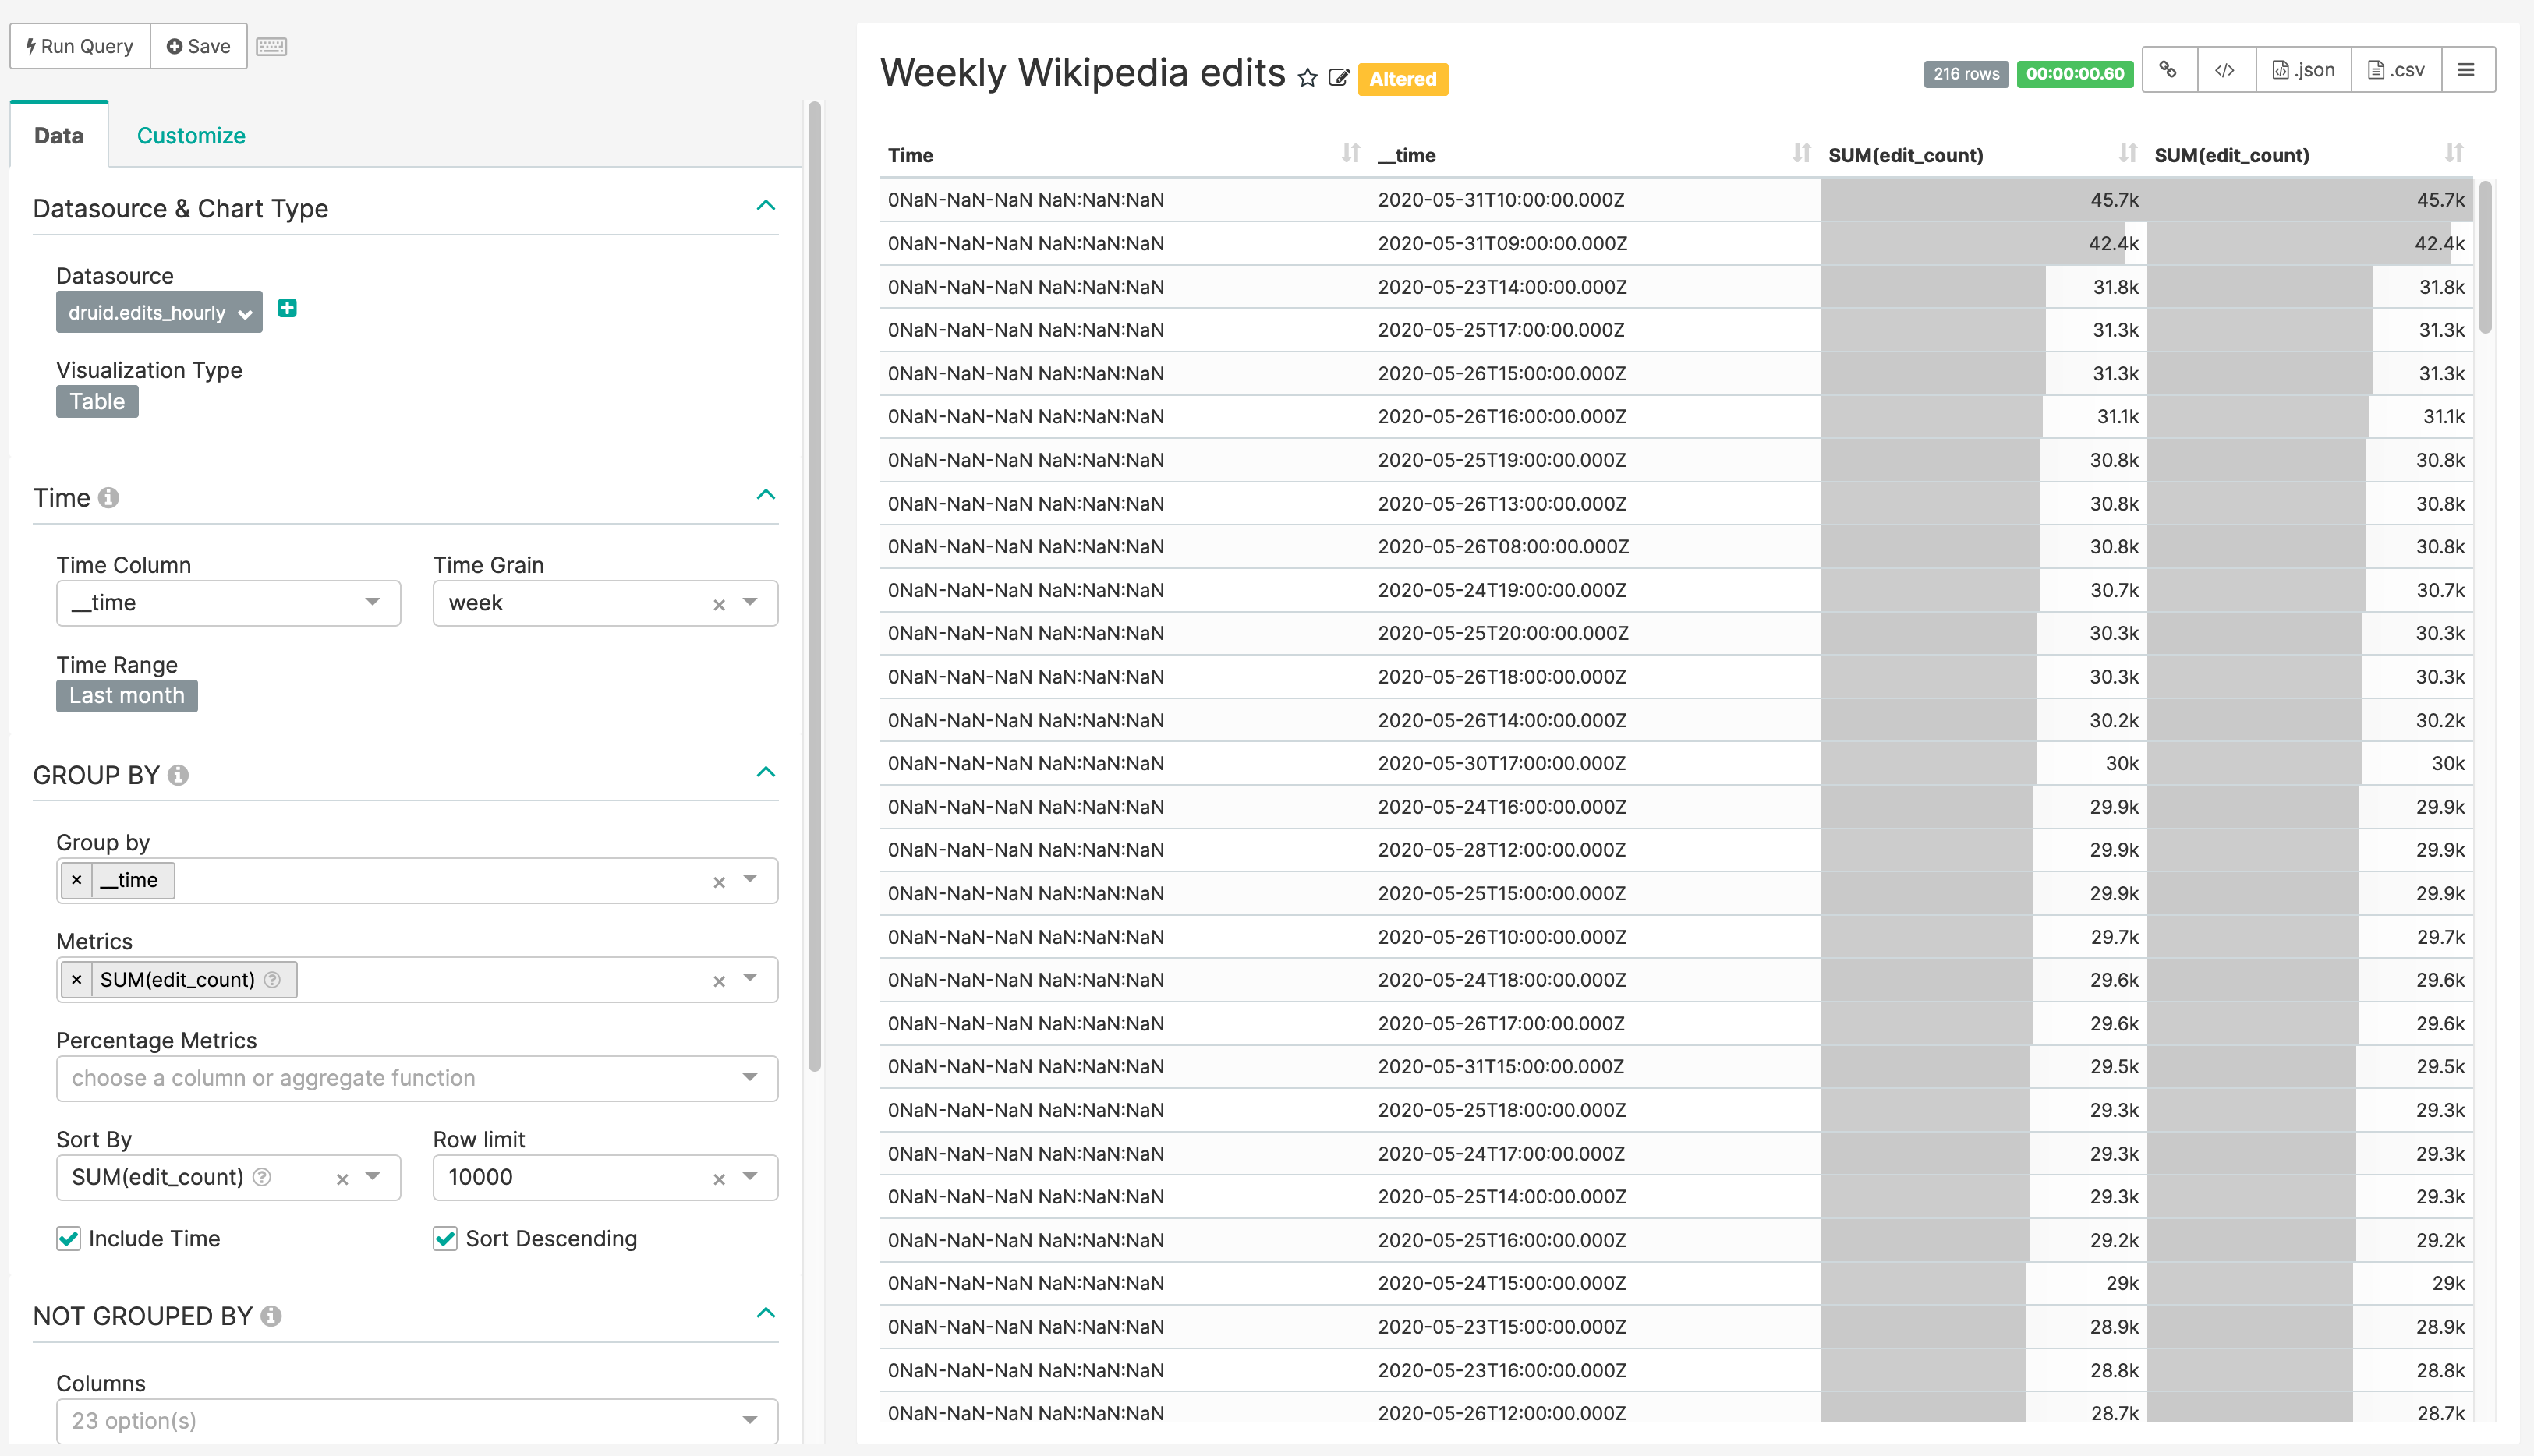
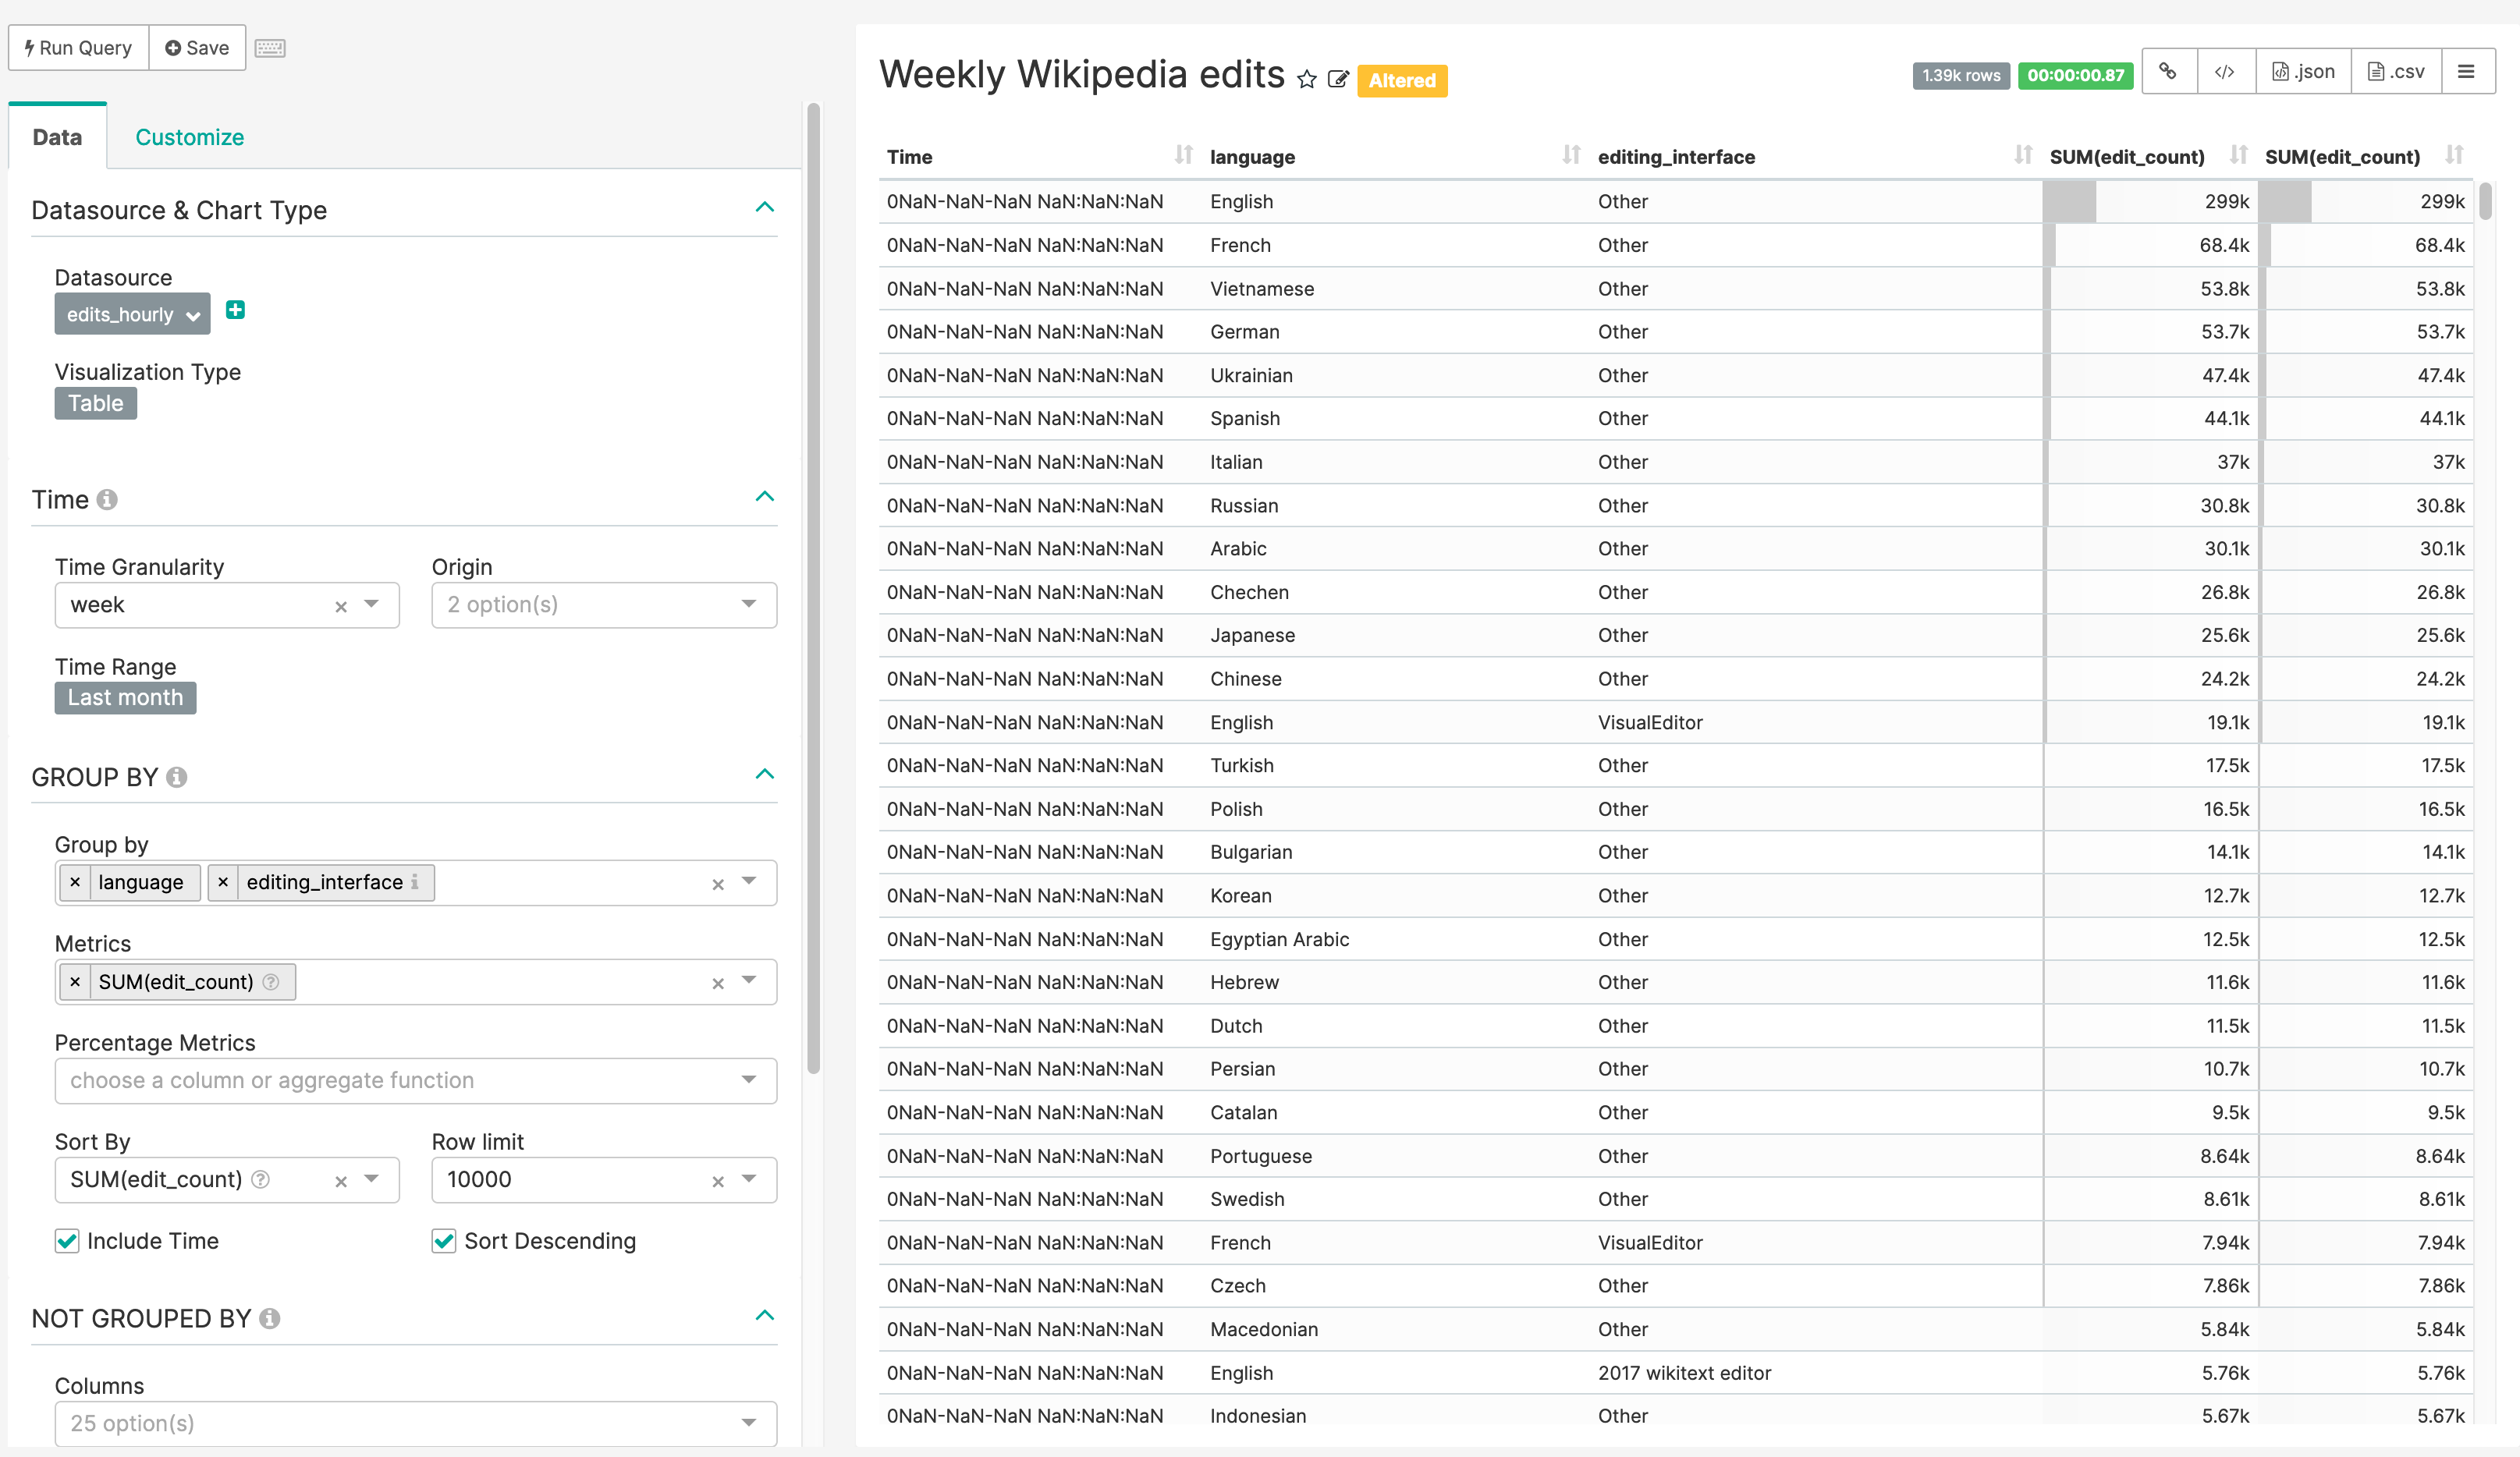
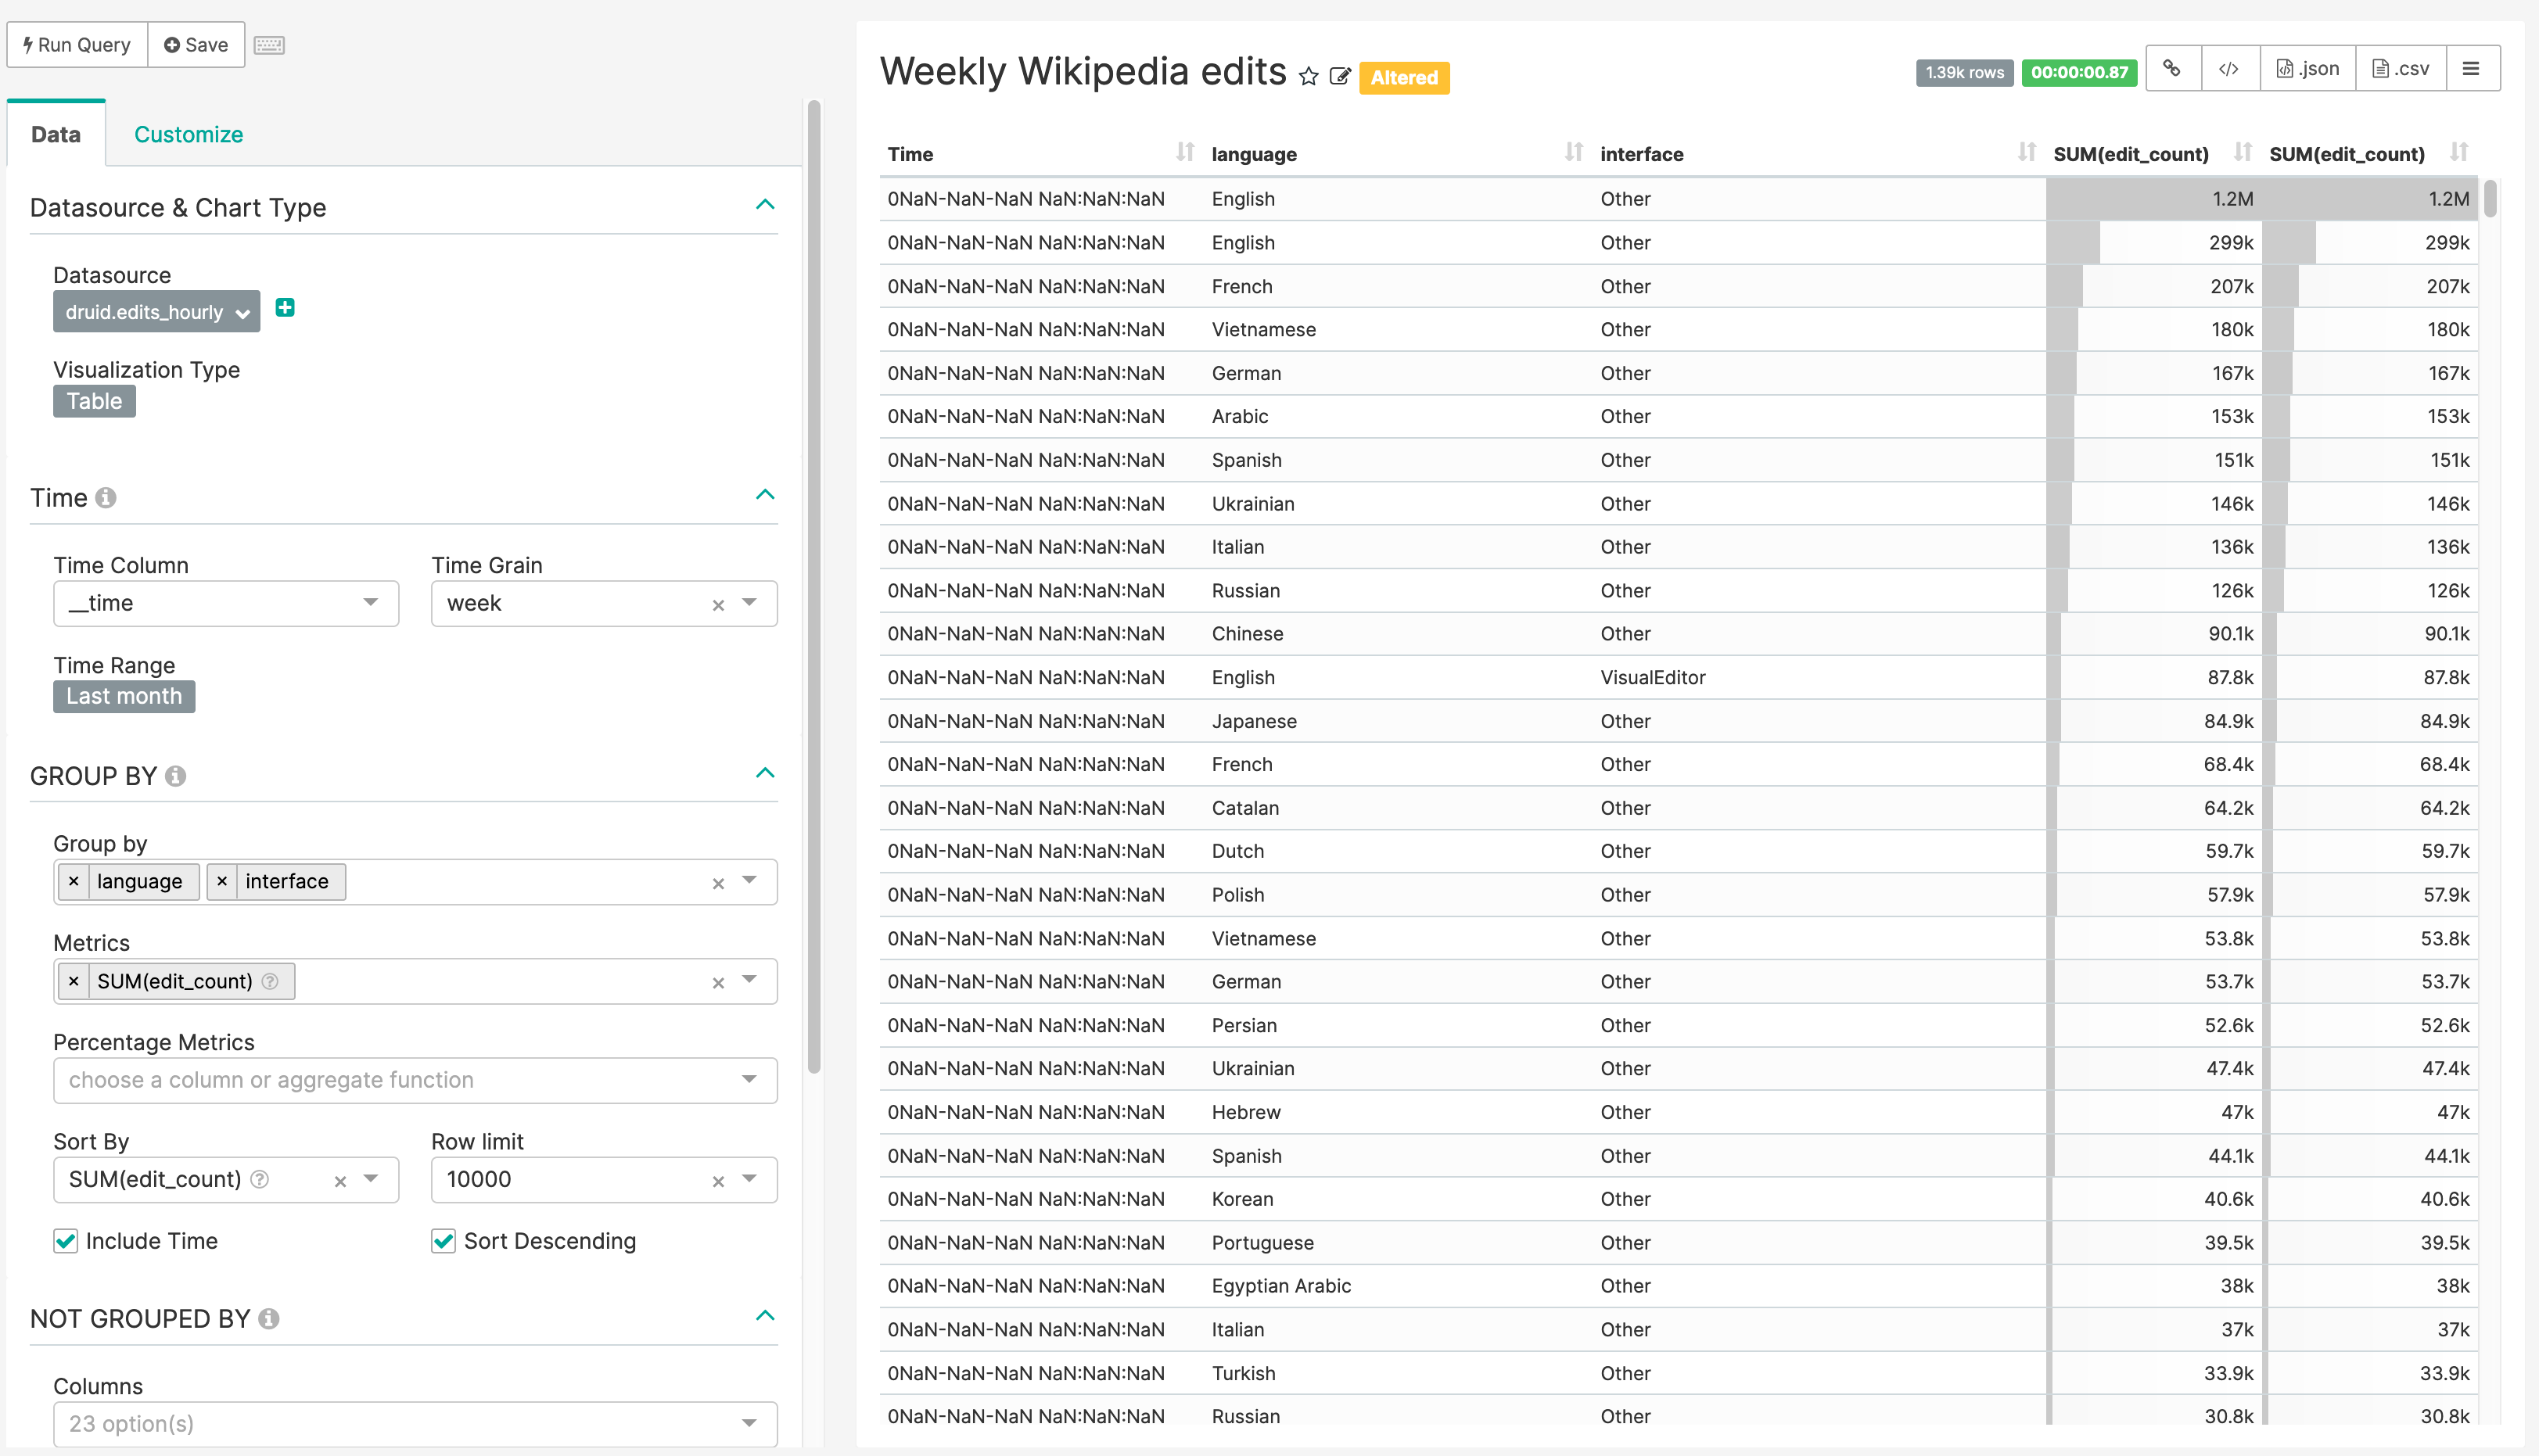
Actual Results:
Expected Results:
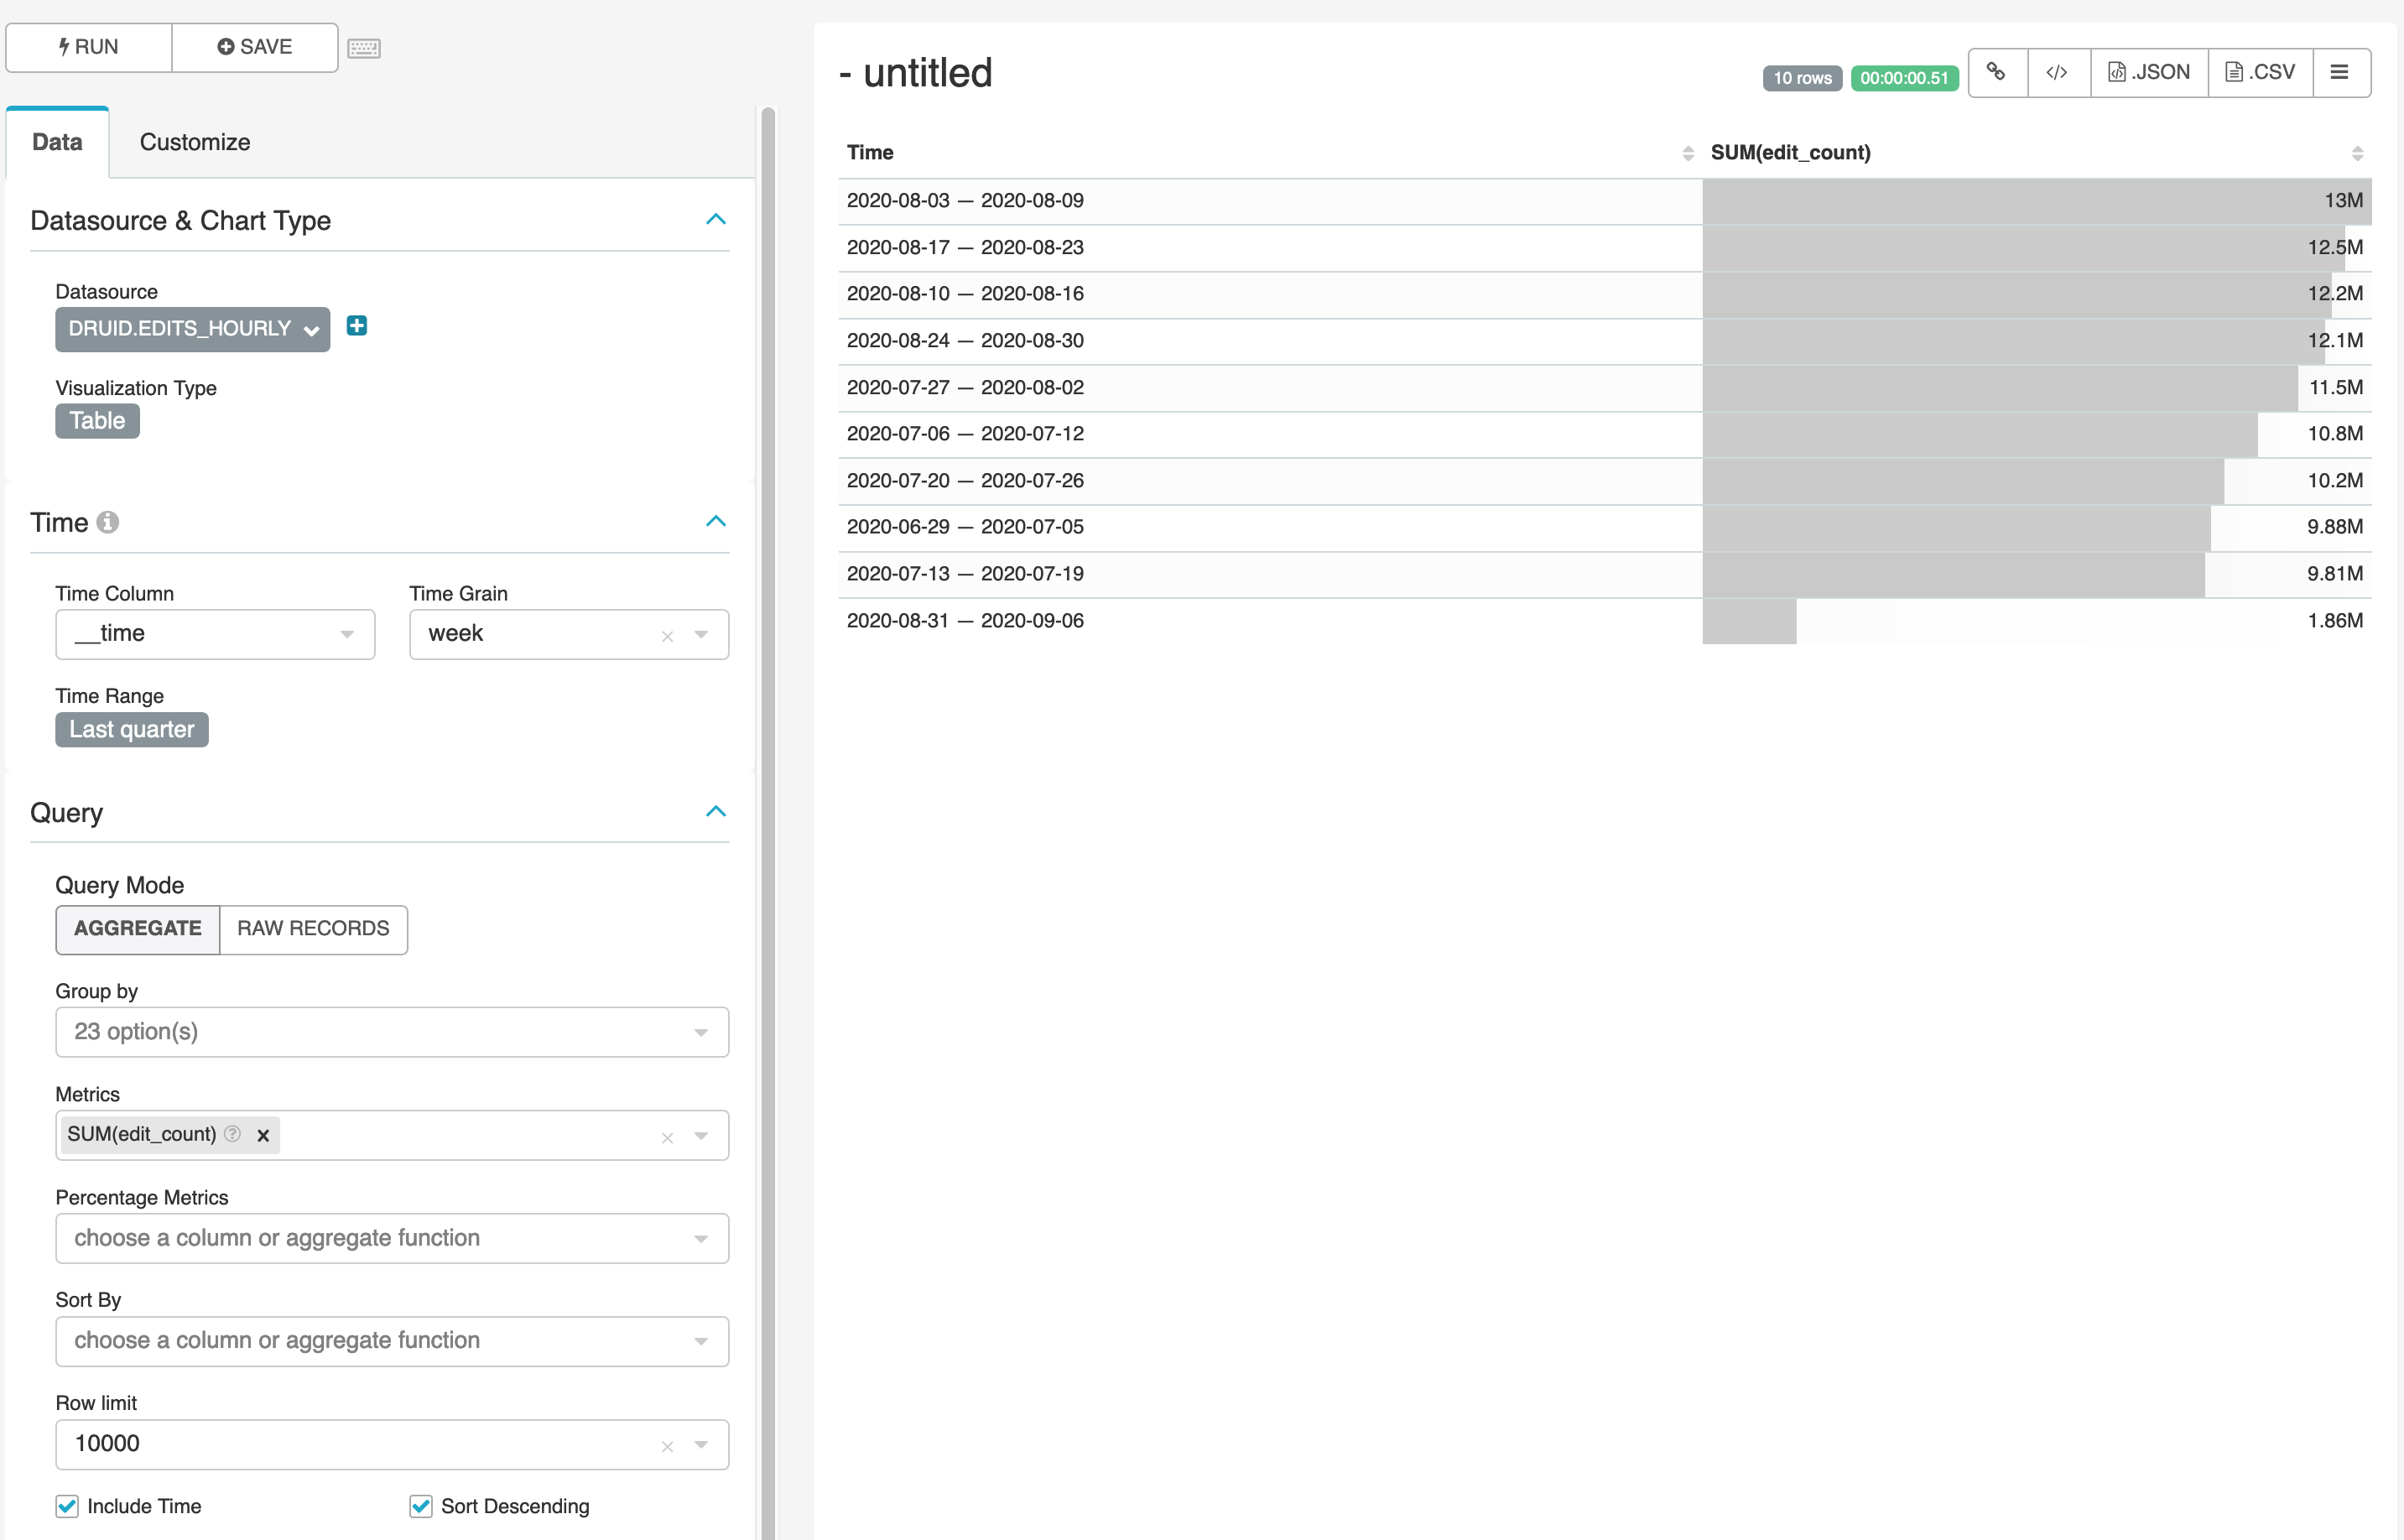
Since __time is a dimension in the druid.edits_hourly data source, we can include it manually as a dimension to GROUP BY. The __time column is what the Time column should look like: