Creation of this task was triggered by an icinga alert:
/{domain}/v1/page/most-read/{year}/{month}/{day} (retrieve the most read articles for January 1, 2016) is CRITICAL: Test retrieve the most read articles for January 1, 2016 returned the unexpected status 429 (expecting: 200): /{domain}/v1/page/most-read/{year}/{month}/{day} (retrieve the most-read articles for January 1, 2016 (with aggregated=true)) is CRITICAL: Test retrieve the most-read articles for January 1, 2016 (with aggregated=true) returned the unexpected status 429 (expecting: 200)429 is the HTTP status code for rate limiting.
Looking more into it and more specifically
https://grafana.wikimedia.org/d/35vIuGpZk/wikifeeds?orgId=1&from=1592927887704&to=1593073020947
it's obvious that usage of the service has increased 3x. This isn't a specific endpoint either. Judging from[1] and the image pasted below
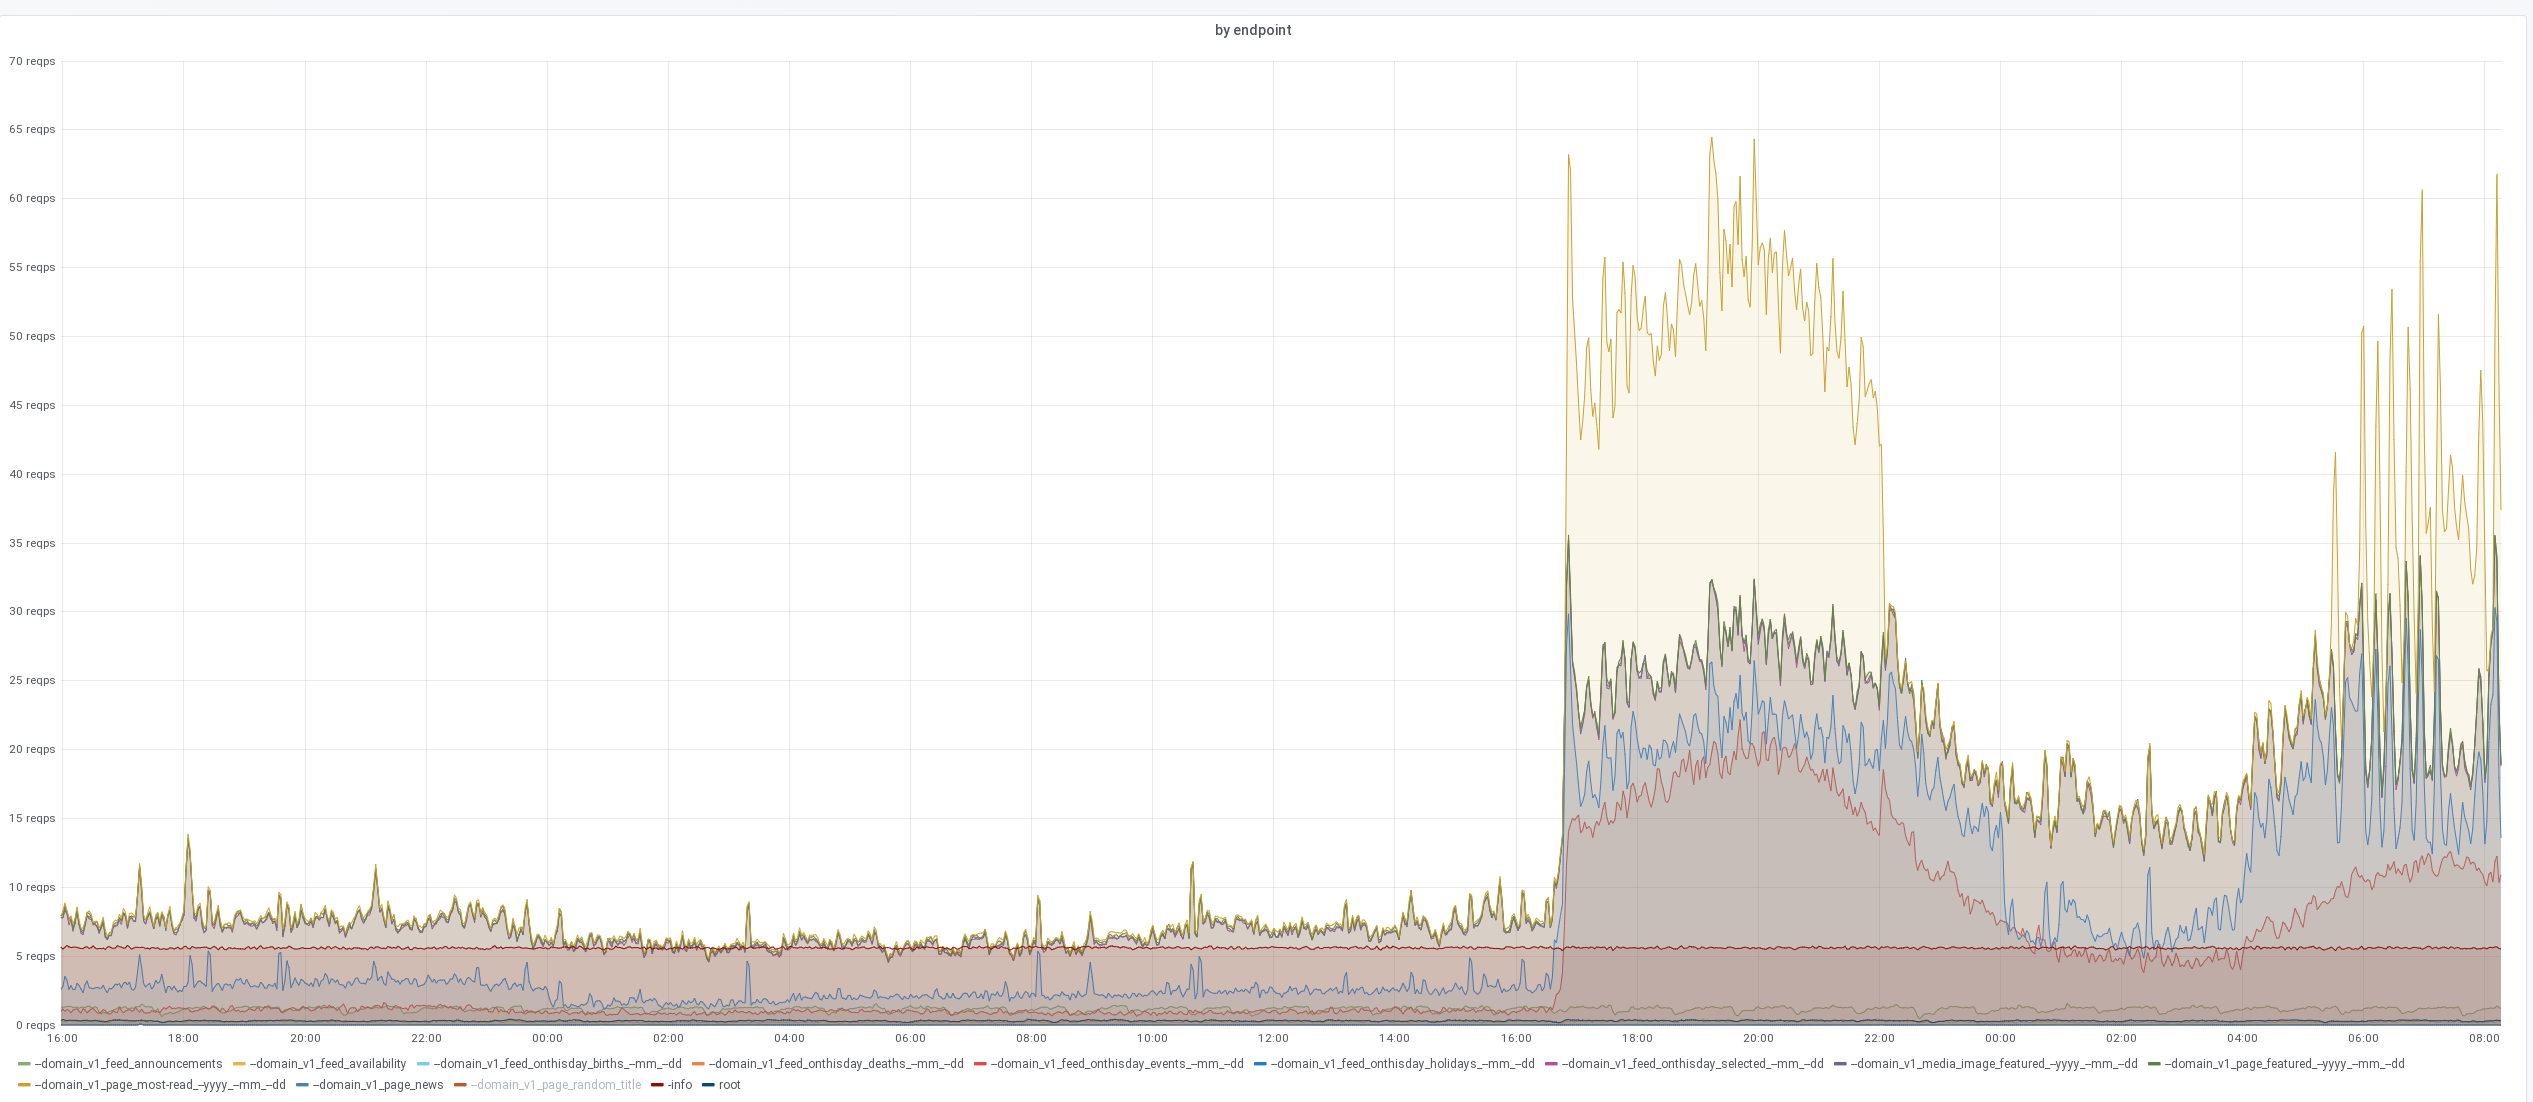
This extra traffic is violating the services stated SLOs[2], both for Traffic as well the Latency signals (Errors are violating the SLO, but way way less so) so I am guessing it's not expected.
[1] https://grafana.wikimedia.org/d/35vIuGpZk/wikifeeds?panelId=12&fullscreen&orgId=1&from=1592927887704&to=1593073020947
[2] https://wikitech.wikimedia.org/wiki/Wikifeeds#Service_level_indicators/objectives_(SLIs/SLOs)