Page MenuHomePhabricator

mw* servers memory leaks (12 Aug)
Closed, ResolvedPublic

Description

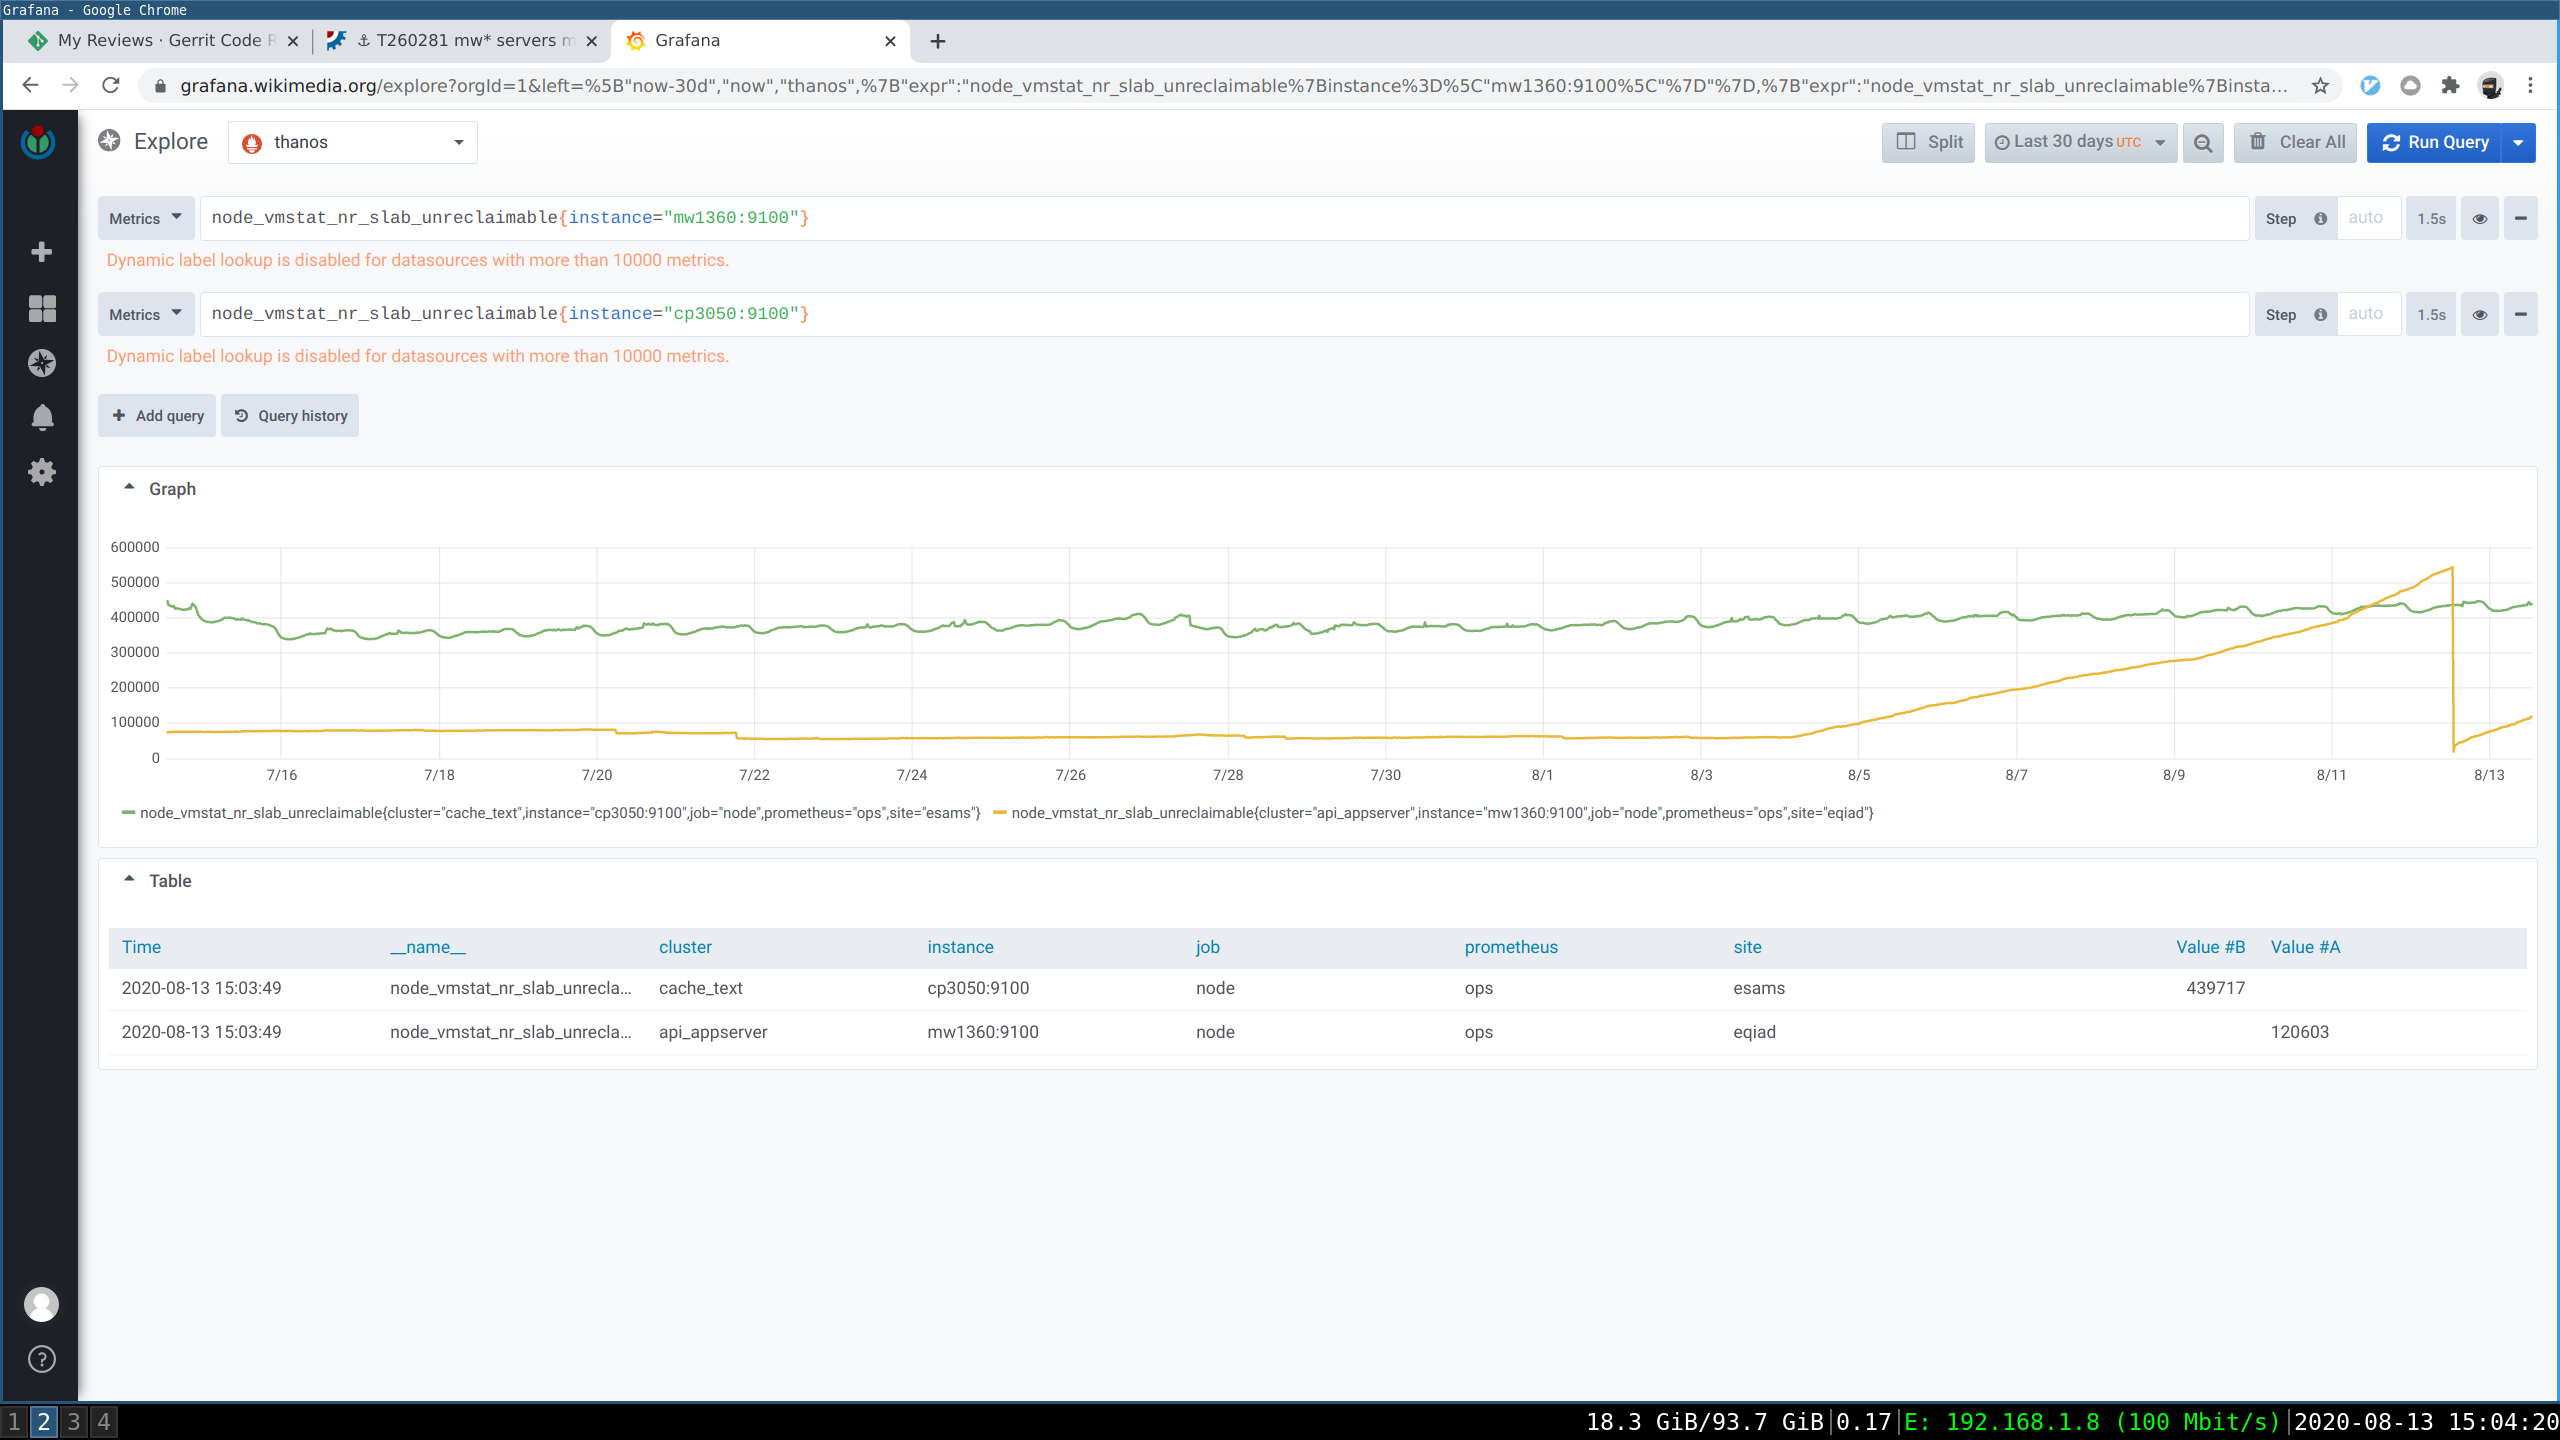
We noticed that some servers have been leaking memory possibly after the 4th of August. There are suspicions that it might be related to the following, but nothing is proven yet:

06:13	<tstarling@deploy1001>	Synchronized wmf-config/CommonSettings.php: re-enabling lilypond execution in safe mode 3rd attempt (duration: 00m 58s)

See https://sal.toolforge.org/log/TsQauHMBLkHzneNNt1NY.

Another potential trigger is the puppet change MW firejail: blacklist /run and conf cache given that many calls to mem_cgroup_create were found to be leaking.

We are letting mw1357 depooled so to investigate, @CDanis has installed bpfcc-tools on some appservers, and we have started rebooting both API and APP servers

https://grafana.wikimedia.org/d/000000377/host-overview?panelId=4&fullscreen&orgId=1&from=1596412800000&to=1597276799000&var-server=mw1357&var-datasource=thanos&var-cluster=api_appserver

TLDR for third parties: if you run MediaWiki with $wgShellRestrictionMethod = 'firejail'; you should do so with a relatively recent kernel, 4.19+ or 5.3+ IIRC.

Event Timeline

Here's a summary of my findings so far, although keep in mind that I'm well out of my depth here and this is an amalgamation of guesswork.

mw1357 is a server that was depooled and left in the leaky state without being rebooted, to preserve for investigation.

The only thing that shows up in /proc/meminfo as being obviously absurd are a very high number of 4k-sized pages allocated in the TLB. There is an abnormal amount of kernel slab allocator memory shown as being consumed (10x other servers), but it's not nearly enough to account for the usage (~2.4GB).

So since it isn't userspace processes, nor the slab allocator, nor anything else shown in meminfo, that basically has to mean that the issue is lower-level than all that. Beneath the slab allocator, and beneath all physical page allocation in Linux, is the buddy allocator. It reports stats in /proc/buddyinfo and /proc/pagetypeinfo. Each row is a kind of flavor of memory (e.g. NUMA node x, relocate-able); each column within a row is the number of free blocks for a given power-of-two number of pages, starting with 2^0==1 page==4 kB, progressing upwards to 2^10==1024 pages==4MByte of RAM.

On a healthy system without fragmentation you'll see something like this:

Node    0, zone   Normal, type      Movable      0      0      0    407    646    189    201    289    290    179   5272

Lots of large, contiguous blocks of pages are free (> 20 GB worth). There aren't many small blocks of free memory, but that's fine, as splitting larger blocks in half is trivial and fast.

On mw1357, it looks like this:

Node    0, zone   Normal, type      Movable 484607 101153   3866      0      0      0      0      0      0      0      0

This is severe internal fragmentation: the available memory exists only in small 4kB/8kB/16kB blocks, and there's no free memory in any of the larger orders of pages.

I tried sudo sysctl -w vm/compact_memory=1 on mw1357, which forces an attempt at coalescing pages, and while that created more free blocks of small orders, it didn't coalesce any small chunks into larger orders.

At this point I was suspicious of many small objects allocated in the kernel causing this excessive fragmentation.

I looked at slabtop output on mw1357 and saw this:

1 Active / Total Objects (% used) : 4335412 / 4607316 (94.1%)
2 Active / Total Slabs (% used) : 601085 / 601100 (100.0%)
3 Active / Total Caches (% used) : 77 / 120 (64.2%)
4 Active / Total Size (% used) : 2322856.84K / 2358137.30K (98.5%)
5 Minimum / Average / Maximum Object : 0.02K / 0.51K / 4096.00K
6
7 OBJS ACTIVE USE OBJ SIZE SLABS OBJ/SLAB CACHE SIZE NAME
81254784 1252990 0% 0.12K 39212 32 156848K kmalloc-node
91096904 1073266 0% 0.03K 8846 124 35384K kmalloc-32
10302253 301941 0% 0.19K 14393 21 57572K kmem_cache
11289418 289418 100% 4.00K 289418 1 1157672K kmalloc-4096
12252441 236332 0% 0.19K 12021 21 48084K dentry
13211238 211215 0% 2.00K 105619 2 422476K kmalloc-2048
14198816 69740 0% 0.12K 6213 32 24852K kmalloc-96
15175788 175285 0% 1.05K 58596 3 234384K ext4_inode_cache
16136360 136042 0% 1.00K 34090 4 136360K kmalloc-1024
17 89472 66605 0% 0.06K 1398 64 5592K kmalloc-64
18 87686 64934 0% 0.12K 2579 34 10316K kernfs_node_cache
19 68608 64147 0% 0.25K 4288 16 17152K kmalloc-256
20 65832 65489 0% 0.10K 1688 39 6752K buffer_head
21 60992 47459 0% 0.06K 953 64 3812K anon_vma_chain
22 54820 48303 0% 0.20K 2741 20 10964K vm_area_struct
23 44408 43349 0% 0.07K 793 56 3172K Acpi-Operand

For comparison, let's also look at slabtop on mw1359, another apiserver that was rebooted and has been serving requests for 9.5 hours: P12234

Things that stand out:

  • There's 1M more objects on mw1357 than mw1359, and there's almost 3x the # of slabs on mw1357
  • There's many, many more kmalloc-node and kmalloc-32 slabs in use on mw1357, by over an order of magnitude. kmalloc-32 indicates literally calls to kmalloc(32) from within the kernel. There's also a huge increase in kmalloc-4096 nodes, by many orders of magnitude, but I somehow missed this at first.

I did some work to backport bpfcc-tools from Buster to Stretch, so that I could use the memleak tracing tool it provides, which instruments kernel tracepoints and reports stacktraces of still-existent allocations that are older than a specified duration. (More details here and code here.) I installed those packages on mw1359, which is serving traffic, and for about five hours now I've been running memleak-bpfcc -o 60000 -z 31 -Z 33 30, which hooks into kernel tracepoints for kmalloc, and if the allocation was 31<x<33 bytes, saves a stacktrace, and then every 30 seconds, prints out stacktraces of any allocation that has not yet been kfree()d and also is older than 60,000 milliseconds.

Here's the output accumulated over ~5h, started at 16:24: P12237

There's many sets of traces involving memcg_create_kmem_cache and I'm a bit suspicious of it. The set of traces that doesn't involve that, involves kernfs_iop_mkdir.

Anyway, after noticing they are at least as much of a problem as the 32-byte allocations, now I'm going to similarly instrument 4kB allocations and leave that running for some hours.

There's some preliminary results from tracing 4096-byte allocations at

1[21:27:29] Top 10 stacks with outstanding allocations:
2 2416640 bytes in 590 allocations from stack
3 __alloc_pages_nodemask+0x1c2 [kernel]
4 __alloc_pages_nodemask+0x1c2 [kernel]
5 alloc_pages_current+0x91 [kernel]
6 pagecache_get_page+0xb4 [kernel]
7 grab_cache_page_write_begin+0x1c [kernel]
8 ext4_da_write_begin+0x9f [ext4]
9 ext4_da_write_end+0x142 [ext4]
10 generic_perform_write+0xcf [kernel]
11 __generic_file_write_iter+0x16a [kernel]
12 ext4_file_write_iter+0x90 [ext4]
13 mem_cgroup_try_charge+0x65 [kernel]
14 new_sync_write+0xe0 [kernel]
15 vfs_write+0xb0 [kernel]
16 sys_write+0x5a [kernel]
17 do_syscall_64+0x8d [kernel]
18 entry_SYSCALL_64_after_swapgs+0x58 [kernel]
19 2609152 bytes in 637 allocations from stack
20 __alloc_pages_nodemask+0x1c2 [kernel]
21 __alloc_pages_nodemask+0x1c2 [kernel]
22 alloc_pages_vma+0xaa [kernel]
23 handle_mm_fault+0x10ff [kernel]
24 new_sync_read+0xdd [kernel]
25 __do_page_fault+0x255 [kernel]
26 page_fault+0x28 [kernel]
27 3035136 bytes in 741 allocations from stack
28 __alloc_pages_nodemask+0x1c2 [kernel]
29 __alloc_pages_nodemask+0x1c2 [kernel]
30 alloc_pages_current+0x91 [kernel]
31 pagecache_get_page+0xb4 [kernel]
32 grab_cache_page_write_begin+0x1c [kernel]
33 ext4_da_write_begin+0x9f [ext4]
34 ext4_da_write_end+0x142 [ext4]
35 generic_perform_write+0xcf [kernel]
36 __generic_file_write_iter+0x16a [kernel]
37 ext4_file_write_iter+0x90 [ext4]
38 perf_trace_run_bpf_submit+0x4a [kernel]
39 new_sync_write+0xe0 [kernel]
40 vfs_write+0xb0 [kernel]
41 sys_write+0x5a [kernel]
42 do_syscall_64+0x8d [kernel]
43 entry_SYSCALL_64_after_swapgs+0x58 [kernel]
44 3244032 bytes in 792 allocations from stack
45 __alloc_pages_nodemask+0x1c2 [kernel]
46 __alloc_pages_nodemask+0x1c2 [kernel]
47 pcpu_populate_chunk+0xbd [kernel]
48 pcpu_balance_workfn+0x59a [kernel]
49 __switch_to_asm+0x41 [kernel]
50 __switch_to_asm+0x35 [kernel]
51 process_one_work+0x18a [kernel]
52 worker_thread+0x4d [kernel]
53 worker_thread+0x0 [kernel]
54 kthread+0xd9 [kernel]
55 kthread+0x0 [kernel]
56 ret_from_fork+0x57 [kernel]
57 4063232 bytes in 992 allocations from stack
58 __alloc_pages_nodemask+0x1c2 [kernel]
59 __alloc_pages_nodemask+0x1c2 [kernel]
60 alloc_pages_vma+0xaa [kernel]
61 handle_mm_fault+0x10ff [kernel]
62 do_nanosleep+0x8d [kernel]
63 __do_page_fault+0x255 [kernel]
64 page_fault+0x28 [kernel]
65 9363456 bytes in 2286 allocations from stack
66 __alloc_pages_nodemask+0x1c2 [kernel]
67 __alloc_pages_nodemask+0x1c2 [kernel]
68 alloc_pages_vma+0xaa [kernel]
69 handle_mm_fault+0x10ff [kernel]
70 __do_page_fault+0x255 [kernel]
71 sys_brk+0x160 [kernel]
72 page_fault+0x28 [kernel]
73 21508096 bytes in 5251 allocations from stack
74 __alloc_pages_nodemask+0x1c2 [kernel]
75 __alloc_pages_nodemask+0x1c2 [kernel]
76 alloc_pages_current+0x91 [kernel]
77 pagecache_get_page+0xb4 [kernel]
78 grab_cache_page_write_begin+0x1c [kernel]
79 ext4_da_write_begin+0x9f [ext4]
80 ext4_da_write_end+0x142 [ext4]
81 generic_perform_write+0xcf [kernel]
82 __generic_file_write_iter+0x16a [kernel]
83 ext4_file_write_iter+0x90 [ext4]
84 do_readv_writev+0x151 [kernel]
85 new_sync_write+0xe0 [kernel]
86 vfs_write+0xb0 [kernel]
87 sys_write+0x5a [kernel]
88 do_syscall_64+0x8d [kernel]
89 entry_SYSCALL_64_after_swapgs+0x58 [kernel]
90 47345664 bytes in 11559 allocations from stack
91 __alloc_pages_nodemask+0x1c2 [kernel]
92 __alloc_pages_nodemask+0x1c2 [kernel]
93 alloc_pages_vma+0xaa [kernel]
94 handle_mm_fault+0x10ff [kernel]
95 __do_page_fault+0x255 [kernel]
96 page_fault+0x28 [kernel]
97 59744256 bytes in 14586 allocations from stack
98 __alloc_pages_nodemask+0x1c2 [kernel]
99 __alloc_pages_nodemask+0x1c2 [kernel]
100 alloc_pages_current+0x91 [kernel]
101 pagecache_get_page+0xb4 [kernel]
102 grab_cache_page_write_begin+0x1c [kernel]
103 ext4_da_write_begin+0x9f [ext4]
104 ext4_da_write_end+0x142 [ext4]
105 generic_perform_write+0xcf [kernel]
106 __generic_file_write_iter+0x16a [kernel]
107 ext4_file_write_iter+0x90 [ext4]
108 new_sync_write+0xe0 [kernel]
109 vfs_write+0xb0 [kernel]
110 sys_write+0x5a [kernel]
111 do_syscall_64+0x8d [kernel]
112 entry_SYSCALL_64_after_swapgs+0x58 [kernel]
113 61636608 bytes in 15048 allocations from stack
114 __alloc_pages_nodemask+0x1c2 [kernel]
115 __alloc_pages_nodemask+0x1c2 [kernel]
116 pcpu_populate_chunk+0xbd [kernel]
117 pcpu_balance_workfn+0x59a [kernel]
118 __switch_to_asm+0x41 [kernel]
119 __switch_to_asm+0x35 [kernel]
120 process_one_work+0x18a [kernel]
121 worker_thread+0x4d [kernel]
122 worker_thread+0x0 [kernel]
123 kthread+0xd9 [kernel]
124 __switch_to_asm+0x41 [kernel]
125 kthread+0x0 [kernel]
126 ret_from_fork+0x57 [kernel]
127
although some of the stack traces make me think I need to make sure the script is tracing only the kmalloc codepaths.

A thing that someone daring in EUTZ might want to try: Using perf probe, or by modifying the bpfcc-memleak script, or by writing a trivial bpftrace script: attach a tracepoint to memcg_schedule_kmem_cache_create and gather calling stacktraces. That's the function that creates the work item that results in a worker thread calling memcg_create_kmem_cache, as seen in the stack traces we saw for 32-byte mallocs.

Joe triaged this task as Unbreak Now! priority.Aug 13 2020, 5:51 AM
Joe subscribed.

I'm not 100% sure that slabs are the problem here, but I'll try to followup later.

In the meantime, the servers we've rebooted yesterday are definitely showing the same behaviour again. This means that in a week we'll have to reboot them all again.

I am therefore:
1 - raising this task to UBN! priority, as this has the potential to disrupt the work of all SREs constantly
2 - focusing on looking at what was changed on August 4th in the morning, mostly in code, and try to rule out stuff. This might result in some reverts.
3 - Trying to build better automation around the task of rebooting a large fleet of servers.

Also adding tags for platform engineering and wikidata as the two potentially worrisome code changes regard Score's enablement and a change to Wikibase.

Mentioned in SAL (#wikimedia-operations) [2020-08-13T08:43:31Z] <_joe_> downgrading imagemagick on mw1378 T260281

attach a tracepoint to memcg_schedule_kmem_cache_create and gather calling stacktraces. That's the function that creates the work item that results in a worker thread calling memcg_create_kmem_cache, as seen in the stack traces we saw for 32-byte mallocs.

I've installed systemtap on mw1357 and started instrumenting memcg_create_kmem_cache. The function does not seem to be called at present? Same goes for memcg_create_kmem_cache.

root@mw1357:~# stap -ve 'probe kernel.function("memcg_schedule_kmem_cache_create") { print_backtrace() ; exit() }'
Pass 1: parsed user script and 477 library scripts using 153836virt/86440res/6576shr/80088data kb, in 210usr/20sys/241real ms.
Pass 2: analyzed script: 1 probe, 2 functions, 0 embeds, 0 globals using 195668virt/129392res/7460shr/121920data kb, in 560usr/70sys/620real ms.
Pass 3: using cached /root/.systemtap/cache/8a/stap_8aaac3604a689cbbd6ae1226de2f15db_1317.c
Pass 4: using cached /root/.systemtap/cache/8a/stap_8aaac3604a689cbbd6ae1226de2f15db_1317.ko
Pass 5: starting run.
# ema's note: output stops here

To make sure that nothing basic is wrong with the systemtap setup I looked for icmp_reply, that does print a backtrace.

I've installed systemtap on mw1357

Nevermind, I've seen only now that mw1357 is depooled. Here's some preliminary results from mw1359: P12251. Note that the calls happen in bursts but rarely (12:16:30, 12:16:45, 12:17:31). Also note that the traces include calls to perf_trace_run_bpf_submit, it might be wise to run the two different instrumentation tools on different hosts for clarity.

node_vmstat_nr_slab_unreclaimable is going up indefinitely on nodes affected by the issue, following a pattern that matches the general memory usage. However, the actual amount of "lost" memory does not match the size of unreclaimable slabs, which is only ~2G on mw1357:

root@mw1357:~# grep SUnreclaim /proc/meminfo 
SUnreclaim:      2097548 kB

Screenshot from 2020-08-13 15-04-23.png (1×2 px, 231 KB)

We discussed two things to try out next:

Mentioned in SAL (#wikimedia-operations) [2020-08-13T14:38:52Z] <ema> reboot mw1382 with kernel memory accounting disabled T260281

Mentioned in SAL (#wikimedia-operations) [2020-08-13T14:45:55Z] <ema> repool mw1382 with kernel memory accounting disabled T260281

I suggest setting this a security issue since this may cause people to intentionally make memory leaks to damage servers using this software.

I suggest setting this a security issue since this may cause people to intentionally make memory leaks to damage servers using this software.

If it's related to Score/Lillypond as speculated, then no third party sight should be running it anyway due to the security issues found,

Script wmf-auto-reimage was launched by cdanis on cumin1001.eqiad.wmnet for hosts:

mw1359.eqiad.wmnet

The log can be found in /var/log/wmf-auto-reimage/202008171607_cdanis_15670_mw1359_eqiad_wmnet.log.

Completed auto-reimage of hosts:

['mw1359.eqiad.wmnet']

and were ALL successful.

eprodromou subscribed.

We're tracking this, but unsure as to next steps. Let us know if more active investigation from Platform team is needed.

Joe closed subtask Restricted Task as Resolved.Aug 18 2020, 9:09 PM

Reporting here in brief:

  • We confirmed the problem had to do with activating firejail for all executions of external programs. That triggered a kernel bug
  • This kernel bug can be bypassed by disabling kernel memory accounting in cgroups, or by moving to a newer kernel like 4.19
  • For now we've gone through a full rolling reboot of our mediawiki servers to disable kernel memory accounting in cgroups
  • We might move to 4.19 at a later stage.

The issue is resolved and we're seeing ~ stable memory usage across all clusters, so the issue can be considered resolved.

TLDR for third parties: if you run MediaWiki with $wgShellRestrictionMethod = 'firejail'; you should do so with a relatively recent kernel, 4.19+ or 5.3+ IIRC.