Page MenuHomePhabricator

Improve accessibility for the Translation statistics
Closed, ResolvedPublic

Description

Screen readers will not be able to read the canvas element that is created by Chart.js.

To improve the situation, we can,

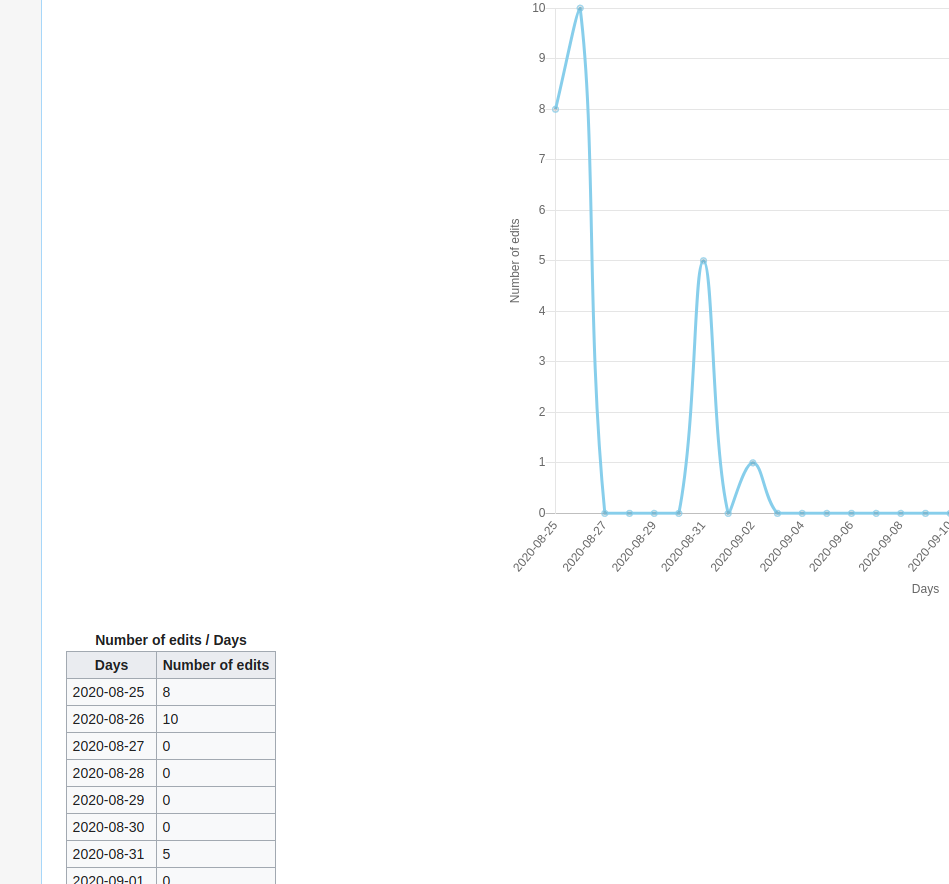
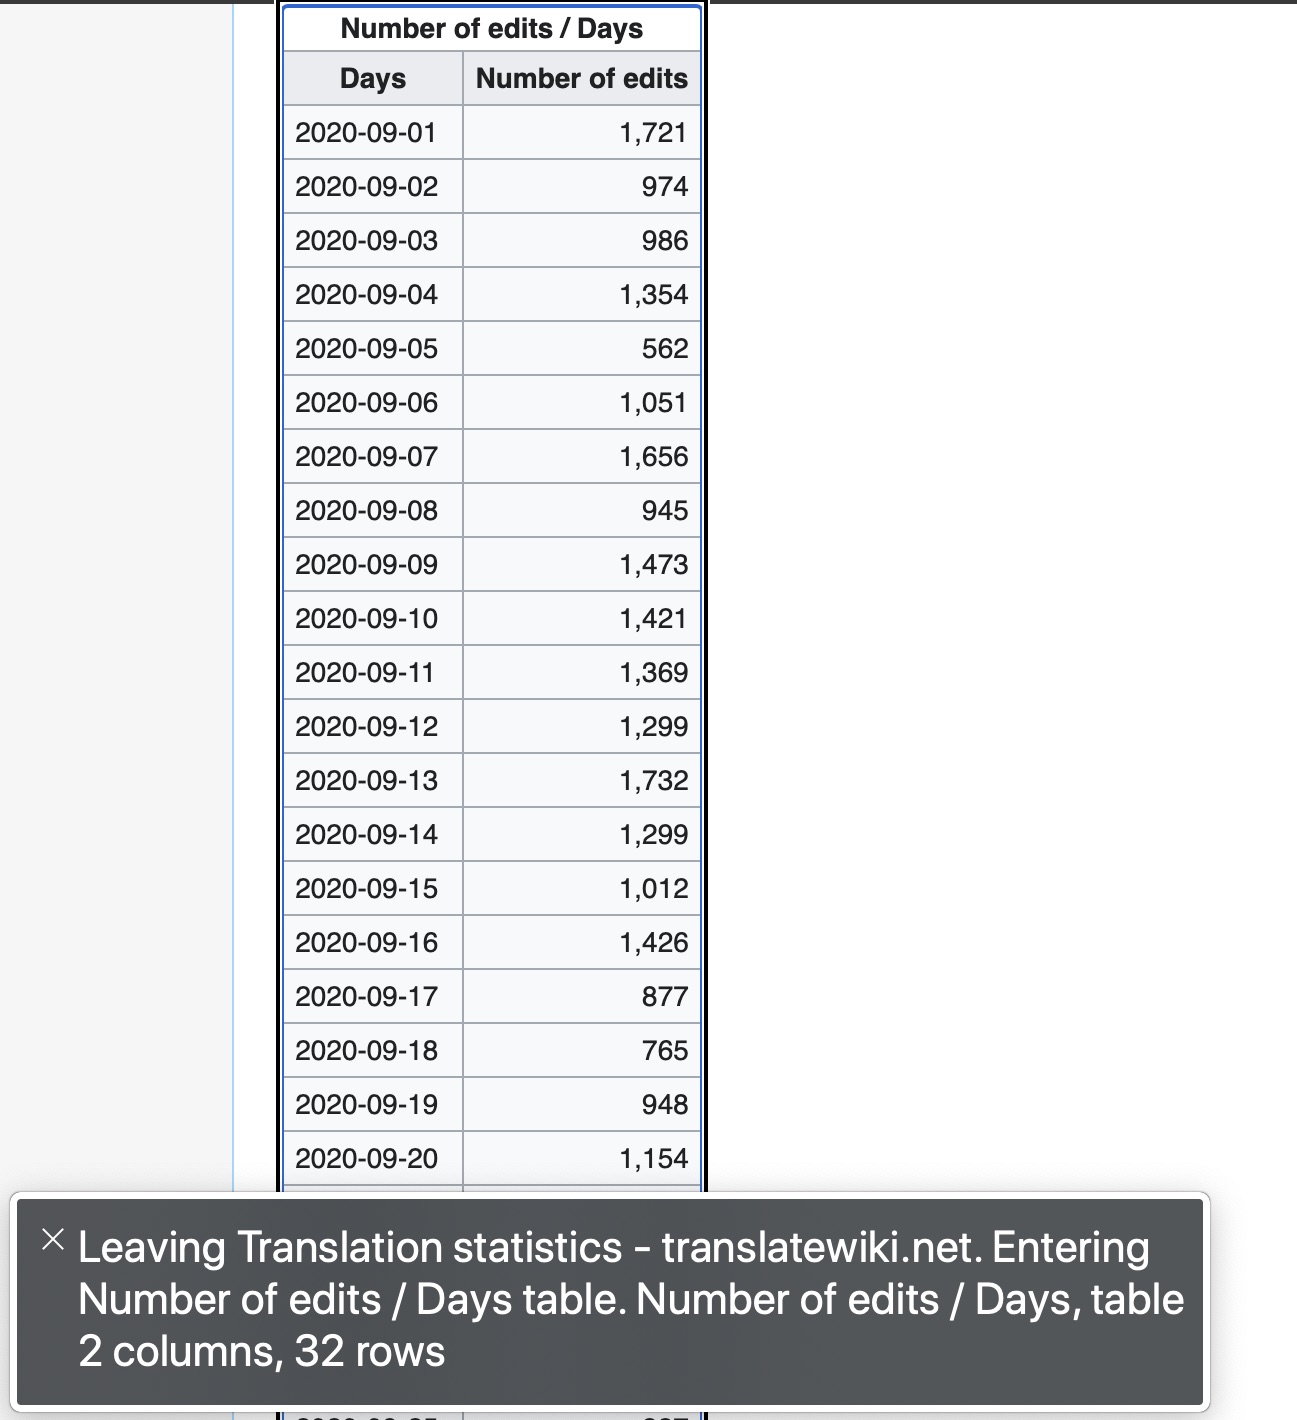
  1. Add an option to display a table; embedded inside the canvas element.
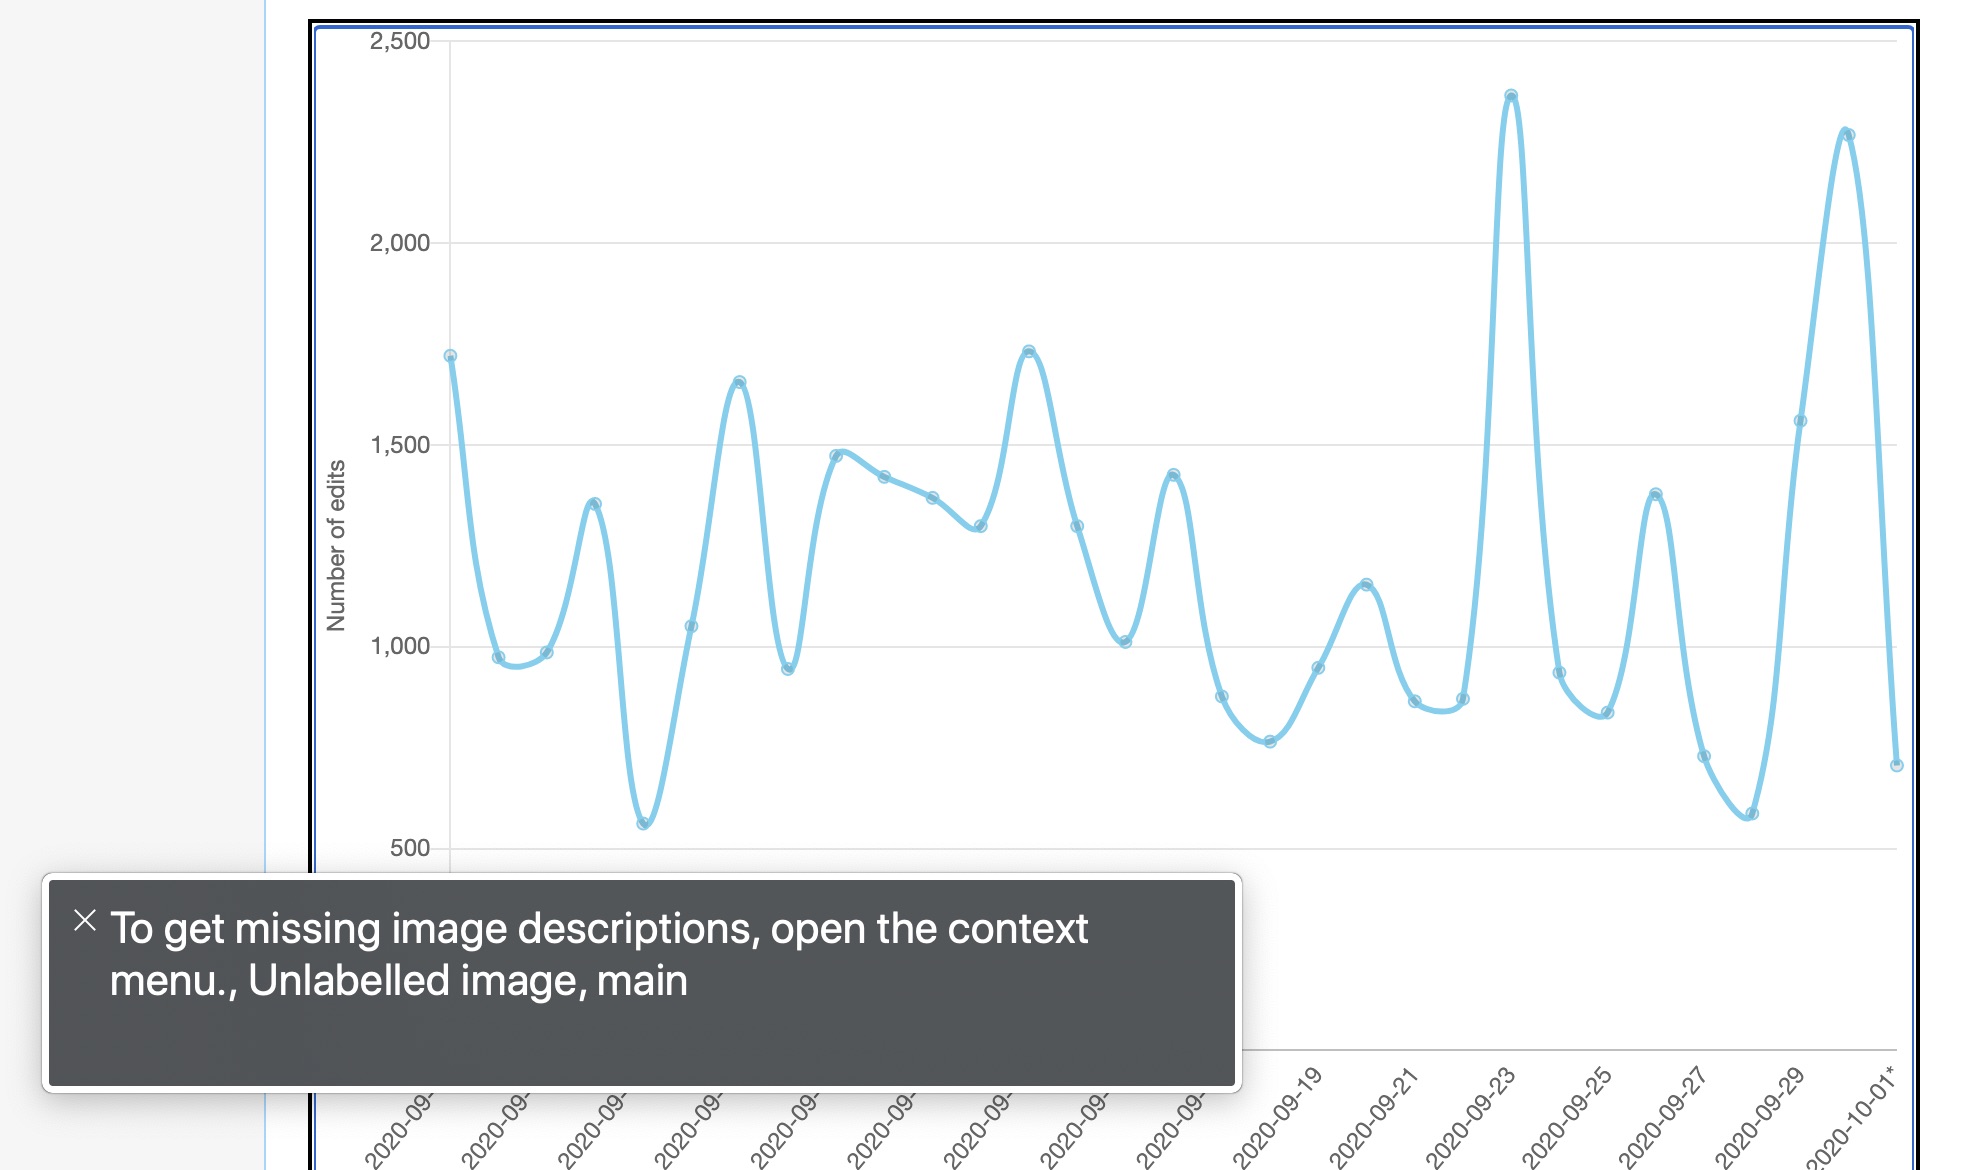
  2. Add aria-label attribute for the canvas element

References:

  1. https://www.chartjs.org/docs/latest/general/accessibility.html
  2. http://pauljadam.com/demos/canvas.html

Expected outcome

Translation statistics graphs are accessible with a screen reader.

Event Timeline

Change 629530 had a related patch set uploaded (by Abijeet Patro; owner: Abijeet Patro):
[mediawiki/extensions/Translate@master] Add table and aria-label for the translation stats graph

https://gerrit.wikimedia.org/r/629530

abi_ triaged this task as Medium priority.EditedSep 24 2020, 7:13 AM

Submitted a patch to:

  1. Add a table within the canvas element. It will not be visible to normal users, but accessible to screen readers to read out. Improved the design a little in case we want to provide user's an option to display it.
  2. Add an aria-label to the canvas element

Screenshots:

image.png (884×949 px, 43 KB)

image.png (892×1 px, 85 KB)

Change 629530 merged by jenkins-bot:
[mediawiki/extensions/Translate@master] Add table and aria-label for the translation stats graph

https://gerrit.wikimedia.org/r/629530

Nikerabbit added a subscriber: Jpita.

@Jpita Have you done any testing with screen readers? Is this something you can do? I've done rudimentary testing using NVDA+Firefox on Windows.

@Jpita Have you done any testing with screen readers? Is this something you can do? I've done rudimentary testing using NVDA+Firefox on Windows.

I didn't but I can try.
@Jrbranaa do we have any accessibility ninja in our QTE team?

@Jpita, probably the best person to talk with is @Mhurd (Monte). He did some research on this early on and might have some thoughts.

Is this what's supposed to show?
(the text inside the grey box is the text spoken out loud by the voice over software on mac)

graph.jpg (1×1 px, 199 KB)

tableTNW.jpg (1×1 px, 217 KB)

I like how the table only shows when the graph is selected

@Jpita, Yes, that is the expected behavior. I would check to ensure that the text spoken by the voice assistant conveys the data in the graph / table accurately.

@Jpita, Yes, that is the expected behavior. I would check to ensure that the text spoken by the voice assistant conveys the data in the graph / table accurately.

it doesn't, just says what is in the gray popup on the bottom

The data in the graph cannot be read because its in a canvas, but I was expecting it to read out the table. I'll check with Niklas, who tested it with NVDA on Windows.

NVDA reads the whole table by default, but there are some shortcuts which allow navigating through the table cells like using arrow keys.

Maybe there is some shortcut that is needed in your system to read the contents of the table?

I'm sure there must be but it's the first time I'm using this so no idea how to do that.
I'll try a few more things but since you're able to do it with that software I think we're good.