Page MenuHomePhabricator

Unsustainable increases in Elasticsearch cluster disk IO
Closed, ResolvedPublic

Assigned To
Authored By
EBernhardson
Sep 28 2020, 9:08 PM
Referenced Files
F32368580: termusage_eqiad.png
Sep 30 2020, 8:26 AM
F32368524: deleted_docs_eqiad.png
Sep 30 2020, 8:11 AM
F32368528: doc_count_codfw.png
Sep 30 2020, 8:11 AM
F32368518: read_write_counts_eqiad.png
Sep 30 2020, 8:11 AM
F32368514: disk_usage.png
Sep 30 2020, 8:11 AM
F32368522: doc_count_eqiad.png
Sep 30 2020, 8:11 AM
F32368526: cirrus_p99_eqiad.png
Sep 30 2020, 8:11 AM
F32368516: disk_usage.png
Sep 30 2020, 8:11 AM

Description

As a searcher i would like search to not reject my requests so i can do searchy things

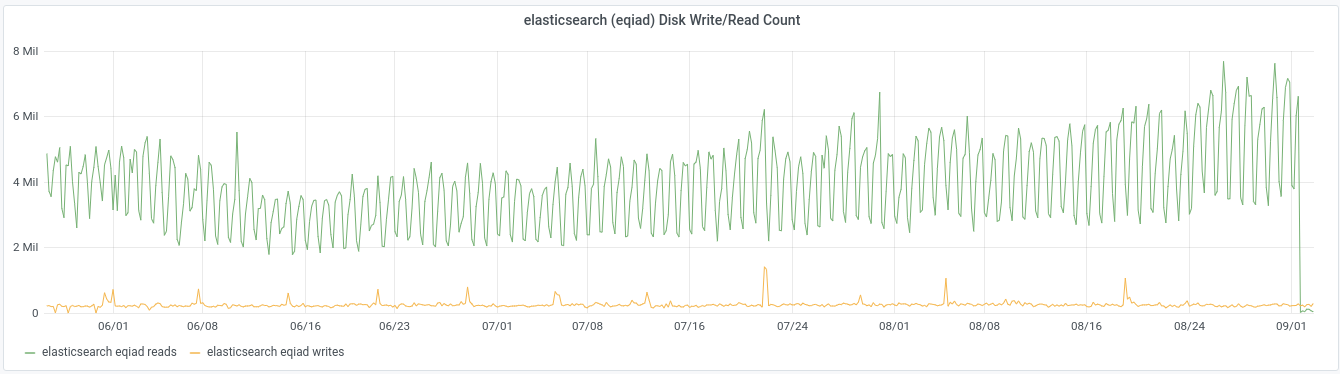
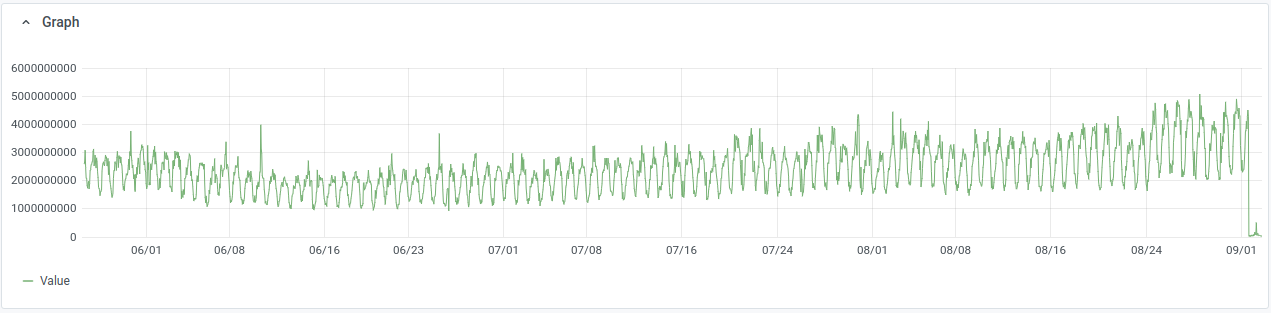
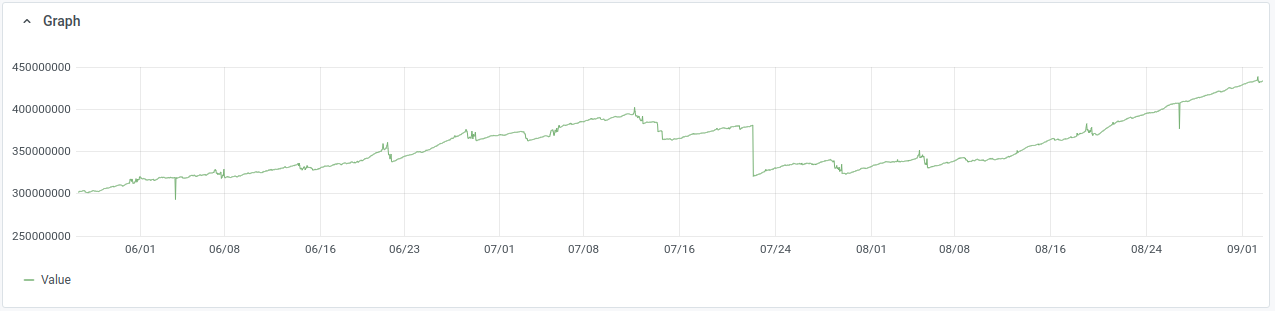
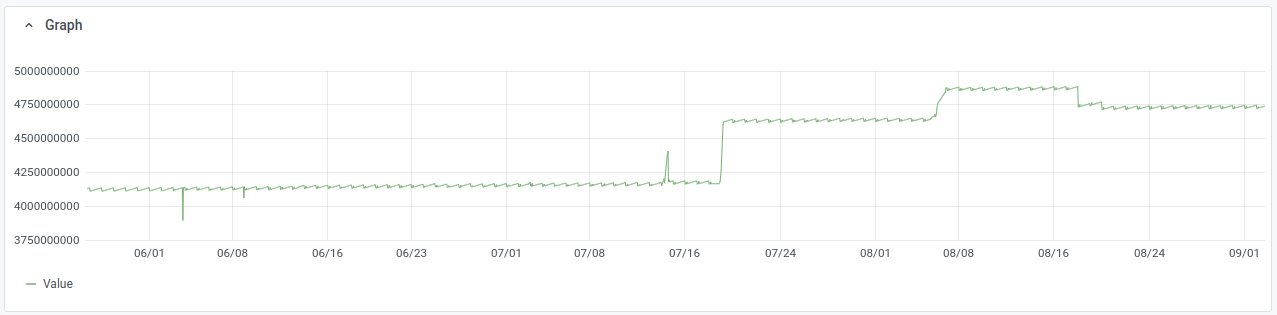
Codfw cluster alerted today. While looking into it noticed that disk utilization is surprisingly high, >30% on many servers and peaks >60% on some. Looking back over graphs[1], read rate has been high(5-7GB/sec across nodes) on codfw since we moved to that DC, looking back at eqiad pre-switchover it was similar but slightly lower (3-5GB/sec). The relevent prometheus metric only goes back to may 25th, but as recently as mid june we were doing 2-2.5GB/sec across nodes. It's been some time since i looked into this, but there was a time in the past when 500MB/sec across the cluster was typical read usage.

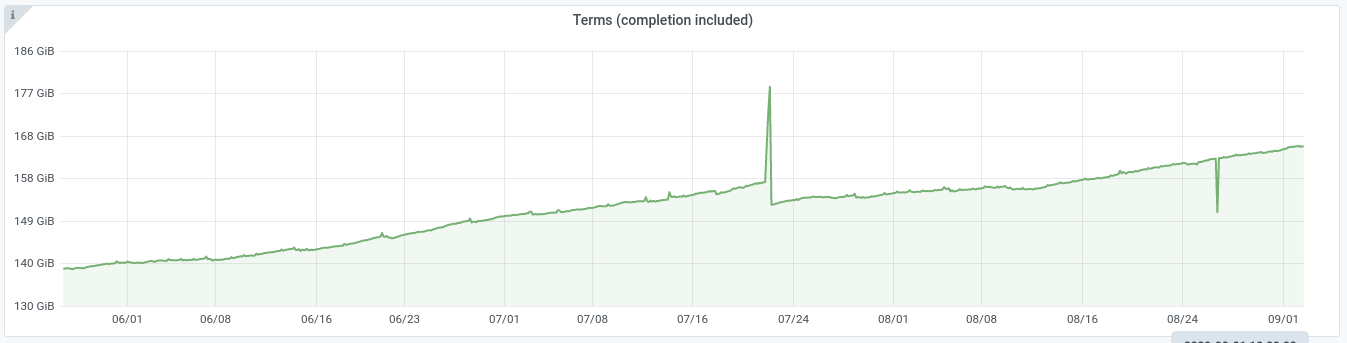
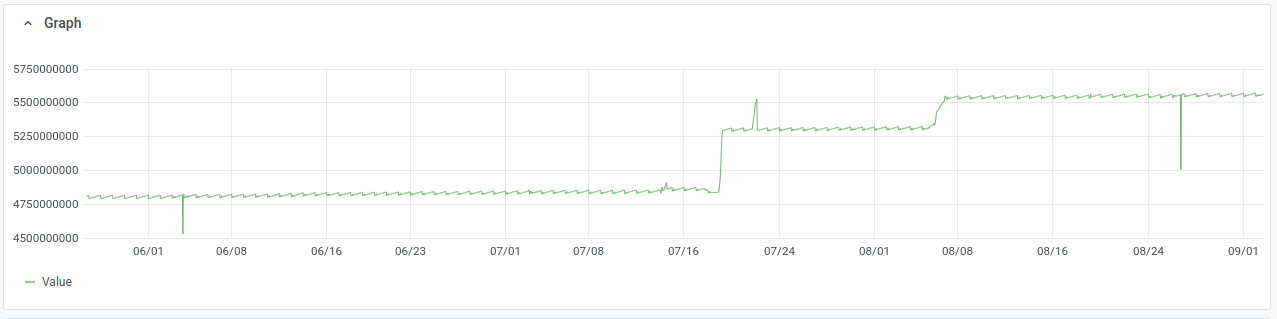
This looks like the hot set, the data that is referenced at query time, has grown larger than our available disk cache. The graphs show clear growth since the beginning of july, left unchecked this will certainly lead to resource starvation and regular interruptions of service.

[1] sum(irate(node_disk_read_bytes_total{cluster="elasticsearch",device=~"[vsh]d[a-z]"}[5m]))

Event Timeline

There are a very large number of changes, so older changes are hidden. Show Older Changes

Change 630700 had a related patch set uploaded (by Ebernhardson; owner: Ebernhardson):
[operations/mediawiki-config@master] Remove commonswiki from sister search sidebar

https://gerrit.wikimedia.org/r/630700

Change 630700 merged by jenkins-bot:
[operations/mediawiki-config@master] Remove commonswiki from sister search sidebar

https://gerrit.wikimedia.org/r/630700

As a bit of a half-hearted guess I've removed commonswiki from sister search (similar to how enwiki didn't have sister search). Not sure if this will have much effect, but it will remove the majority of the queries against our largest index. Will need to evaluate if this makes any actual change after it's been deployed a day or two.

One thing i've been investigating today is a recurring theme that I didn't dig into in the past because it didn't really matter. Specifically, we seem to have excessive deleted docs as a %, wikidata has 87 different 5GB segments that are at least 75% deleted. There are segments that are more than 90% deleted. I'm not sure how much deleted documents effect the size of thereas working set, a naive interpretation would be linear but i suspect it's not so simple. In general though i can't think of any reason why elasticsearch should maintain a 75% deleted segment instead of performing a self-merge and turning one 5GB segment into a 2GB segment. This may be a red herring though, overly deleted segments aren't new. They may exacerbate the current situation, but couldn't be the trigger.

EBernhardson renamed this task from Unsustainable increases in Elsaticsearch cluster disk IO to Unsustainable increases in Elasticsearch cluster disk IO.Sep 28 2020, 11:55 PM

Mentioned in SAL (#wikimedia-operations) [2020-09-28T23:56:57Z] <ebernhardson@deploy1001> Synchronized wmf-config/InitialiseSettings.php: T264053: Remove commonswiki from sidebar search (duration: 01m 09s)

Something seems to have happened around jul 14th, it's particularly visible on https://grafana.wikimedia.org/d/000000607/cluster-overview?orgId=1&var-site=eqiad&var-cluster=elasticsearch&var-instance=All&var-datasource=thanos&from=now-90d&to=now (esp. the temperature&network graphs).
The search thread pool sizes started to rise more regularly after this date as well.

We are usually approaching daily peak load about now, read rate across the cluster is ~4GB/s, all of the last 7 days peaked at > 6GB/s, suggesting the mitigation of reducing commonswiki queries is having some impact.

This is not a long term solution, expecting that once we figure out the root cause commonswiki can be re-enabled in sistersearch. This is also not particularly effective, 4GB/s is reduced but i expect we are still in an area where we can start dropping queries, and if the rate of IO continues to grow as before this mitigation will only buy a few weeks till we are back at the same point.

As additional information enforcing the theory that we are running out of memory, the latest machines we have added have 256G, vs the older 128G machines. Just before the cluster switchover[1] we see 1032 - 1052 performing > 100MB/s of io, while 1053 - 1067 are at ~10MB/s (expected historical steady-state).

[1] https://grafana.wikimedia.org/d/000000607/cluster-overview?orgId=1&var-site=eqiad&var-cluster=elasticsearch&var-instance=All&var-datasource=thanos&from=1598753500853&to=1599046421050

Data sizes are up quite a bit[1] since june (as far back as we have history). Data filesystem usage as reported by elasticsearch has increased from 17TB in late may, to a peak of 23TB mid september. Interestingly datasizes have decreased slightly to 22TB in the last few weeks. This amounts to a 1/3 increase in data size in only 4 months. It's important to consider that we were already well above our typical IO usage by the time this data starts, unfortunately we do not have enough retention to see at what point this really started.

[1] sum by () (avg by (host) (elasticsearch_filesystem_data_size_bytes{exported_cluster=~"production-search-(eqiad|codfw)"})) - sum by () (avg by (host) (elasticsearch_filesystem_data_free_bytes{exported_cluster=~"production-search-(eqiad|codfw)"}))

From talking to @dcausse this morning and further investigation, the shard count increases deployed in july seem to have exacerbated the situation. I'm not convinced this is the start of our problems though. From above, we were already seeing 50+MB/sec of read while we expect closer to ~10MB/sec when the hot set fits in memory. Wish we had more historical data on this, but it seems to be the limits of our prometheus retention.

It seems plausible that rolling back the resharding changes and accepting large shards could help things along, but I can't think of any way yet to strengthen those assumptions without just doing it.

For the record here are some graphs taken over the same period (jun-2020 to sept-2020):

disk usage (query pasted by Erik two comments above):

disk_usage.png (315×1 px, 32 KB)

term usage (eqiad):

termusage_eqiad.png (343×1 px, 26 KB)

read write counts (eqiad):

read_write_counts_eqiad.png (374×1 px, 112 KB)

read throughput:

read_throughput_eqiad.png (313×1 px, 79 KB)

doc count (eqiad):

doc_count_eqiad.png (319×1 px, 28 KB)

deleted docs (eqiad):

deleted_docs_eqiad.png (311×1 px, 26 KB)

doc count (codfw)

doc_count_codfw.png (315×1 px, 28 KB)

cirrus requests p99 (eqiad)

cirrus_p99_eqiad.png (312×1 px, 54 KB)

few notes:

  • without more historical data we can't exclude a seasonal effect
  • somewhat suspicious bump in read counts around aug 24
  • suspicious bump in cirrus p99 mid july (maxing out around 20s)
    • seems to be due to regex queries
  • concerning continuous increase in deleted docs (seems to stabilize after early september, invisible in this graph)
  • suspicious bumps in doc counts (we might double check stale indices and failed reindex)
    • seems to be due to extremely large api-feature-usage indices (apifeatureusage-2020.07.18 is 135M docs)

Overall I'm not convinced that the shard increase is the cause of the higher read throughput either, at least it does not seem to be obvious in the graph around mid july when it happened. It might be the cause of other problems (p99?) and are kind of unrelated to this particular ticket.

From our meeting this morning

Short term options:

  • Increase cache on more_like queries from the current 24h to 3 or maybe 7 days.
    • Some light analysis of query logs could probably figure out if the recommendations actually change in this time period. My gut feeling is this would be a minimal, likely unnoticed, change in user experience.
    • There is a seperate question of if these recommendations are used by users. We think they probably are, but there is no data collection so it's possible this query load has minimal purpose.
  • We can move more_like queries to the alternate cluster. This is our typical load mitigation strategy,
    • We generally try and avoid using this as any type of longer-term solution. If we need the second cluster to be able to serve typical traffic loads that means we have no failover.
    • This broke for a week one time and no-one filed a ticket (no one noticed?). In theory should we run into a proper failover situation it could be turned off.

Mid term:

  • We still don't have any good way to identify what exactly what it causing the increase in data size. We suspect commonswiki + wikidata indices as the obvious culprits, they are the largest and have required re-sharding to keep up with their size increases. We should at least think about how this can be improved in the future
  • We know that pulling data from disk to answer queries causes significant throughput reductions (summer 2016 readahead issues iirc), but no alerts were setup. We have various graphs that include IO, but these are not regularly referenced. Part of what went wrong here is we didn't notice that IO was a problem until it had been clearly growing for 4+ months.

Long term:

  • Separate cluster for wikidata+commonswiki?
    • Wikidata and commonswiki have fundamentally different models than the other wikis. While enwiki is relatively steady state at 5-6M articles, commons and wikidata expect constant growth.
    • There is already precedent from sql sharding large sites into their own thing. s1 contains only enwiki. s4 is commonswiki + testcommonswiki. s8 is wikidatawiki + testwikidatawiki.
    • We could trial this by sending queries to the alernate datacenter, we would still have to hold the data on the primary clusters but removing the read requests should reduce the memory needed.

Increase cache on more_like queries from the current 24h to 3 or maybe 7 days.

I pulled some recommendations from our query logs and lined up the requests over multiple days along with the results. P12863

While i only eyeballed it, it seems the predictions are relatively constant over a two-week timespan. There are random small changes, but they can be explained by stats differences between shards. I do note that pages are not typically requested every day so did some analysis of potential cache requirements:

We have somewhere around 200M total content pages.

ebernhardson@mwmaint1002:~$ curl https://search.svc.eqiad.wmnet:9243/*_content/page/_count?pretty
{
  "count" : 198520234,
  "_shards" : {
    "total" : 405,
    "successful" : 405,
    "skipped" : 0,
    "failed" : 0
  }
}

The cached content is <15kb per page (this dump is the same as the cached structure, size should at least be in right ballpark). A review of mediawiki-config mc.php shows we use MemcachedPeclBagOStuff. Afaict we don't configure the compress_threshold, so we accept the default of 1.5kB. Longwinded way of saying we dont cache 15kB, i think we cache closer to 2kB per page.

curl -s 'https://en.wikipedia.org/wiki/?search=morelike:Foobar&ns0=1&cirrusDumpResult&limit=3' |wc -c
11214
curl -s 'https://en.wikipedia.org/wiki/?search=morelike:Foobar&ns0=1&cirrusDumpResult&limit=3' | gzip -1 | wc -c
1474

Overall, 200M pages and 2kb gives us 400GB. That's actually quite significant. Of course even at 7 day retention we wouldn't have 100% of pages in cache. While it won't be the true value, we can an estimate for the number of pages cached by counting the number of unique pages we see queries for over rolling windows. I did not have time to prepare that analysis in time for the backport window, based on the current analysis limiting the cache to three days seems the best option.

Change 631312 had a related patch set uploaded (by Ebernhardson; owner: Ebernhardson):
[operations/mediawiki-config@master] cirrus: Increase more_like cache from one to seven days

https://gerrit.wikimedia.org/r/631312

Overall, 200M pages and 2kb gives us 400GB.

I ran analysis looking at the number of unique pages we had more_like requests for over windows of 1, 3 and 7 days. The analysis was repeated starting on seven sequential days (9th - 16th of sept), reported ranges are min - max over the seven separate analysis.

windowunique pagesest cache sizeΔΔ %
7 days20M - 20.5M41 GB12.8GB45%
316.4M-17.3M34.66.4GB22%
112.7M-14.1M28.200

Unclear on practical impacts of increasing cache usage by 6-13GB.. If i'm reading graphs right the overall wan cache is 18 servers * 90G each per dc, or a little over 1.5TB. Puts 7 days at ~2.5% of the cache. This is certainly fine for a short term fix. As a thought, this is an in-memory cache but due to edge caching we don't hit it all that often (hit rate 50-70%, good but nothing crazy). Maybe there is a disk-backed cache we can swap in instead of wan object cache, in which case 40G would be inconsequential.

Change 631312 merged by jenkins-bot:
[operations/mediawiki-config@master] cirrus: Increase more_like cache from one to three days

https://gerrit.wikimedia.org/r/631312

Mentioned in SAL (#wikimedia-operations) [2020-10-01T18:40:17Z] <ebernhardson@deploy1001> Synchronized wmf-config/InitialiseSettings.php: cirrus: increase more_like recommendation cache from one to three days T264053 (duration: 00m 59s)

Increase in cache duration will need a few days to take full effect. After that we can review cache metrics to verify we achieved the desired effect of reducing the more_like query rate, along with verifying that effects a reduction in our IO usage. Looking for elastic2025-54 to get much closer to elastic2056-60 (which have more memory).

David mentioned the deleted docs count, and I've been somewhat suspicious of that as well. Reviewing our config, we override the default merge configuration to use a single thread (instead of default 4 per 6.5.4 docs). This is per-shard, so a single instance may still perform many parallel merges. Looking into the relevant elasticsearch bits they create info level logs when throttling merge requests and i can't find any matching logs. Likely merge isn't an issue, but not 100% on that.

operations/mediawiki-config wmf-config/InitialiseSettings.php

// Number of merge threads to use. Use only 1 thread
// (instead of 3) to avoid updates interfering with
// actual searches
'merge.scheduler.max_thread_count' => 1,

Decided there isn't much risk in changing the merge scheduler on the idle cluster, so i've updated our four largest indices (commonswiki_file, wikidatawiki_content, enwiki_general, enwiki_content) to have merge.scheduler.max_thread_count = 4 on the eqiad cluster. Some stats about these indices recorded below to compare after the weekend.

indexdocsdeleteddeleted %size on disk
commonswiki_file25,606,18781,733,82424%4,873 GB
wikidatawiki_content98,097,90939,254,17928.6%2,662 GB
enwiki_general34,025,34213,390,73428.2%2,014 GB
enwiki_content8,305,2422,460,53522.8%1,086 GB

Same stats for codfw, to get an estimate of how much change is simply natural variance and unrelated to the config change. We should look at how to adjust the elasticsearch prometheus exporter to report these metrics for a subset of indices so they can be referred to over usefull timespans.

indexdocsdeleteddeleted %size on disk
commonswiki_file817340232328065222.2%4,857 GB
wikidatawiki_content980987423904235728.5%2,683 GB
enwiki_general340253951363365628.6%1,958 GB
enwiki_content8305272259720523.8%1,103 GB

As a thought, this is an in-memory cache but due to edge caching we don't hit it all that often (hit rate 50-70%, good but nothing crazy). Maybe there is a disk-backed cache we can swap in instead of wan object cache, in which case 40G would be inconsequential.

Looked through the object cache configurations deployed to production. The only configured disk backed cache (SqlBagOStuff) is explicitly for the multi-level parser cache. Maybe we could look into setting up a table somewhere for this use case, but I don't think the benefit is worth the effort unless we have specific requests to limit cache usage.

No particular changes observed updating the max merge threads. Not particularly unexpected, nothing was complaining about throttling but seemed easy to test.

Spent some time looking over the merge policy / scheduler used in elasticsearch. The configurability of this has been greatly reduced over time and the documentation has been completely removed. It seems elastic aren't enthusiastic about end users changing settings here. The only config that seems relevant is index.merge.policy.deletes_pct_allowed which defaults to 33 and accepts values between 20 and 50. I updated this to 20 on eqiad wikidatawiki_content and merges involving ~50M docs started. From above index had 98M live docs and another 39M deleted before change.

In general i suspect our problem is the overall implementation of TieredMergePolicy that is used. If I'm reading the implementation right it splits "too big" segments off into a separate bucket and only thinks about merging them if it can't meet targets by merging small segments. This is only a suspicion though, i would have to spent much more time working out how exactly it's calculating the scores, and how that applies to our production state.

The deleted rate also, while large, is within the pre-set 33% so overall merging the deleted docs out of the largest segments would simply allow it to keep more deleted docs in the newer segments. Setting to 20% across the board will save us some disk space and likely some read IO, at the expense of write IO which is usually pretty low but also some read IO. Not sure how to evaluate, other than deploying, if that change makes any useful difference.

Followup on merge scheduler changes, the four indices that were updated with 20% deleted pct in eqiad:

indexlive docsdeleted docsdeleted %size on disksize on disk Δlive segments
commonswiki_file_159535451581,817,30717,398,87717.5%4,685.8 GB-4%4,529.8 GB
wikidatawiki_content_158707636498,205,59821,561,72118.0%3,246.9 GB+22%2,252.7 GB
enwiki_general_158719875634,040,0946,441,55515.9%1,591.6 GB-21%1548.2 GB
enwiki_content_15946894688,307,6151,163,04912.3%1,053.9 GB-3%969.0 GB

And the same for codfw, which had no change (typical variation over time):

indexlive docsdeleted docsdeleted %size on disksize on disk Δlive segments
commonswiki_file_159470919481,817,58924,388,51223.0%4,826.5 GB-1%4,688.7 GB
wikidatawiki_content_158707639798,205,51639,292,78928.6%2,771.4 GB+3%2,605.7 GB
enwiki_general_158719030234,040,18313,878,22629.0%1,978.6 GB+1%1,931.3 GB
enwiki_content_15947358448,307,6253,216,24127.9%1,195.5 GB+ 8%1,145.1 GB

Looking into why wikidatawiki_content is 20% larger, we find 994 GB of segments that are commited but not searchable. These segments all list size.memory of 0, suggesting they are not being used in any way but are staying around on disk. To account for these the live segments column was added above, this is the size on disk of searchable segments. Overall for our 4 largest indices the size on disk of live segments is 10% lower with the reduced deletes_pct_allowed. That wont translate directly into a 10% reduction of the hot set in memory, but it might help a bit. Our hot set is at least 3.25TB (the cache memory size in codfw), an optimistic 5% reduction in this set would be > 166 GB, It seems while the effect is small in %, it might be worth applying to codfw.

Increase in cache duration will need a few days to take full effect. After that we can review cache metrics to verify we achieved the desired effect of reducing the more_like query rate, along with verifying that effects a reduction in our IO usage. Looking for elastic2025-54 to get much closer to elastic2056-60 (which have more memory).

Cache hit rate increased and morelike qps declined 10-20%. No obvious effect on cluster io or cpu load. Not likely worth further pursuing, unclear if we should retain the 3 day cache or revert back to 1 day. Likely there isn't much reason to revert, the extra cpu overhead while hard to measure is still likely worthwhile.

One final option we can consider, the current readahead of 256 512-byte sectors (=128kB) is entirely arbitrary[1]. We had some servers with a large value that were performing poorly, and servers with this value that were performing acceptably. We could try cutting this in half. Remember from last time that we cannot simply change the readaheads, this requires a server restart to re-open the mmap'd files with the new readahead settings.

For some proof this may be worthwhile we can look at the same data as the previous ticket (the page-types tool pages marked uptodate,lru,active). From this it looks like ~11GB of the ~80G per-server caches are holding useless data. This is only slightly increased from what we saw when first deploying this (~8GB unused).

                     flags      page-count       MB  symbolic-flags                     long-symbolic-flags                                      
elastic2040: 0x0000000000000068    2882721    11260  ___U_lA___________________________________ uptodate,lru,active
elastic2041: 0x0000000000000068    3009014    11753  ___U_lA___________________________________ uptodate,lru,active
elastic2042: 0x0000000000000068    2903549    11341  ___U_lA___________________________________ uptodate,lru,active
elastic2043: 0x0000000000000068    2618836    10229  ___U_lA___________________________________ uptodate,lru,active
elastic2044: 0x0000000000000068    2907252    11356  ___U_lA___________________________________ uptodate,lru,active
elastic2045: 0x0000000000000068    2939135    11480  ___U_lA___________________________________ uptodate,lru,active
elastic2046: 0x0000000000000068    2870283    11212  ___U_lA___________________________________ uptodate,lru,active
elastic2047: 0x0000000000000068    2743741    10717  ___U_lA___________________________________ uptodate,lru,active
elastic2048: 0x0000000000000068    2914654    11385  ___U_lA___________________________________ uptodate,lru,active
elastic2049: 0x0000000000000068    2586502    10103  ___U_lA___________________________________ uptodate,lru,active
elastic2050: 0x0000000000000068    2962702    11573  ___U_lA___________________________________ uptodate,lru,active

[1] https://phabricator.wikimedia.org/T169498#3523149

Mentioned in SAL (#wikimedia-operations) [2020-10-05T19:56:15Z] <ebernhardson> restart elasticsearch_6@production-search-codfw on elastic2050 to take reduced (128kB) readahead settings T264053

Mentioned in SAL (#wikimedia-operations) [2020-10-05T20:13:27Z] <ebernhardson> restart elasticsearch_6@production-search-codfw on elastic2051 to take reduced (64 sector, 32kB) readahead settings T264053

elastic2050 to take reduced (128kB) readahead settings

this is mistaken, its 128 sectors, 64kB.

Mentioned in SAL (#wikimedia-operations) [2020-10-05T20:26:13Z] <ebernhardson> restart elasticsearch_6@production-search-codfw on elastic2051 to take reduced (32 sector, 16kB) readahead settings T264053

Change 632319 had a related patch set uploaded (by Ebernhardson; owner: Ebernhardson):
[operations/puppet@production] Lower elasticsearch readahead from 128kB to 16kB

https://gerrit.wikimedia.org/r/632319

We might want to let it run a day or two to have more confidence, but the immediate results of reducing readahead looks like a win. For reference the changes applied were 64kB for 2050, 32kB for 2051, and 16kB for 2052. These all show a dramatic reduction in IO, 2052 is the most dramatic, going from 200+ MB/s down to 30 MB/s of IO required. iops are slightly down, from ~2.75k to ~2k. This suggests most of the IO reduction comes from the smaller size of requests, but also less requests are being performed as a result of less unused pages going into the page cache.

elastic2050: 0x0000000000000068    1559281     6090  ___U_lA___________________________________      uptodate,lru,active
elastic2051: 0x0000000000000068     762209     2977  ___U_lA___________________________________ uptodate,lru,active
elastic2052: 0x0000000000000068     757551     2959  ___U_lA___________________________________ uptodate,lru,active

Applied P5883 from the previous incident to elastic2025-55 (56+ have 256M memory and aren't having issues). Aggregate read rate across codfw declined from 3GB/s to 500MB/s. This program basically turns off readahead for all currently open files of the elasticsearch process.

Mentioned in SAL (#wikimedia-operations) [2020-10-05T22:01:24Z] <ebernhardson> restore wikidatawiki_content enwiki_content enwiki_general and commonswiki_file to default index.merge.policy.deletes_pct_allowed on eqiad cirrus cluster T264053

restore wikidatawiki_content enwiki_content enwiki_general and commonswiki_file to default index.merge.policy.deletes_pct_allowed on eqiad cirrus cluster

Adjusting the merge settings saved some space in eqiad, but at this point it doesn't look like it will be necessary to apply these settings to codfw. Elasticsearch doesn't seem to want you messing with these settings much anyways, so restore to defaults and keep in mind as a potential future option.

Command ran:

for index in wikidatawiki_content enwiki_content enwiki_general commonswiki_file; do curl -XPUT -H 'Content-Type: application/json' https://search.svc.eqiad.wmnet:9243/$index/_settings -d '{"index":{"merge.policy.deletes_pct_allowed": null}}';  done

Change 632319 merged by Ryan Kemper:
[operations/puppet@production] Lower elasticsearch readahead from 128kB to 16kB

https://gerrit.wikimedia.org/r/632319

Change 634089 had a related patch set uploaded (by Ebernhardson; owner: Ebernhardson):
[operations/mediawiki-config@master] Revert "cirrus: Increase more_like cache from one to three days"

https://gerrit.wikimedia.org/r/634089

Change 634089 merged by jenkins-bot:
[operations/mediawiki-config@master] Revert "cirrus: Increase more_like cache from one to three days"

https://gerrit.wikimedia.org/r/634089

Reviewed deployed mitigations:

  • Turn off commonswiki in sister search
    • Decided to keep this in place for now. The io reduction was noticable and our io metrics have not yet stabilized, making it hard to know what it's isolated effect was
  • Increase morelike cache from 1 to 3 days
    • Returned cache to 1 day. The hit rate increased and we served ~25% less more like queries, but there was no noticable drop in IO which was our initial goal
  • Merge scheduler max thread count changed back to default (4) from our custom value of 1
    • This had basically zero effect. We could change it back to one, but since we never seem to hit this limit anyways it seems reasonable to stay with elasticsearch defaults.
  • Merge max_deletes_pct_allowed
    • This has a noticable reduction in on-disk size of active segments, and the cost is more read/write io to perform the merges. Reviewing eqiad metrics there is no noticable change in write load, although it might be more noticable when also serving queries. For now this seems worth keeping in place.
    • This is only deployed to the four largest indices in eqiad, we should probably consider either full deployment or turning it off. Or a jutsification for only turning it on for these four.
EBernhardson removed a project: Patch-For-Review.

After having sat with this some time, the metrics look reasonably happy since mid october when above mitigations were applied. Since the T271493 found what was likely the underlying cause of the increase in working site size, also mitigated. The only remaining thing is to re-enable sister search for commonswiki, a sub-task has been created and this can be closed.

Change 702754 had a related patch set uploaded (by Ryan Kemper; author: Ryan Kemper):

[operations/puppet@production] cirrus: systemd timer for readahead script

https://gerrit.wikimedia.org/r/702754

Mentioned in SAL (#wikimedia-operations) [2021-07-02T01:16:29Z] <legoktm> uploaded elasticsearch-madvise 0.1 to apt.wm.o (T264053)

Mentioned in SAL (#wikimedia-operations) [2021-07-02T01:16:29Z] <legoktm> uploaded elasticsearch-madvise 0.1 to apt.wm.o (T264053)

The source for this deb is at https://gitlab.com/legoktm/es-thingy - I'll import it into Gerrit tomorrow.

Change 702754 merged by Ryan Kemper:

[operations/puppet@production] cirrus: systemd timer for readahead script

https://gerrit.wikimedia.org/r/702754

Small bugfix for the previous patch: https://gerrit.wikimedia.org/r/c/operations/puppet/+/702785

I forgot to add the Bug: directive for it, so leaving this comment here.

Change 702788 had a related patch set uploaded (by Ryan Kemper; author: Ryan Kemper):

[operations/puppet@production] cirrus: fix broken module path

https://gerrit.wikimedia.org/r/702788

Change 702788 merged by Ryan Kemper:

[operations/puppet@production] cirrus: fix broken module path

https://gerrit.wikimedia.org/r/702788

Change 702790 had a related patch set uploaded (by Ryan Kemper; author: Ryan Kemper):

[operations/puppet@production] Revert 1c99db9965361cdf95f042bb2401e86733a31393

https://gerrit.wikimedia.org/r/702790

Change 702790 merged by Ryan Kemper:

[operations/puppet@production] Revert 1c99db9965361cdf95f042bb2401e86733a31393

https://gerrit.wikimedia.org/r/702790

Change 702791 had a related patch set uploaded (by Ryan Kemper; author: Ryan Kemper):

[operations/puppet@production] cirrus: systemd timer for readahead script

https://gerrit.wikimedia.org/r/702791

Mentioned in SAL (#wikimedia-operations) [2021-07-02T03:05:27Z] <ryankemper> T264053 sudo -E cumin 'P:elasticsearch::cirrus' 'sudo disable-puppet "verify new deb package works - T264053"'

Change 702791 merged by Ryan Kemper:

[operations/puppet@production] cirrus: systemd timer for readahead script

https://gerrit.wikimedia.org/r/702791

Mentioned in SAL (#wikimedia-operations) [2021-07-02T03:07:04Z] <ryankemper> T264053 ryankemper@elastic2054:~$ sudo run-puppet-agent --force

Mentioned in SAL (#wikimedia-operations) [2021-07-02T03:07:57Z] <ryankemper> T264053 Error: Execution of '/usr/bin/apt-get -q -y -o DPkg::Options::=--force-confold install elasticsearch-madvise' returned 100: Reading package lists... grr

Mentioned in SAL (#wikimedia-operations) [2021-07-02T03:11:55Z] <ryankemper> T264053 sudo -E cumin 'P:elasticsearch::cirrus' 'sudo apt update' fixed the issue

Mentioned in SAL (#wikimedia-operations) [2021-07-02T03:14:57Z] <ryankemper> T264053 sudo -E cumin 'P:elasticsearch::cirrus' 'sudo run-puppet-agent --force'

Change 704567 had a related patch set uploaded (by Ryan Kemper; author: Ryan Kemper):

[operations/puppet@production] elastic: Fix timer to fire continually

https://gerrit.wikimedia.org/r/704567

The previous implementation of the temporary mitigation for elasticsearch readahead - using a timer to run the madvise program every 30 minutes - had an issue with the systemd timer where the timer would only fire once rather than every 30 minutes. This is because it was incorrectly using OnActiveSec instead of OnUnitActiveSec. This is fixed in https://gerrit.wikimedia.org/r/c/operations/puppet/+/704567

Change 704567 merged by Ryan Kemper:

[operations/puppet@production] elastic: Fix timer to fire continually

https://gerrit.wikimedia.org/r/704567

Mentioned in SAL (#wikimedia-operations) [2021-07-19T18:19:30Z] <ryankemper> T264053 Deploying fix for timer issue: ryankemper@cumin1001:~$ sudo cumin -b 36 'P{elastic*}' 'sudo systemctl stop elasticsearch-disable-readahead.timer && sudo systemctl disable elasticsearch-disable-readahead.timer && rm -fv /etc/systemd/system/elasticsearch-disable-readahead.timer && rm -fv /usr/lib/systemd/system/elasticsearch-disable-readahead.timer && sudo run-puppet-agent'

Mentioned in SAL (#wikimedia-operations) [2021-07-19T18:27:07Z] <ryankemper> T264053 Deploying fix for timer issue on cloudelastic: ryankemper@cumin1001:~$ sudo cumin -b 6 'P{cloudelastic*}' 'sudo systemctl stop elasticsearch-disable-readahead.timer && sudo systemctl disable elasticsearch-disable-readahead.timer && rm -fv /etc/systemd/system/elasticsearch-disable-readahead.timer && rm -fv /usr/lib/systemd/system/elasticsearch-disable-readahead.timer && sudo run-puppet-agent'

Mentioned in SAL (#wikimedia-operations) [2021-07-19T18:27:43Z] <ryankemper> T264053 Deploying fix for timer issue on relforge: ryankemper@cumin1001:~$ sudo cumin -b 2 'P{relforge*}' 'sudo systemctl stop elasticsearch-disable-readahead.timer && sudo systemctl disable elasticsearch-disable-readahead.timer && rm -fv /etc/systemd/system/elasticsearch-disable-readahead.timer && rm -fv /usr/lib/systemd/system/elasticsearch-disable-readahead.timer && sudo run-puppet-agent'

Fix deployed. Across all of eqiad, codfw, relforge and cloudelastic, the output of systemctl list-timers looks correct and manually checking elasticsearch-disable-readahead.service shows it working properly

In my earlier comment I'd thought the fix had been applied but puppet changes hadn't been merged.

Turns out in the prior (flawed) implementation the timer will run two times total, not just once. So I thought having seen the timer run once, and seeing that systemctl list-timers showed the timer was going to run again, that it was working.

Anyway, I re-ran the above three commands to get the correct timer in place. Need to check back in an hour but they should be working properly now.