Our Hadoop workers sometimes experience disk saturation events that last even minutes. For example, let's pick an-worker1082:
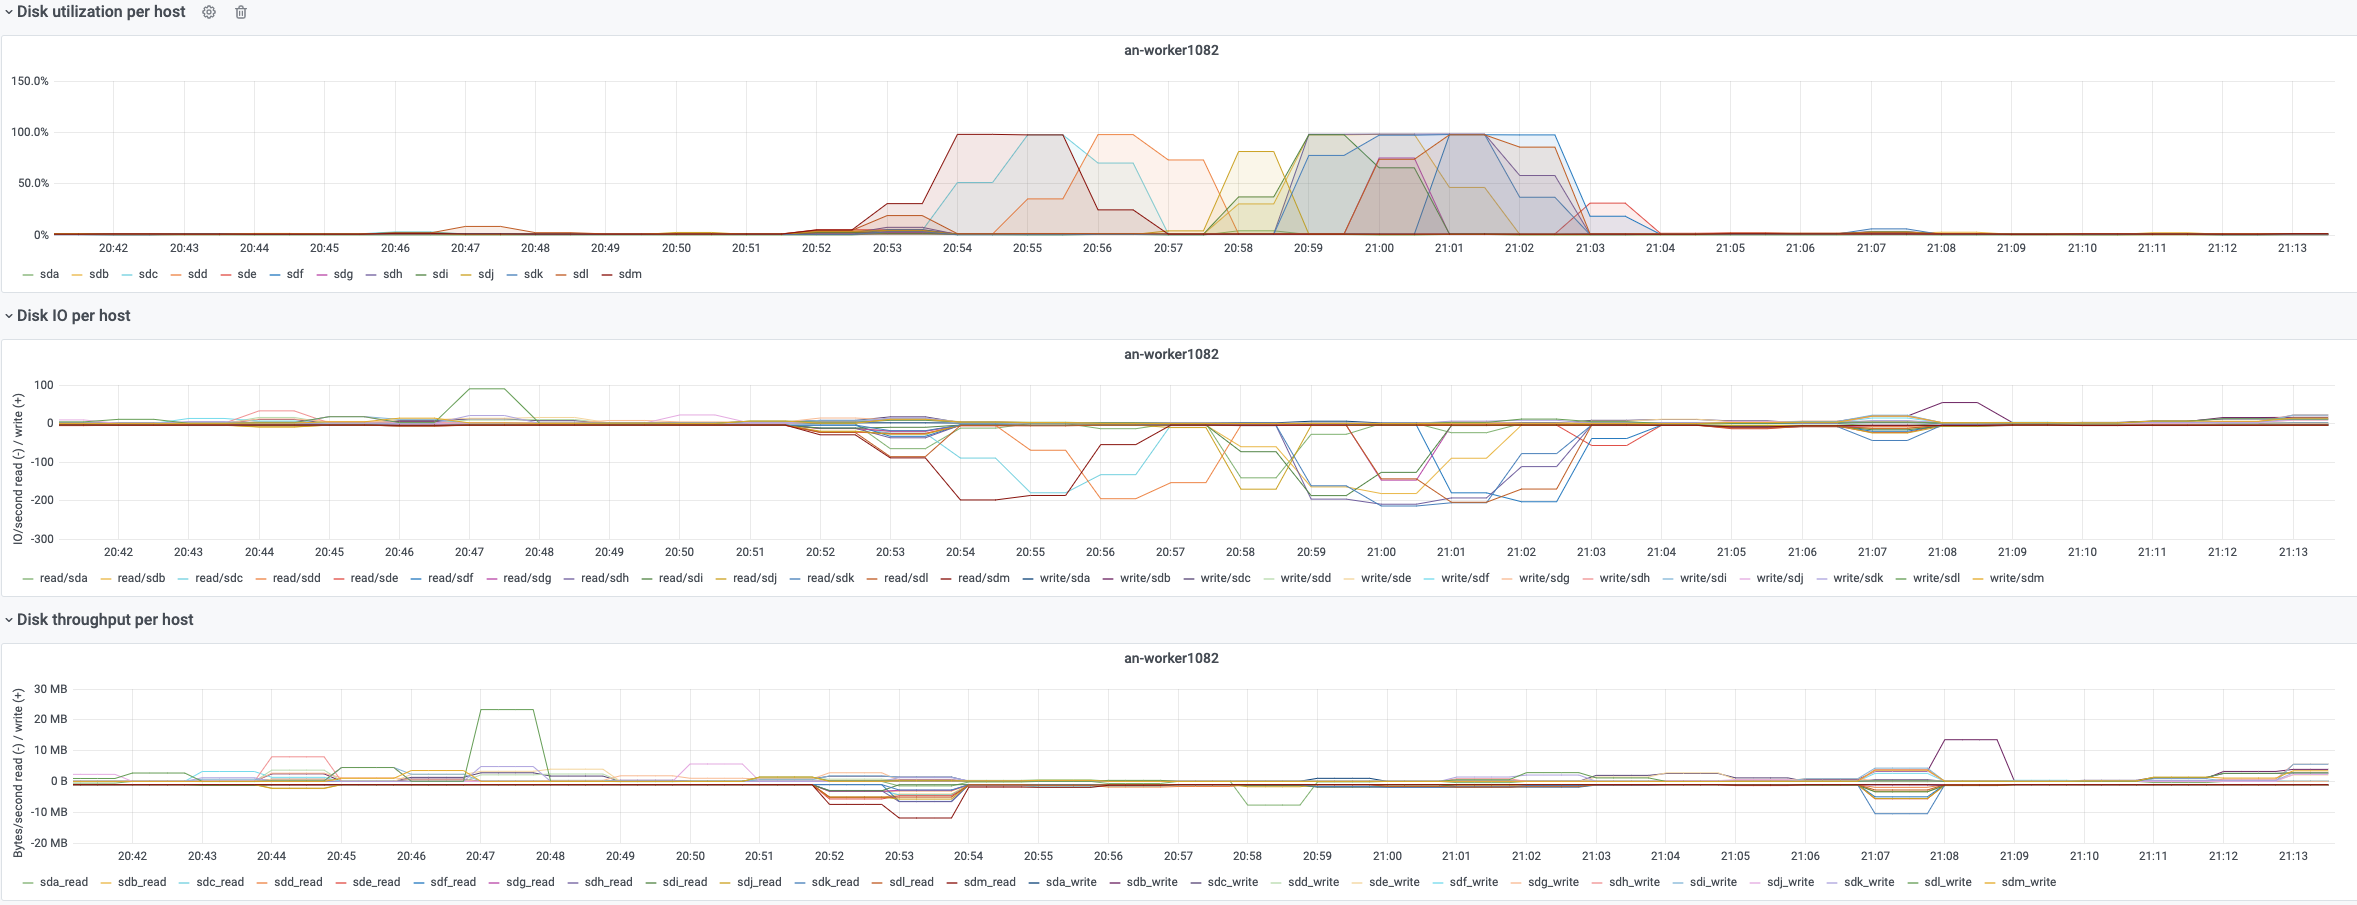
It seems happening for datanode partitions when high IOPS read load happens, that is kind of expected given the amount of data that we shuffle around. What it is not great is the fact that a disk saturates for even minutes, since there might be some bottleneck that we are hitting.
On all workers, these are the settings:
elukey@an-worker1080:~$ sudo megacli -LDPDInfo -aAll | grep "Current Cache Policy:" | uniq -c
     13 Current Cache Policy: WriteBack, ReadAdaptive, Direct, No Write Cache if Bad BBU
Due to how DELL hw raid controller works, we have all disks set as single-disk-raid-0 volume. It seems to be possible to force disks as JBOD, but the command seems a destructive action (namely the partition on top needs to be recreated).
All the options are now set via cookbook, so I added some comments in https://gerrit.wikimedia.org/r/c/operations/cookbooks/+/633941/3/cookbooks/sre/hadoop/init-hadoop-workers.py about the meaning of each option.
Checked via cumin that the settings are consistent across workers:
elukey@cumin1001:~$ sudo cumin "A:hadoop-worker" 'megacli -LDPDInfo -aAll | grep "Current Cache Policy:" | uniq -c' -b 10
69 hosts will be targeted:
an-worker[1078-1117].eqiad.wmnet,analytics[1049-1077].eqiad.wmnet
Confirm to continue [y/n]? y
===== NODE GROUP =====
(1) analytics1049.eqiad.wmnet
----- OUTPUT of 'megacli -LDPDInf...licy:" | uniq -c' -----
     13 Current Cache Policy: WriteThrough, ReadAheadNone, Direct, No Write Cache if Bad BBU
===== NODE GROUP =====
(1) analytics1057.eqiad.wmnet
----- OUTPUT of 'megacli -LDPDInf...licy:" | uniq -c' -----
     12 Current Cache Policy: WriteThrough, ReadAdaptive, Direct, No Write Cache if Bad BBU
===== NODE GROUP =====
(1) analytics1055.eqiad.wmnet
----- OUTPUT of 'megacli -LDPDInf...licy:" | uniq -c' -----
     12 Current Cache Policy: WriteBack, ReadAdaptive, Direct, No Write Cache if Bad BBU
===== NODE GROUP =====
(6) an-worker[1096-1101].eqiad.wmnet
----- OUTPUT of 'megacli -LDPDInf...licy:" | uniq -c' -----
     24 Current Cache Policy: WriteBack, ReadAdaptive, Direct, No Write Cache if Bad BBU
===== NODE GROUP =====
(60) an-worker[1078-1095,1102-1117].eqiad.wmnet,analytics[1050-1054,1056,1058-1077].eqiad.wmnet
----- OUTPUT of 'megacli -LDPDInf...licy:" | uniq -c' -----
     13 Current Cache Policy: WriteBack, ReadAdaptive, Direct, No Write Cache if Bad BBU
Disk saturated is not really a huge deal for our use case, so this task is not a high priority, but if there was some setting to test/apply to improve the performances of our disks it would be great :)