Page MenuHomePhabricator

Image Recommendations: Instrumentation Analysis
Closed, ResolvedPublic

Description

This task will start with @SNowick_WMF and possibly accrue subtasks. @JTannerWMF may add content to this task.

The insight we seek to gain through instrumentation will include:

  • How does the lack of understanding English influences the ability for someone to complete the task (via splitting out people who have English as one of the languages set in their app from the Wiki annotations on languages other than English)
  • We need to explicitly track, which source the image is coming from (Wikidata, Commons, Other Wikis), so that we understand the influence that has on accuracy.
  • We want to understand the success rate of the tutorial
  • We want to know if people like the task. A method to do so is to evaluate if users return to complete it on three distinct dates
  • We want to compare frequency of return to the task (retention) by date across user tenure and language to understand if there was more stickiness for this task by how experienced a user is and if they speak English or not
  • Of the people that got the task right, how long did it take them to submit an answer? We want to see this data to categorize if a match is easy or hard
  • We want to see if someone clicked to see more information on a task, this will help us determine the difficulty of a task
  • We want to know how often someone selects certain choices in the pop up dialog in response to No or Not Sure
  • We want to see the user name if they opt-in to showing it
  • We want to know if someone scrolled the article

Draft schema, based on the above requirements:

  • lang - Language (or list of languages, if more than one) that the user has configured in the app.
  • pageTitle - Title of the article that was suggested.
  • imageTitle - File name of the image that was suggested for the article.
  • suggestionSource - Source from which this suggestion is being made, e.g. whether the image appears in another language wiki, inside a wikidata item, etc.
  • response - The response that the user gave for this suggestion. This could be a text field, i.e. literally yes, no, unsure, or a numeric value (0, 1, 2), whichever will be simpler for data analysis.
  • reason - The justification for the user's response. Since the user may select one or more reasons for their response, this will be a comma-separated list of values that correspond to "reasons" that we will agree on (0 = "Not relevant", 1 = "Low quality", etc)
  • detailsClicked - Whether the user tapped for more information on the image (true/false).
  • infoClicked - Whether the user tapped on the "i" icon in the toolbar.
  • scrolled - Whether the user scrolled the contents of the article that are shown underneath the image suggestion (true/false).
  • timeUntilClick - Amount of time, in milliseconds, that the user spent before tapping on the Yes/No/Not sure buttons.
  • timeUntilSubmit - Amount of time, in milliseconds, that the user spent before submitting the entire response, including specifying the reasons for selecting No or Not sure.
  • userName - The wiki username of this user. May be null if the user did not agree to share.
  • teacherMode - (true/false) Whether this feature is being used by a superuser / omniscient entity.

Known test usernames

  • Rho2017
  • Cooltey5
  • SHaran (WMF)
  • Scblr
  • Scblrtest10
  • Dbrant testing
  • HeyDimpz
  • Derrellwilliams
  • Cloud atlas

Details

Due Date
Aug 12 2021, 4:00 AM

Event Timeline

JTannerWMF created this task.
JTannerWMF set Due Date to Feb 12 2021, 5:00 AM.
JTannerWMF added a project: Product-Analytics.

Per discussion w @Dbrant we are going to add a schema to specifically track Image Recommendations, would be good to meet with Miriam while planning to determine what data they are collecting through API and what data we can track that would help them with the experiment.

@SNowick_WMF @sdkim just asked about data and is the PM for the team building out the API. I will schedule some time with our group and add @schoenbaechler

JTannerWMF lowered the priority of this task from Medium to Low.Feb 11 2021, 5:17 PM

Marking this as low until we Robin finish designs

JTannerWMF raised the priority of this task from Low to Medium.Feb 23 2021, 1:30 PM

Ok @schoenbaechler is finishing up the designs so I am increasing the priority of this. After the offsite it should increase to high.

JTannerWMF changed Due Date from Feb 12 2021, 5:00 AM to Mar 12 2021, 5:00 AM.Feb 23 2021, 1:31 PM

Here's my current "draft" of what the schema could look like:
(Once again, the idea is that whenever the user submits a single Image Recommendation item, we send an event to a new Eventlogging table that we'll use for this experiment.)

  • lang - Language of the user, i.e. the language wiki that they've set the app to.
  • pageTitle - Title of the article that was suggested.
  • imageTitle - File name of the image that was suggested for the article.
  • response - The response that the user gave for this suggestion. This could be a text field, i.e. literally yes, no, unsure, or a numeric value (0, 1, 2), whichever will be simpler for data analysis.
  • reason - The justification for the user's response. Since the user may select one or more reasons for their response, this will be a comma-separated list of values that correspond to "reasons" that we will agree on (0 = "Not relevant", 1 = "Low quality", etc)
  • detailsClicked - Whether the user tapped for more information on the image (true/false).
  • scrolled - Whether the user scrolled the contents of the article that are shown underneath the image suggestion (true/false).
  • timeSpent - Amount of time, in seconds, that the user spent looking at this suggestion before submitting a response.
  • userName - The wiki username of this user. May be null if the user did not agree to share.
  • teacherMode - (true/false) Whether this feature is being used by a superuser / omniscient entity.
JTannerWMF updated the task description. (Show Details)

Hey @Dbrant we got the following questions about the above schema:

  • Is instrumentation related to the editor tenure missing in the draft scheme because it will be found in existing instrumentation or via username?
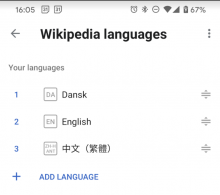
  • Is the lang identifying all the different languages the app is set to, or only the 1st app language or device language? For example, someone might speak Danish natively and have that set as the primary language, but also may have added English and Chinese as additional languages?

image (2).png (648×728 px, 72 KB)

@JTannerWMF asked me to review this plan. Here are my notes:

  • I think we should capture the experience level of the user, even if we don't capture their username. I think the best thing would just be their edit count.
  • For users whose usernames we cannot capture, can we capture some unique identifier for them, so we can analyze their submissions together?
  • Similarly to the comment above, it would be good to know what other languages the user users, beyond the one they are using for image recommendations.
  • Although the schema is "one event per submission", there are some things we'll want to study that are not associated with submissions:
    • How far the user makes it through the onboarding screens before they get to the first suggestion.
    • How far the user makes it through the onboarding tips before they are reviewing the first suggestion.
    • Whether the user taps the "i" icon in the upper right of the screen.
  • I see that the schema will capture the time the user spent on the task. Will this time complete once they tap yes/no/unsure? Or when they are finished submitting the reason? I recommend the former, as the time spent to make a decision.
  • Although the schema captures time spent, I think it could be good to also capture timestamps for the events.
  • My understanding is that we are asking for a reason for every "no" response, but not for every unsure response. In that case, I think we need to capture whether someone received the reason question, because we won't be able to infer for the unsure responses whether the user received the question and declined to answer, or didn't receive the question.
  • In addition to article title and filename, I think we might also want to record which image metadata fields were available for the image, because we want to understand how the presence of metadata influences responses. Though I suppose we could go get it from Commons after the fact, that might be difficult, and the file's metadata might change between the event and the analysis.
  • When the users scroll into the article, will they be able to click wikilinks or images, like in the normal reading experience? Will that lead them away from the task? If so, I think we should record an event for when that happens, so we know how often the article itself distracts people from doing the tasks.

@JTannerWMF

Is instrumentation related to the editor tenure missing in the draft scheme because it will be found in existing instrumentation or via username?

By editor tenure do we mean edit count? And if so, on which wiki? Do we mean the language wiki for which the suggestions are being made? Or across all language wikis that the user has configured? Or are we including edits made to Wikidata and Commons, via suggested edits? Not all these numbers are available to the app client-side. I would recommend determining editor tenure during data analysis, based on the user name. Also, if we include the "total edit count" in our event schema, would that border on personally-identifiable information (if the user chose not to share their username)?

Is the lang identifying all the different languages the app is set to, or only the 1st app language or device language? For example, someone might speak Danish natively and have that set as the primary language, but also may have added English and Chinese as additional languages?

Sure, we can update the lang field to be a list of all language(s) the user has configured in the app.


@MMiller_WMF

I think we should capture the experience level of the user, even if we don't capture their username. I think the best thing would just be their edit count.

See response to Jazmin's question above.

For users whose usernames we cannot capture, can we capture some unique identifier for them, so we can analyze their submissions together?

Done implicitly.

Similarly to the comment above, it would be good to know what other languages the user users, beyond the one they are using for image recommendations.

👍

How far the user makes it through the onboarding screens before they get to the first suggestion.
How far the user makes it through the onboarding tips before they are reviewing the first suggestion.

If we receive one of these events from a user, then they have by definition made it past onboarding (i.e. the onboarding is all-or-nothing). If we want to track if a user made it part-way through onboarding, and then gave up without doing a single recommendation, we would need a different separate schema.

Whether the user taps the "i" icon in the upper right of the screen.

👍

I see that the schema will capture the time the user spent on the task. Will this time complete once they tap yes/no/unsure? Or when they are finished submitting the reason? I recommend the former, as the time spent to make a decision.

¿Por que no los dos?

Although the schema captures time spent, I think it could be good to also capture timestamps for the events.

Done implicitly.

My understanding is that we are asking for a reason for every "no" response, but not for every unsure response. In that case, I think we need to capture whether someone received the reason question, because we won't be able to infer for the unsure responses whether the user received the question and declined to answer, or didn't receive the question.

What is meant by "declined to answer"? I don't think we have that as an option in our workflow.

In addition to article title and filename, I think we might also want to record which image metadata fields were available for the image, because we want to understand how the presence of metadata influences responses. Though I suppose we could go get it from Commons after the fact, that might be difficult, and the file's metadata might change between the event and the analysis.

👍

When the users scroll into the article, will they be able to click wikilinks or images, like in the normal reading experience? Will that lead them away from the task? If so, I think we should record an event for when that happens, so we know how often the article itself distracts people from doing the tasks.

The article is shown as plain text only, with no clickable links.

@SNowick_WMF

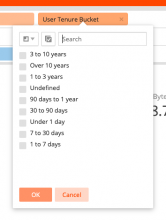
Editing Tenure is a bucket in Turnilo, not sure how we are recording that information.

In order for us to know the tenure of those completing the task so that we can look for trends, do we have to record usernames? Is there a precedent for this?

Schema:MobileWikiAppImageRecommendations

@JTannerWMF we can get user age from event.MobileWikiAppDailyStats using app_install_id

JTannerWMF renamed this task from Image Recommendations: Instrumentation to Image Recommendations: Instrumentation Analysis .Apr 19 2021, 6:38 PM

Data QA Results:
Every event contains value data as expected for fields. The repeat pages/images for different users is working as well.
For field reason we need value definition, values shown are 0, 1, 4 and one result with multiple reason codes 0,1

@Sharvaniharan let's discuss the following:

  • Need to verify a multiple value answer for reason is expected.
  • Need definitions for reason codes
  • reason has empty value when not needed, consider populating value with NULL rather than leaving blank. Note: Not necessary, no change needed.

Link to data spreadsheet

Populated event fields:
lang
page_title
image_title
suggestion_source
response
reason
details_clicked
info_clicked
scrolled
time_until_click
time_until_submit
user_name
teacher_mode

@SNowick_WMF Thank you for looking into this... That sounds correct.

Need to verify a multiple value answer for reason is expected.

Yes, this happens when user chooses more than one reason for selecting 'No' or 'Not sure' on the screen, meaning that they think the recommendation does not match the article. They are allowed to choose more than one reason for the same.

Need definitions for reason codes

Definition:
When they choose "No"
0 - "Not relevant"
1 - "Not enough information
2 - "offensive"
3 - "Low quality"
4 - "Don't know this subject"
5 - "Cannot read the language
6 - "Other"

When they choose "Not sure"
0 - "Not enough information"
1 - "Can't see image"
2 - "Don't know this subject"
3 - "Don't understand the task"
4 - "Cannot read the language"
5 - "Other"

reason has empty value when not needed, consider populating value with NULL rather than leaving blank.

Will make a PR for this. I am assuming a value of null, and not "NULL". please lmk if that is correct. - Also how important is it this?

Just an update from our offline discussion @SNowick_WMF . We will continue to send a blank value for 'reason' when 'Yes' is chosen, as it is more convenient from app side, and it is ok by you. Thank you for the flexibility!

In case anyone is using Superset to query, use the query below to get the event struct results separated into columns and to isolate results to production app version.

SELECT
DATE(SUBSTRING(dt,1,10)) as date,
useragent,
event.lang as lang,
event.page_title as page_title,
event.image_title as image_title,
event.suggestion_source as suggestion_source,
event.response as response,
event.reason as reason,
event.details_clicked as details_clicked,
event.info_clicked as info_clicked,
event.scrolled as scrolled,
event.time_until_click as time_until_click,
event.time_until_submit as time_until_submit,
event.user_name as user_name,
event.teacher_mode as teacher_mode,
event.app_install_id as app_install_id,
event.client_dt as client_dt,
geocoded_data
FROM event.mobilewikiappimagerecommendations
WHERE regexp_like(useragent.wmf_app_version, '-r')
AND YEAR =2021 AND MONTH >= 5 AND DAY >= 01
AND NOT regexp_like(ir.event.user_name, 'Rho2017|Cooltey5|SHaran (WMF)|Scblr|Scblrtest10|Dbrant|Dbrant testing|HeyDimpz|Derrellwilliams|Cloud atlas')

I made a dashboard in Superset for tracking purposes that shows daily total images, unique images and unique users and a daily average image count/per unique user. Let me know if there are other metrics you would like added to the dashboard. (Internal test users have been eliminated from query results).

@SNowick_WMF -- thank you for making this dashboard. Does "total images" mean the number of image matches considered by users? i.e. does it count "yes", "no", and "skip"? Or something else?

@MMiller_WMF On the first chart 'total images' is count of all images shown to users. I added another chart to show count of responses daily. I can also add charts of reasons for 'no' and 'not sure' responses if that would be useful, let me know.

Thanks for adding that additional chart, @SNowick_WMF. It's really cool to see that the rate of "Yes" annotations is roughly in line with what we expect the algorithm's accuracy to be (50-70%).

If you're able, these are the other graphs that I would really love to see on the dashboard (@JTannerWMF said I could ask). If you prefer to wait to talk about these numbers until our meeting next week, I understand. @JTannerWMF please feel free to veto:

  • A "total" version for the top graph, i.e. a set of bars showing how many total images, how many unique images, and and how many unique users since deployment. It would be especially enriching to see this broken out by language wiki, so we know the penetration into non-English languages.
  • The number of images for which we have three annotations. Or better yet, the distribution of how many images have 1, 2, 3, 4, etc. annotations.
  • How many users are doing this task on multiple days, i.e. 2 days, 3 days, etc.

@MMiller_WMF I added a User Language chart and a Suggestion Source chart based on questions from our engineers (started before I saw your comments). I can add these requested metrics as well (I may just pull counts rather than make charts depending on results). Will post here when ready.

  • Added a Superset chart for Images by Wiki/Language Source
  • Repeat annotations

Presently Superset is being troublesome with timing out charts, I will add a chart for this later so they it updates automatically.
Spreadsheet

Images w Multiple Annotations# of Annotations
17812
5863
1734
595
256
117
158
69
1810-20
1121-45
2100+
  • Repeat Users:
Days Re-VisitedCount Users
1 Day1367
2 Days91
3 Days25
4 Days5
5 Days5
6 Days1
8 Days1

This is better expressed as retention:

RetentionPercent Users Retained
1 Day8.5%
3 Day3.9%
7 Day0.3%
RHo awarded a token.

@RHo Just ran a quick query to get an idea of user languages - of the unique users in the table 1831 have English in their language settings, (1509 have English only), 511 unique users do not have English. Will separate user responses/reasons by this dimension (using INSTR(event.lang, 'en') > 0 or NOT INSTR(event.lang, 'en') > 0 in queries) when I resume analysis after this week.

@SNowick_WMF -- I have a couple of requests for data:

  • Could you please provide a refresh of the data you posted in this comment above?
  • In the call last week, you mentioned that some of the stats for the images task were surpassing comparable stats for the other types of Android suggested edits -- things like edits done per day, edits per user, retention rate, and I'm not sure what else. Would you be able to post that comparison? I'm thinking of a table showing, for each edit type, a series of comparable statistics, so we can see how the images task does and does not deviate from the other tasks. Or maybe you have a dashboard that already does this?

Spreadsheet with first pass user edit counts data. Because we are using mediawiki_history the data is limited to prior to 2021-04-31. Queries are in spreadsheet as well. Some query results are platform (Hue, Superset) dependent and noted in spreadsheet.

@MMiller_WMF this deck has comparison data for Android, iOS and Mobile Web users/editor data from last quarter, for reference. Will update data and post comparisons here when ready.

@MMiller_WMF Until we have an updated wikimedia_history dataset for 2021-05 doing a comparison of edits by platform and type would be incomplete.

Updated Image Annotation Counts (Data as of 2021-05-25)

Images w Multiple Annotations# of Annotations
28562
12583
7014
4115
1966
757
368
279
6510-20
1621-45
2100+

Note: See Image Annotation Count by Article counts, multiple images appear in multiple articles.

Image Rec Users Retention:

days.retaineduser countretention.rate
12719.1%
31715.7%
7903.0%
14170.57%

Editor Retention Rates Compared

Days Retained13714
Android Image Rec Users9.1%5.7%3.0%0.57%
Android15.37%11.93%9.97%8.04%
iOS15.88%13.40%11.81%10.04%
Mobile Web12.03%9.59%7.44%5.08%

Thanks for all this info, @SNowick_WMF! Like you and I were chatting about today, I have these notes for analysis either when you have time in the coming week, or for the final report:

  • It's really valuable to compare the "image recs" task with the other suggested edits in an apples-to-apples way. You gave me counts of how many tasks are done each day by type, and I just want to note that it's something we should include in the final report.
  • Something new that would be useful are these numbers side-by-side for each task type:
    • Retention rates (1 day, 3 day, 7 day, 14 day)
    • Average tasks per day per user (like in the graph you made called "Android Avg Images per Unique User")

The Due Date set for this open task is more than two months ago. Can you please either update or reset the Due Date (by clicking Edit Task), or set the status of this task to resolved in case this task is done? Thanks.

SNowick_WMF changed Due Date from Mar 12 2021, 5:00 AM to Aug 12 2021, 4:00 AM.Jun 1 2021, 11:10 PM

@MMiller_WMF
Based on Android Suggested Edit data from Q3 2021, using Logged In editors, here are stats broken out by edit type:

Editor Retention Rates

Edit Type1 Day3 Day7 Day14 Day
desc add31.1%26.8%22.5%17.8%
desc change33.6%29.6%26.6%21.0%
img caption add20.5%17.2%14%11.1%
img tag add18.1%14.5%10.8%8.5%
desc translate33.2%25.3%19.0%12.7%
img caption translate17.8%11.9%9.2%8.0%
Suggested_edit_typePercent of All SE editsAverage Daily Edits per User
desc add41.9%5.5
desc change13.2%2.2
img caption add12.7%3.2
img tag add11.1%4.6
desc translate9.9%11.6
img caption translate1.1%3.7
(NA9.7% )

Thanks for posting these, @SNowick_WMF. I'm trying to compare these to the image recs numbers you posted in T273057#7121258, and they're so different that I just want to double check.

For image recs, we had this:

Days Retained13714
Android Image Rec Users9.1%5.7%3.0%0.57%

So putting that in the table you posted above, it would be like this:

Edit Type1 Day3 Day7 Day14 Day
desc add31.1%26.8%22.5%17.8%
desc change33.6%29.6%26.6%21.0%
img caption add20.5%17.2%14%11.1%
img tag add18.1%14.5%10.8%8.5%
desc translate33.2%25.3%19.0%12.7%
img caption translate17.8%11.9%9.2%8.0%
Android Image Rec Users9.1%5.7%3.0%0.57%

So it looks like image recs has way lower retention to it than the other tasks do. Does that seem right? I want to make sure this is apples-to-apples. One thing I was thinking about with respect to apples-to-apples is whether the retention numbers for the other tasks should be isolated just to the tasks done from the feed, as opposed to the ones discovered in the article reading experience.

Thank you, and let me know what you think!

@MMiller_WMF The retention for Image Rec users does seem lower but my first guess why would be because the numbers reported for Android edits are average retention over a 3 month period, so there is a bigger sample to capture return visits over time. Also the earlier reported retention rates were for ALL Android edits, not isolated to Logged In, which would generally make them lower.

I can isolate the time period to match the time the Image Rec feature has been live next time we run comparison. There may be less retention because it's a smaller task - we have some questions that we plan to answer at the end of the experiment that may give more insight.

You may be right that there is a difference between tasks done from feed and tasks done from article reading, We have a table where we track edits by source (page, SuggestedEdit and gallery for image edits) so that is something I can divide by, but that table doesn't have a edit type distinctions so it won't be exact.

It's my understanding that we are close to winding down the Image Rec project - I can pull the edit-by-source data, does it make sense to work on the retention rates when the experiment is done?

As of 2021-06-03 we have 3815 images with 3 or more annotations (placeholder images are excluded from this count) see spreadsheet . Please let me know stop date for experiment so I can begin answering topline questions about user engagement.

Data collected thus far:
Image Recommendation Counts by Image Up-to-date as of 2021-06-03

Image Recommendation User Language Settings Up-to-date as of 2021-06-01

Image Recommendation User Edit History updated with mediawiki_history data from 2021-05. Includes User by Age table. Up-to-date as of 2021-06-03

Android Image Rec Reason/Responses - needs to be updated post experiment.

SNowick_WMF raised the priority of this task from Medium to High.Jun 8 2021, 5:05 PM
SNowick_WMF moved this task from Upcoming Quarter to Kanban on the Product-Analytics board.
SNowick_WMF moved this task from Next 2 weeks to Doing on the Product-Analytics (Kanban) board.
SNowick_WMF lowered the priority of this task from High to Medium.Jun 29 2021, 5:06 PM
SNowick_WMF moved this task from Doing to Needs Review on the Product-Analytics (Kanban) board.

Note for item : We want to see the user name if they opt-in to showing it

There were no NULL values for user_name field in the dataset which would indicate that no users opted-out of sharing their name or the functionality of opting out did not actually block user name from tracking. Going forward we should add tracking or flag users explicitly if they opt out of sharing.