Page MenuHomePhabricator

Estimate the number of images added to each Wiki in a month
Closed, ResolvedPublic

Description

The image matching algorithm generates lists of unillustrated articles based on the mediawiki_imagelinks table, which contains monthly snapshots of the imagelinks table from the SQL replicas.

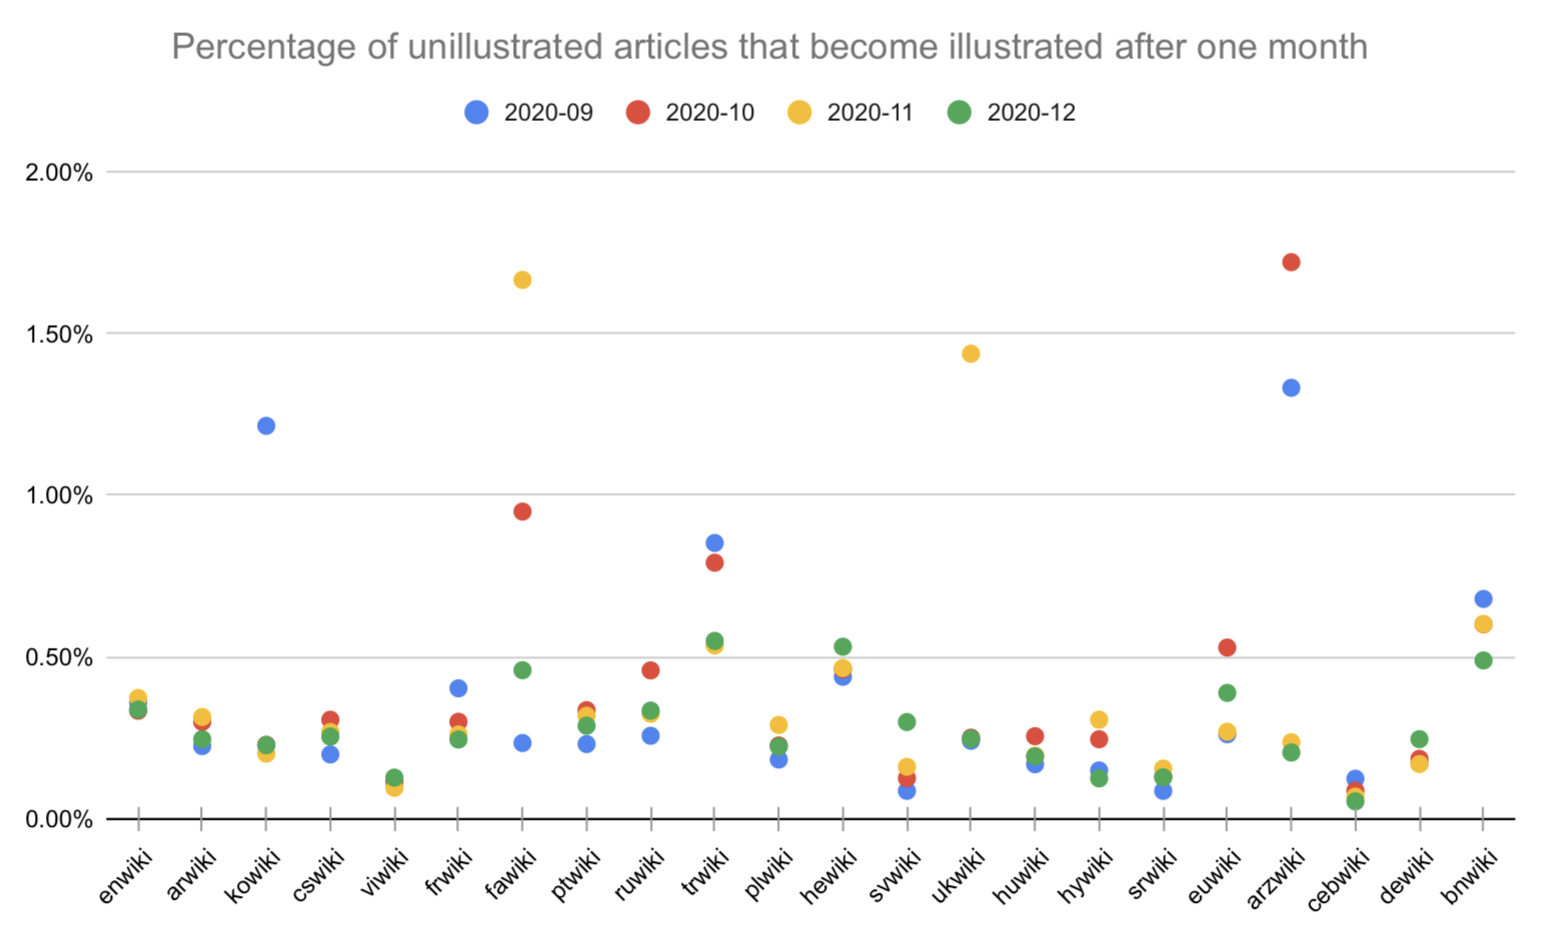
While this approach is efficient, we might actually end up recommending images for articles that have been recently illustrated, i.e. where someone has added an image after the current snapshot date (beginning of the month) and before the next snapshot date (end of the month). To understand the limitations of this approach, we would like to estimate the rough number of unillustrated articles that get illustrated in a month.

To do so, we can compute the set of unillustrated articles for a snapshot of mediawiki_imagelinks (e.g., July 2020), then calculate the percentage of those articles which are still unillustrated in the following snapshot (e.g. August 2020). We can then repeat this for different snapshots and average the results. This will give us an estimate of the percentage of unillustrated articles that are still unillustrated after one month.

Let's use the same Wikis as in T272109.

Event Timeline

Hi @MMiller_WMF @gmodena

Here are estimates of the percentage of unillustrated articles that become illustrated after one month for each target wikis.

For example, in the following table, the number 0.36% in the first column of enwiki can be interpreted as there were about 0.36% of unillustrated articles in September that someone add an image in October (next month).

2020-092020-102020-112020-12
enwiki0.36%0.33%0.37%0.34%
arwiki0.22%0.30%0.31%0.24%
kowiki1.21%0.23%0.20%0.23%
cswiki0.20%0.31%0.27%0.25%
viwiki0.11%0.12%0.09%0.13%
frwiki0.40%0.30%0.26%0.24%
fawiki0.23%0.95%1.67%0.46%
ptwiki0.23%0.33%0.32%0.29%
ruwiki0.26%0.46%0.32%0.33%
trwiki0.85%0.79%0.54%0.55%
plwiki0.18%0.23%0.29%0.22%
hewiki0.44%0.46%0.46%0.53%
svwiki0.08%0.12%0.16%0.30%
ukwiki0.24%0.25%1.44%0.25%
huwiki0.17%0.25%0.19%0.19%
hywiki0.15%0.24%0.31%0.12%
srwiki0.08%0.13%0.15%0.13%
euwiki0.26%0.53%0.27%0.39%
arzwiki1.33%1.72%0.24%0.20%
cebwiki0.12%0.09%0.07%0.05%
dewiki0.17%0.18%0.17%0.25%
bnwiki0.68%0.60%0.60%0.49%

Overall, the percentages range between 0.05% and 2%. For those higher percentage (bold text in the table) in certain month and wiki, it might because the local communities hosted events to encourage users adding a image on unillustrated pages (like WPWP campaign?).

Also, a scatter plot shows the result:

C8D7FCEB-3155-4672-86E4-4A2343A7439D.jpeg (936×1 px, 212 KB)

Please let me know if there is anything you would like me to add or modify. Thanks! :)

@Miriam @AikoChou -- thanks for proactively looking into this! I think this will be a useful thing to know. What do you think about looking at the percentage of unillustrated articles for which the algorithm has a recommendation that get illustrated the following month? That number may well be much higher, since the existing analysis includes all the articles that have little chance of being illustrated (and also would not be part of the feed we offer to users). What do you think?

@MMiller_WMF -- here are the results computed using unillustrated articles for which the algorithm has at least one recommendation. Since illustrated articles for February are available to query, I added results for January. Most of them fall within the range of 0.1% ~ 8%. There are two very high numbers 21.46% and 31.62% in arzwiki (In previous results, these two months also have relatively high percentages). A scatter plot is shown below that excludes the two outliers, showing the distribution for most wikis.

2020-092020-102020-112020-122021-01
enwiki2.15%1.82%1.76%1.57%1.19%
arwiki1.47%2.40%2.06%1.68%1.71%
kowiki6.23%0.76%0.69%0.78%5.05%
cswiki0.59%0.97%0.70%0.76%0.53%
viwiki0.66%0.75%0.61%0.62%0.66%
frwiki1.51%1.46%1.32%1.13%0.73%
fawiki0.61%4.61%3.63%0.88%0.77%
ptwiki0.62%1.02%0.74%0.60%0.54%
ruwiki0.94%2.19%1.38%1.26%0.84%
trwiki1.99%1.80%1.23%0.84%7.22%
plwiki0.82%1.28%1.18%0.93%0.89%
hewiki1.11%1.32%1.22%1.30%0.94%
svwiki1.07%1.82%2.07%1.30%0.67%
ukwiki0.89%0.85%2.04%0.80%0.65%
huwiki0.80%1.19%0.78%0.73%0.81%
hywiki0.55%0.95%1.41%0.58%1.77%
srwiki0.17%0.28%0.34%0.25%0.35%
euwiki1.17%2.50%1.02%1.45%0.77%
arzwiki21.46%31.62%4.61%3.89%2.39%
cebwiki2.25%1.69%0.64%0.97%0.34%
dewiki0.77%0.95%0.76%0.92%0.54%
bnwiki1.64%1.70%3.21%3.86%4.94%

result.png (728×1 px, 148 KB)

Thank you @AikoChou. It looks to me that for most wikis, this is around 1%, but can be up to 3% on some wikis. This will help us prioritize how gracefully we need to handle image collisions that occur from activity outside of our structured task.