Page MenuHomePhabricator

Investigate really high in First Visual Change on Android Chrome
Closed, ResolvedPublic

Description

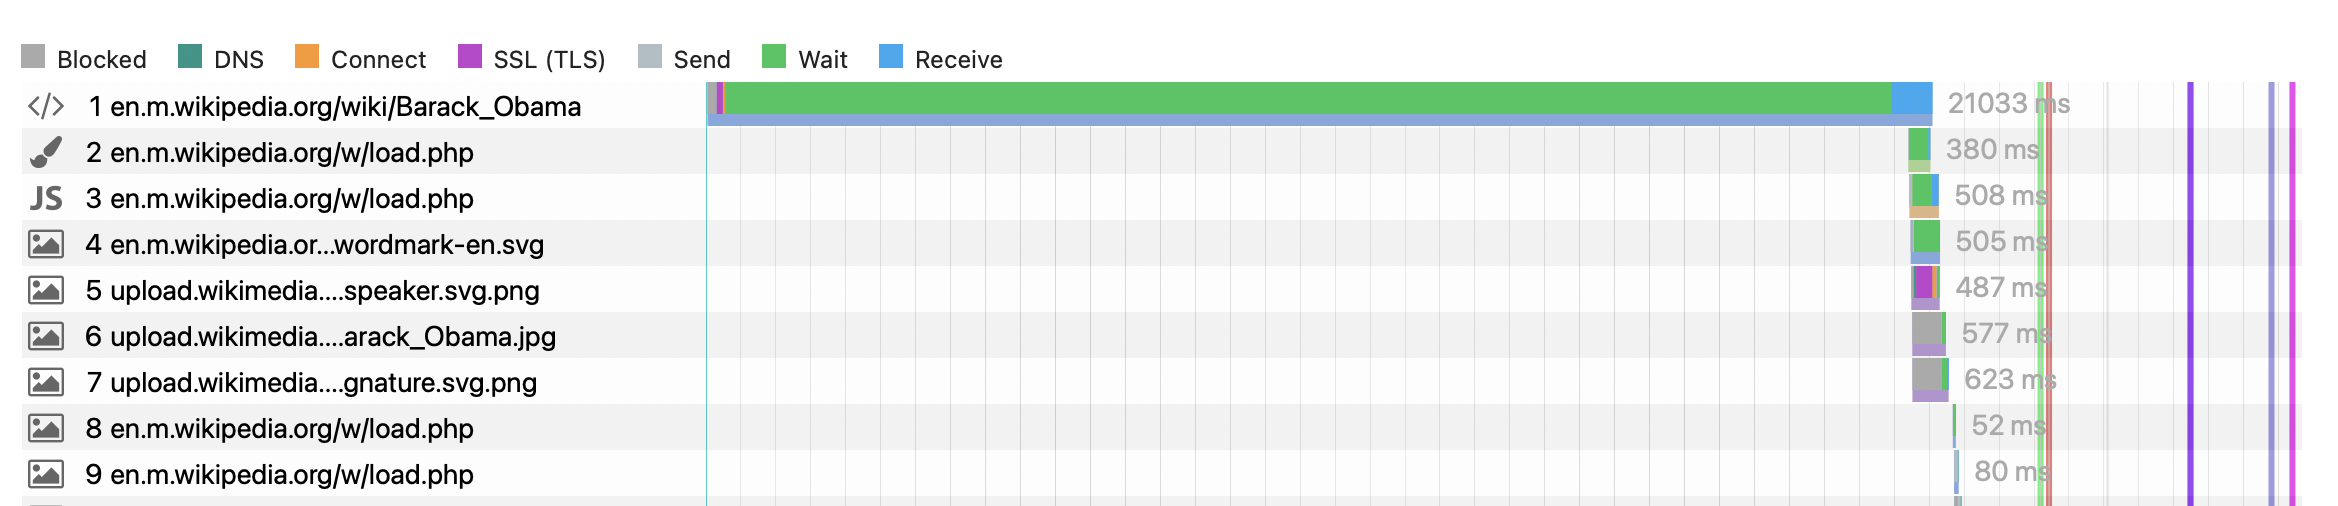
I've been looking into the high First Visual change we sometimes have on both Kobiton and Bitbar. This is an example of FirstVisualChange on Obama, looking at the max value:

high-fvc.png (1×1 px, 1 MB)

They all have a really long download time of the HTML:

Screenshot 2021-03-19 at 05.59.40.png (506×2 px, 614 KB)

All except the first one has one of the following cache headers:

cp1089 miss, cp1075 miss
x-cache-status:miss
x-cachecp1089 hit, cp1075 miss
x-cache-status: hit-local
x-cachecp1079 miss, cp1075 pass
x-cache-status:pass

@Gilles I understand pass/miss pass on it to the backend but what do hit-local means?

Many of them (but not all) is the first hit, so a pre-cache request would solve that for the synthetic testing. Let me dig into the rest of the URLs we test and I wonder how often this happens for real users too?

Event Timeline

I'm gonna roll out a "pre-test" request later today on both bitbar/kobiton and then we can if they go away after this weekend.

hit-local just means that the object was found in a cache backend in the same datacenter.

x-cache headers are read backwards

x-cache: cp1089 miss, cp1075 miss

Means that the frontend, cp1075, was tried first and it was a miss. Then the backend, cp1089, was tried and was also a miss. This request was served by whatever is behind (MediaWiki, Thumbor, etc.).

x-cache: cp1089 hit, cp1075 miss

Miss on the frontend, cp1075, followed by a hit on the backend in the same datacenter, cp1089.

x-cache: cp1079 miss, cp1075 pass
x-cache-status: pass

Pass on the frontend, cp1075. Which is probably a sign of an object that's considered too big to cache on the frontend (or will never be cached on the frontend for another reason, but the size limit is the most common one). Then a miss on the backend, cp1079. This request was served by whatever is behind (MediaWiki, Thumbor, etc.).

The Barack Obama article being notoriously large, it might indeed take 15-20 seconds to parse it. Maybe it's being purged excessively? If we have a script somewhere that calls ?action=purge on it frequently, it would result in this slow experience for the next pageview.

At the bottom of the HTML there is some JS that has parsing metadata, this is how you can check when the HTML was last parsed:

"cachereport":{"origin":"mw1267","timestamp":"20210319101416","ttl":86400,"transientcontent":true}

In my case this seems to have happened during my first (logged-in) pageload. Since the last edit for that article for that page was yesterday, this suggests that the article was purged, which includes deleting its parser cache entry.

Given how extensively we've used that article for testing, I wouldn't be surprised if we have a job somewhere, in WebPageTest or something, that calls ?action=purge on that page regularly.

Change 673477 had a related patch set uploaded (by Phedenskog; owner: Peter Hedenskog):
[performance/mobile-synthetic-monitoring-tests@master] Add preWarmServer config to add a request before testing.

https://gerrit.wikimedia.org/r/673477

@Gilles argh you are right. I've added a crontab job that do that purge once an hour. I added that because of the problem we had with miss-matched content, to be sure we test the correct version.

A warmup request before the test will do the trick, you can keep purging and get the best of both worlds.

It was done in T263859. We do the purge, sleep one second and then access the article again. So we have a 15-20 s gap then per hour where we can get the none cached version. I checked the timings of the 8 top max values the last 7 days and 3 of them match that purging.

Yep I added that now for Kobiton. I could see though that when we do 11 runs, it not always the first that is the un-cached one.

Purge requests aren't always instantaneous, they go through a queue. At different times of day the purge queue is more or less busy. You also have to remember that if you have one of your synthetic test platforms purging the article, it will affect them all. So beware of test batches that might run concurrently on Kobiton and on AWS, etc. for the same article when purging is involved.

To be more precise, it's the propagation of the purge to the various frontend caches we have that can take time. The parser cache is probably nuked at the time you call action=purge, but it might take time for Varnish/ATS to pick up on the purge and not served you their previously cached copy anymore.

And for this article, since parsing takes 25 seconds or more, while an earlier request than yours post-purge might have triggered the parsing, your request will be waiting on a PoolCounter lock until the parsing is done.

So you probably want to increase the post-purge sleep time significantly if you want to make sure that the request after the purge gets the new content. Even more so if you don't want it to catch the re-parsing duration.

I'v turned off the purging this morning to get see how much impact it has. As I said 3/7 looks to be caused by that it's nice to know for sure. It's nice to see what kind of real impact it has for users. It seems that this seems more common or show more for our mobile tests but I wanna look it. At least for me if a web site takes over 10 s load I abort, so I wonder if we miss this in our RUM data.

All these was caused by the purging. I disabled the purging for now.

Change 673477 abandoned by Phedenskog:

[performance/mobile-synthetic-monitoring-tests@master] Add preWarmServer config to add a request before testing.

Reason:

Since we do not run these tests anymore we can close this issue.

https://gerrit.wikimedia.org/r/673477