Page MenuHomePhabricator

Wikisource Export: determine how changes in activity may coordinate with our releases
Closed, ResolvedPublic3 Estimated Story Points

Description

As a product manager, I want to know how fluctuations in user & programmatic activity corresponded to our releases to WS Export, so I can better understand our impact over time.

Relevant documents:

Acceptance Criteria:

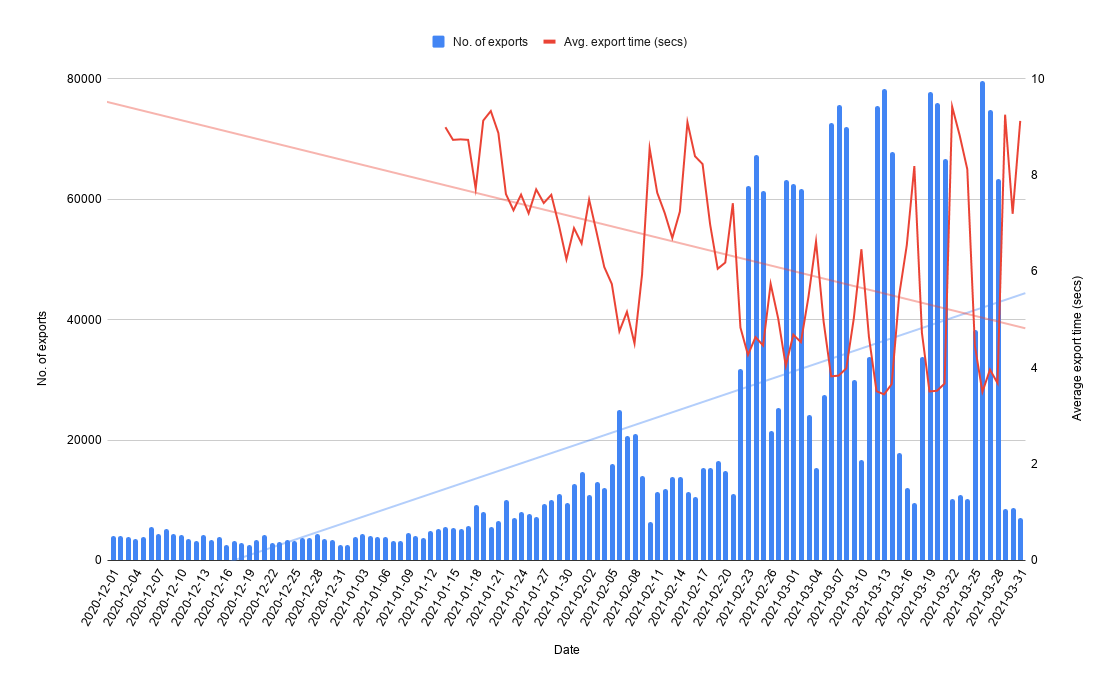
  • Provide timeline, chart, or list that maps two tracks:
    • #1: times of dramatic changes found in WS Export activity since project launch (i.e., when first code changes released)
    • #2: times of code changes released (and please specify what changes were made in each release)

Notable Changes

  • Blocking bots (July 21 / Oct 14 2020, and Jan 18 / March 29, 2021)
  • Symfony migration (Nov 16, 2020)
  • Moving to Parsoid API (Dec 15, 2020)
  • Move download links from gadgets to Wikisource Ext (Jan 12-13, 2021)
  • Download Button (Feb 16)
  • Replace Electron PDF with WS-Export (Feb 16)
  • Caching http requests (Feb 17)
  • Remove phetools dependency (Mar 11)

Event Timeline

ifried updated the task description. (Show Details)
ARamirez_WMF set the point value for this task to 3.Mar 25 2021, 5:30 PM
ifried renamed this task from Wikisource Export: determine how changes in activity may coordinate with our releases to Wikisource Export: determine how changes in activity may coordinate with our releases - HIGH PRIORITY.Mar 25 2021, 5:39 PM
ifried moved this task from Up Next to Kanban-2020-21-Q3 on the Community-Tech board.
ifried renamed this task from Wikisource Export: determine how changes in activity may coordinate with our releases - HIGH PRIORITY to Wikisource Export: determine how changes in activity may coordinate with our releases.Mar 30 2021, 11:06 PM

Blocking bots (July 21 / Oct 14 2020, and Jan 18 / March 29, 2021)

The bots blocked on July 21, 2020 may have made a noticeable difference, as we saw a ~30% decrease in exports:

DateNumber of exports
2020-07-183158
2020-07-193071
2020-07-202908
2020-07-212003
2020-07-222174
2020-07-232086
2020-07-241956

Data

Here's a daily report of number of exports since December 1, 2020, with average export times starting January 14:

MariaDB [s52561__wsexport_p]> SELECT DATE(time), COUNT(id), AVG(duration) FROM books_generated WHERE YEAR(time) = 2021 OR (YEAR(time) = 2020 AND MONTH(time) = 12) GROUP BY DATE(time);

DateNumber of exportsAvg export time (secs)Notable changes
2020-12-014123
2020-12-024126
2020-12-033827
2020-12-043625
2020-12-053819
2020-12-065592
2020-12-074439
2020-12-085196
2020-12-094477
2020-12-104243
2020-12-113620
2020-12-123285
2020-12-134286
2020-12-143346
2020-12-153823Move to Parsoid API
2020-12-162581
2020-12-173251
2020-12-182974
2020-12-192530
2020-12-203377
2020-12-214202
2020-12-222957
2020-12-233033
2020-12-243319
2020-12-253198
2020-12-263781
2020-12-273666
2020-12-284468
2020-12-293603
2020-12-303446
2020-12-312632
2021-01-012595
2021-01-023980
2021-01-034351
2021-01-043983
2021-01-053944
2021-01-063873
2021-01-073287
2021-01-083165
2021-01-094479
2021-01-104010
2021-01-113803
2021-01-124884Move download links from gadgets to Wikisource (group0)
2021-01-135262Move download links from gadgets to Wikisource (group1)
2021-01-1455468.9931
2021-01-1553588.7314
2021-01-1651808.7413
2021-01-1756428.7313
2021-01-1892137.7175
2021-01-1980629.1316
2021-01-2055329.3292
2021-01-2165168.8728
2021-01-2299857.6058
2021-01-2370777.2695
2021-01-2479757.5939
2021-01-2577697.2061
2021-01-2671727.7030
2021-01-2793467.4200
2021-01-28100657.5907
2021-01-29110666.9628
2021-01-3095516.2510
2021-01-31126406.8991
2021-02-01146616.5813
2021-02-02109407.4914
2021-02-03130106.8023
2021-02-04120556.0929
2021-02-05159925.7397
2021-02-06249654.7574
2021-02-07206425.1620
2021-02-08210054.5065
2021-02-09139505.9370
2021-02-1064578.5547
2021-02-11113987.6352
2021-02-12118667.2099
2021-02-13138116.6944
2021-02-14137847.2443
2021-02-15114239.0972
2021-02-16105028.3911Download Button, Replace Electron PDF with WS-Export (all groups)
2021-02-17153448.2288Caching http requests
2021-02-18153346.9738
2021-02-19165736.0551
2021-02-20148176.1849
2021-02-21110117.4162
2021-02-22318274.8391
2021-02-23621224.2677
2021-02-24673644.6376
2021-02-25612834.4638
2021-02-26214915.7435
2021-02-27253525.0211
2021-02-28631174.0417
2021-03-01624574.6873
2021-03-02616774.5330
2021-03-03241335.4718
2021-03-04152766.6208
2021-03-05275514.9634
2021-03-06726973.8224
2021-03-07755793.8383
2021-03-08719133.9885
2021-03-09299135.0304
2021-03-10166336.4611
2021-03-11337714.6375Remove phetools dependency
2021-03-12754753.5140
2021-03-13782923.4486
2021-03-14678083.6603
2021-03-15178365.5153
2021-03-16119966.5452
2021-03-1795228.1864
2021-03-18338024.7283
2021-03-19777293.5091
2021-03-20759643.5239
2021-03-21665883.6732
2021-03-22102149.4203
2021-03-23108718.8189
2021-03-24101538.1211
2021-03-25382034.4591
2021-03-26796033.5001
2021-03-27747253.9619
2021-03-28634093.6814
2021-03-2985599.2531Disruptive bot blocked
2021-03-3086447.1967
2021-03-3170799.1248

Visualization

chart.png (692×1 px, 54 KB)

The blue bars are number of exports, and the red line is the average export time. The straight lines are the trends, which at face value clearly show the number of exports on an upward trend, and the average export time on a downward trend. The red line incorrectly is accounting for nonexistent data prior to January 14, which I can't seem to correct in Google Sheets, but there is in fact a downward trend starting January 14.

One interesting pattern is that more exports seem to equate to a lower average export time. This might be explained by repeated and rapid exports of the same book, which pull from the cache and export much faster, hence bringing down the average.

Conclusions

It is difficult to draw any conclusions since there are many factors that can skew the data, particularly bots which can come and go at any time.

In mid January we started seeing an increase in exports, which might be attributed to moving the download links to the Wikisource extension. This meant the HTML for the links was present on page load, rather than it being added by JavaScript, so more web crawlers and bots that don't understand JavaScript might have started clicking on those links. This is just a theory, though.

The other variances I am not able to explain without significant and tedious effort.

Note that all wikis were stuck on wmf.27 for a few weeks. On February 16, all wikis were promoted to wmf.30 (T271344#6833578) which brought both the download button to all Wikisources as well as replacing Electron PDF with WS Export. Within days, we saw a dramatic increase (+600%) in downloads, as well as spikes in CPU usage: https://grafana-labs.wikimedia.org/goto/WG9qUSlMk. I cannot conclusively tie these events together, but it seems probable they are related.

Caching HTTP requests should by all accounts decrease the download times for subsequent exports in short succession (which is not uncommon), but the number of other one-off exports where caching isn't beneficial is probably enough to skew the numbers, and I suspect that's why it appears not much improved after February 17. However the trend of average export times has clearly decreased.

The drop in downloads starting March 29 might be explained by the disruptive bot that was blocked.

Thank you so much for this analysis, @MusikAnimal!

One quick observation & question: Yup, the blocked bot definitely correlates, timeline-wise, to the drop in downloads on March 29th. Do we know if this bot was also affecting the numbers *before* our changes, or is it possible that it only impacted export data after our changes (since export links may have been easier for web crawlers/other cause) after our changes? Or is it hard to say?

Either way, the export numbers are still larger after our changes, but any additional context on the bot would be helpful. Thank you!

One quick observation & question: Yup, the blocked bot definitely correlates, timeline-wise, to the drop in downloads on March 29th. Do we know if this bot was also affecting the numbers *before* our changes, or is it possible that it only impacted export data after our changes (since export links may have been easier for web crawlers/other cause) after our changes? Or is it hard to say?

I should have checked more when I did this analysis... The logs only go back two weeks. I checked the oldest ones we have at the time of writing, dated March 23 and March 24, and there were no instances of that particular user agent. I highly suspect other bots were involved (perhaps the same one too, just using a different user agent), because the massive increase in exports starting February 23 seems to be too much to attribute to human activity, though as I said the February 16 release probably influenced it some, too. Indeed it is hard to say :(

What will be really interesting is to see the numbers once we implemented IP-based throttling, which will stop the vast majority of bots once and for all. That's a 10% project I plan on implementing in the near future, assuming our request with Cloud Services is approved (T279111).

This investigation is now wrapped up, and we have discussed its findings as a team. I'm marking this work as Done.