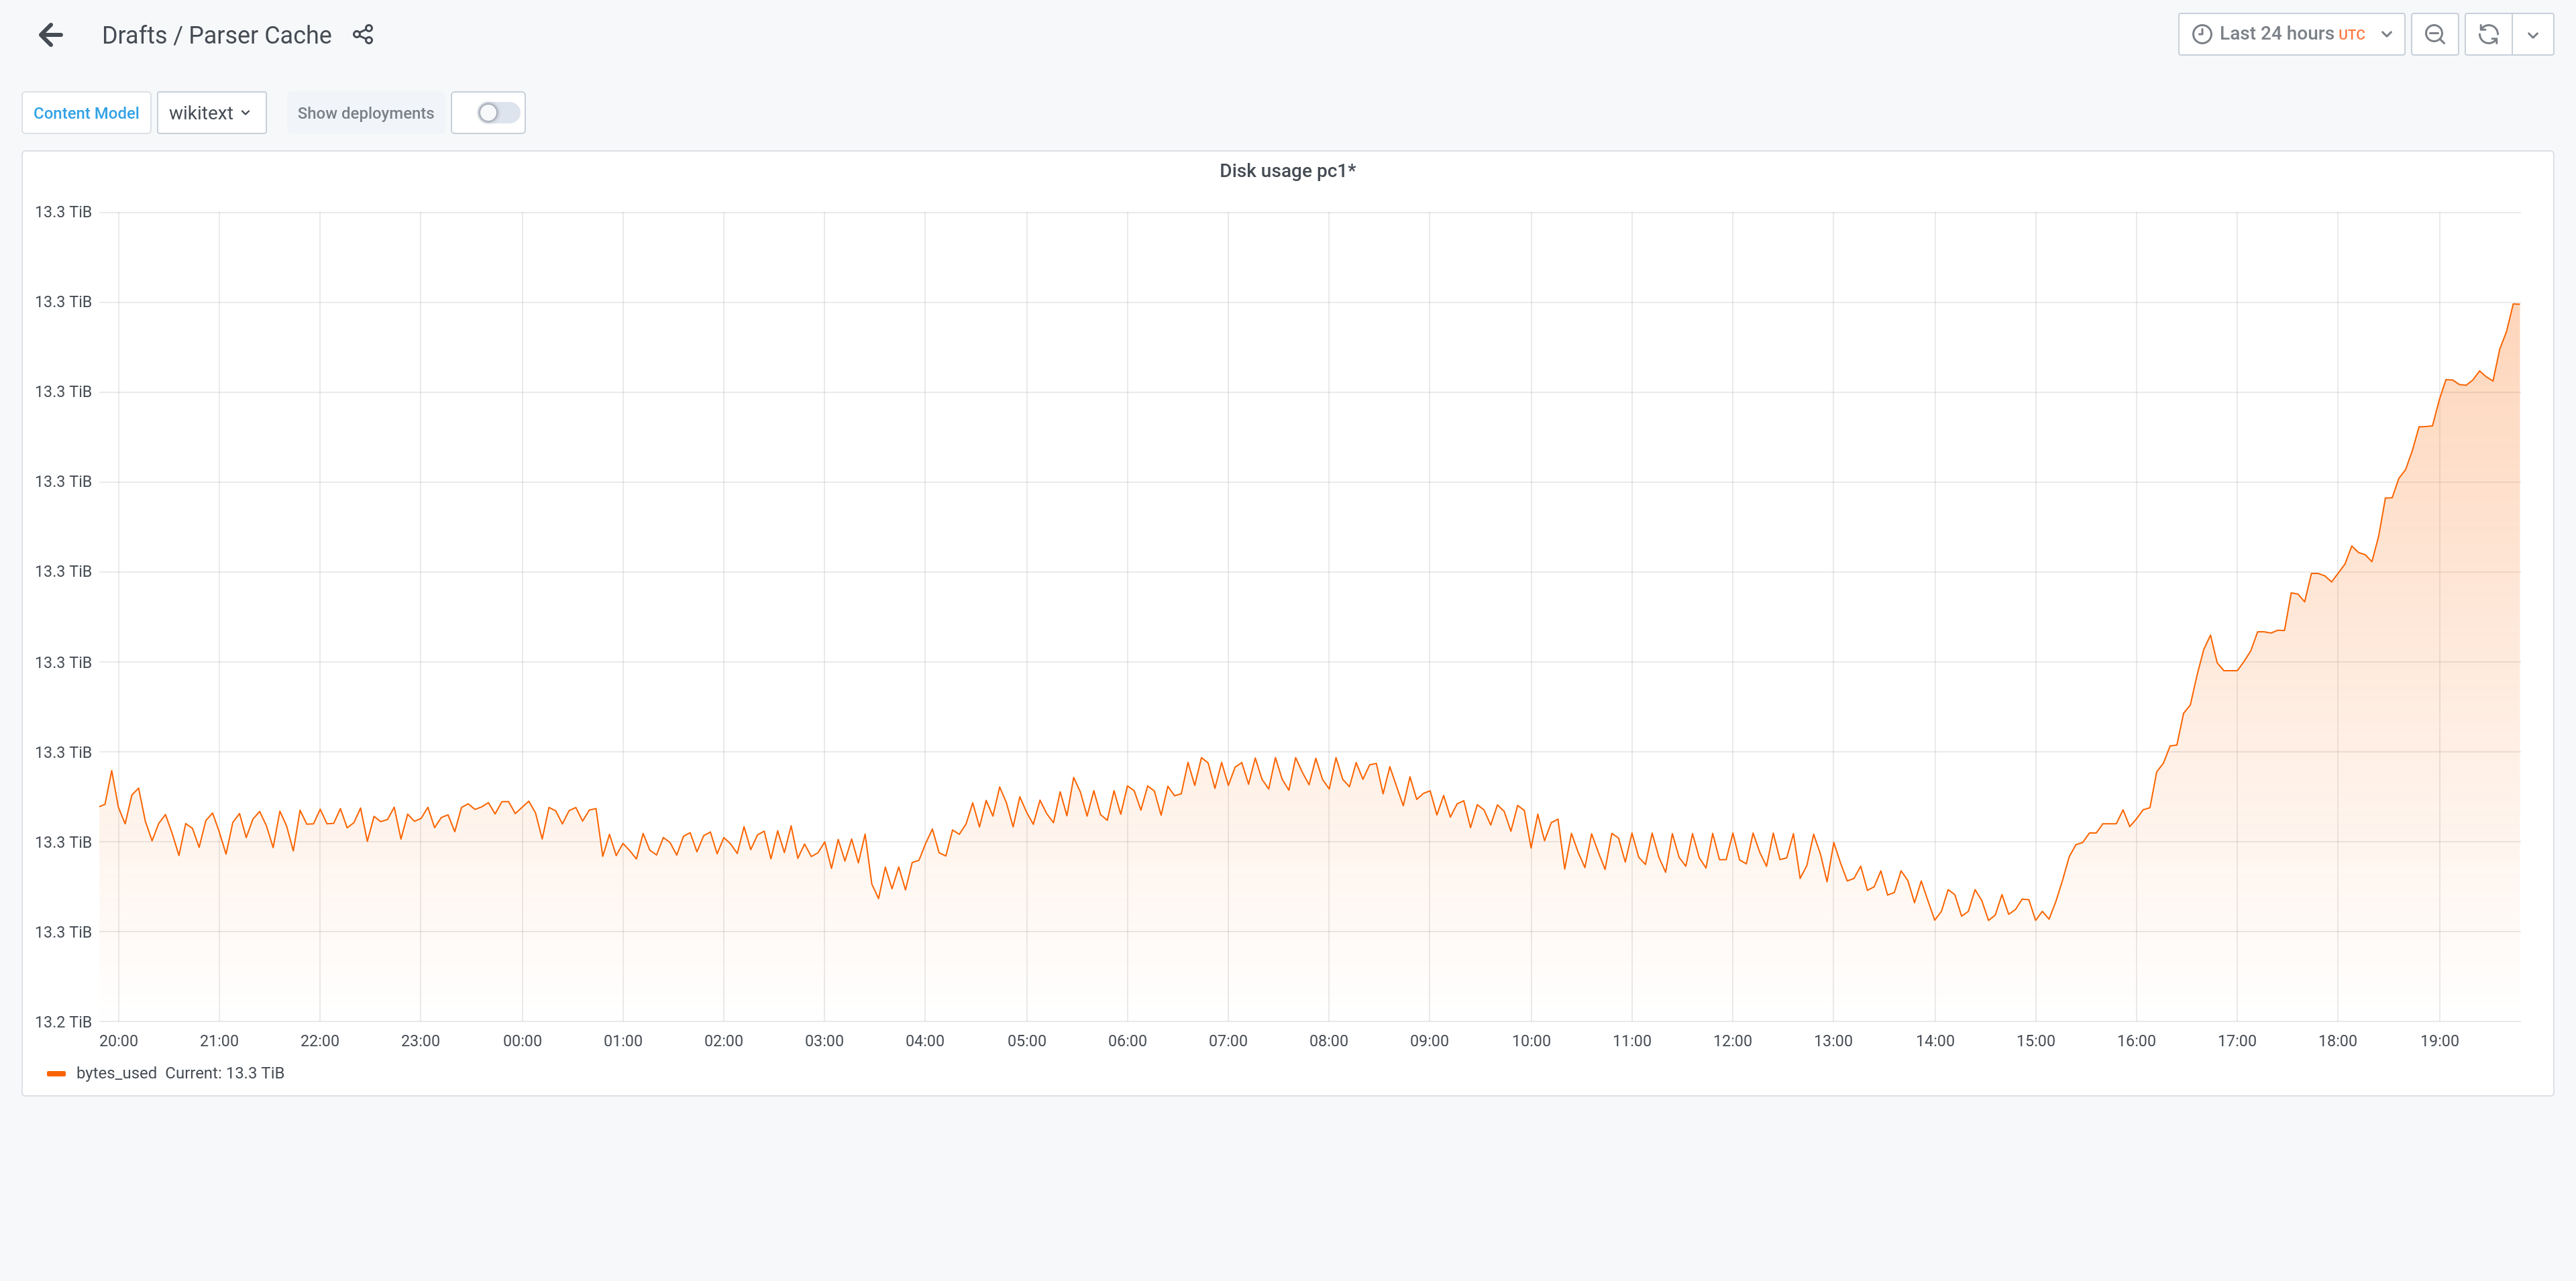
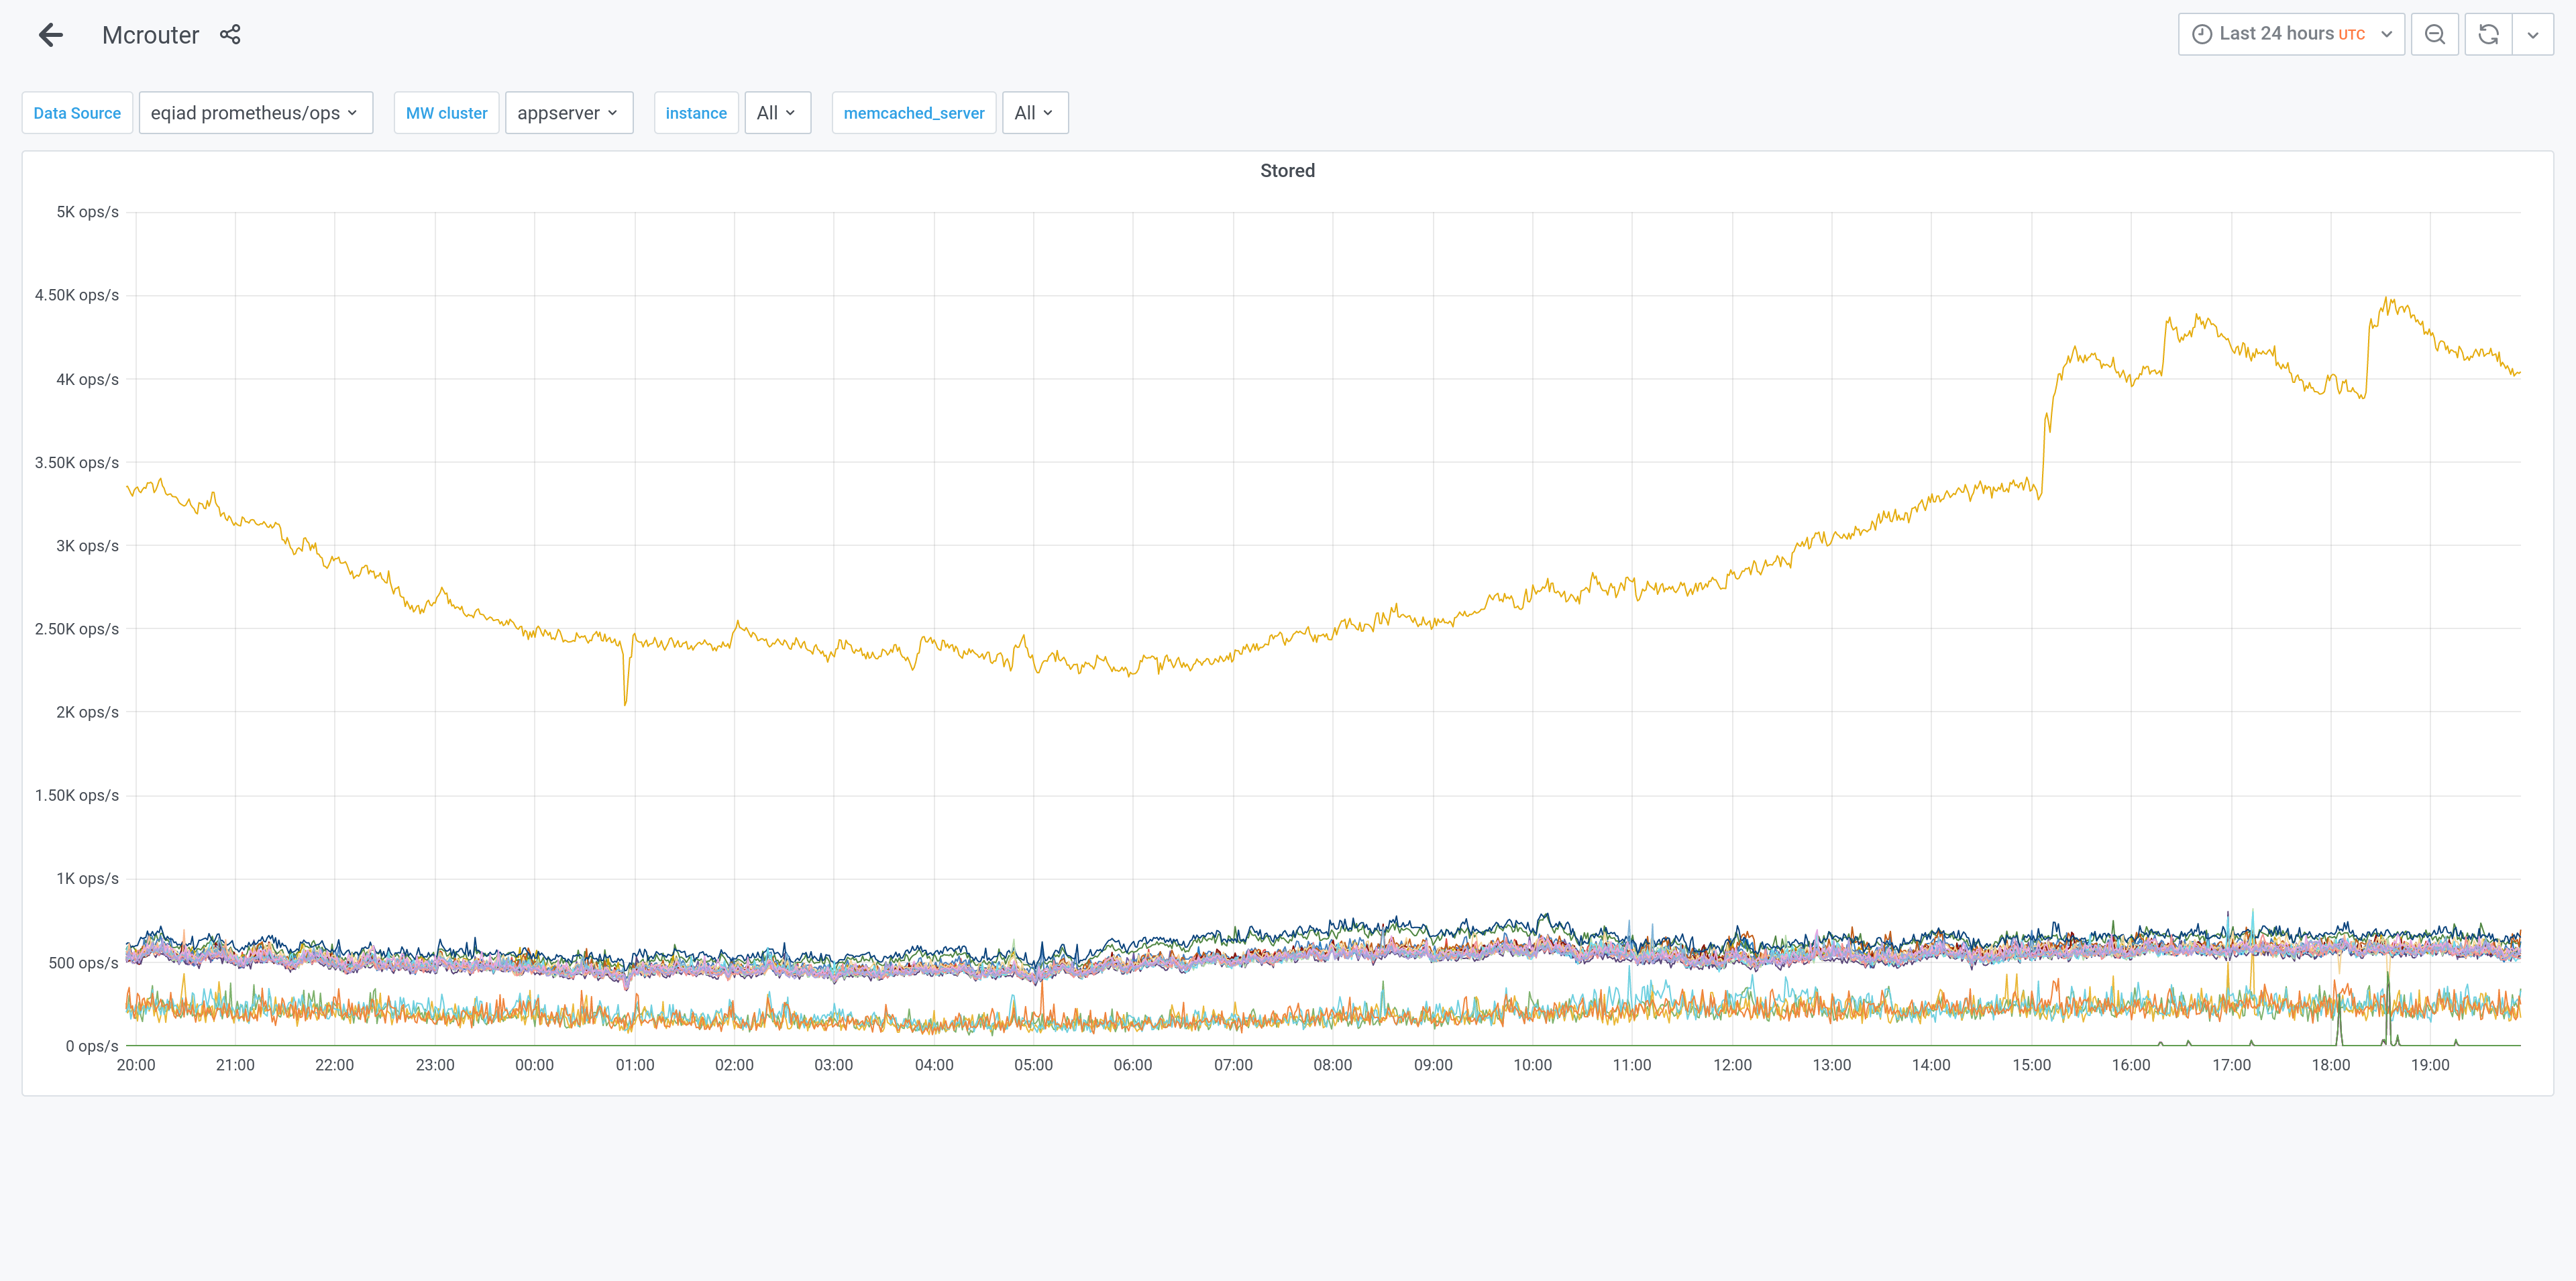
There was a latency spike at the same time as rapid parser cache growth starting around 15:06 UTC 2021-03-28. This was visible in parser cache dashboards and in onhost memcached traffic.
| parser cache | latency | mcrouter |
 |  |  |
| Legoktm | |
| Mar 28 2021, 7:55 PM |
| F34299643: capture.png | |
| Apr 8 2021, 9:28 PM |
| F34299950: Screenshot 2021-04-08 at 22.24.51.png | |
| Apr 8 2021, 9:28 PM |
| F34195157: cap.png | |
| Mar 29 2021, 1:08 AM |
| F34195154: cap.png | |
| Mar 29 2021, 12:57 AM |
| F34194948: Screenshot_2021-03-28 Application Servers RED Dashboard - Grafana.png | |
| Mar 28 2021, 7:55 PM |
| F34194946: Screenshot_2021-03-28 Parser Cache - Grafana.png | |
| Mar 28 2021, 7:55 PM |
| F34194951: Screenshot_2021-03-28 Mcrouter - Grafana.png | |
| Mar 28 2021, 7:55 PM |
There was a latency spike at the same time as rapid parser cache growth starting around 15:06 UTC 2021-03-28. This was visible in parser cache dashboards and in onhost memcached traffic.
| parser cache | latency | mcrouter |
| | |
The main parser cache change I'm aware of recently is T267404: Add reply links to the parser cache, ccing @matmarex, @Esanders.
@elukey captured some memcached traffic on mw1272, all of the ParseUsedOptions entries had "dtreply": true, don't know if that's a red herring or not.
It would be nice if we had logs from parser cache indicating the user that triggered the new cache entry and why (non-canonical options, outdated, etc.).
Based on https://grafana.wikimedia.org/d/000000106/parser-cache, it seems the only significant change in event rate or distribution, was there being an (absolute) increase in miss_expired events:
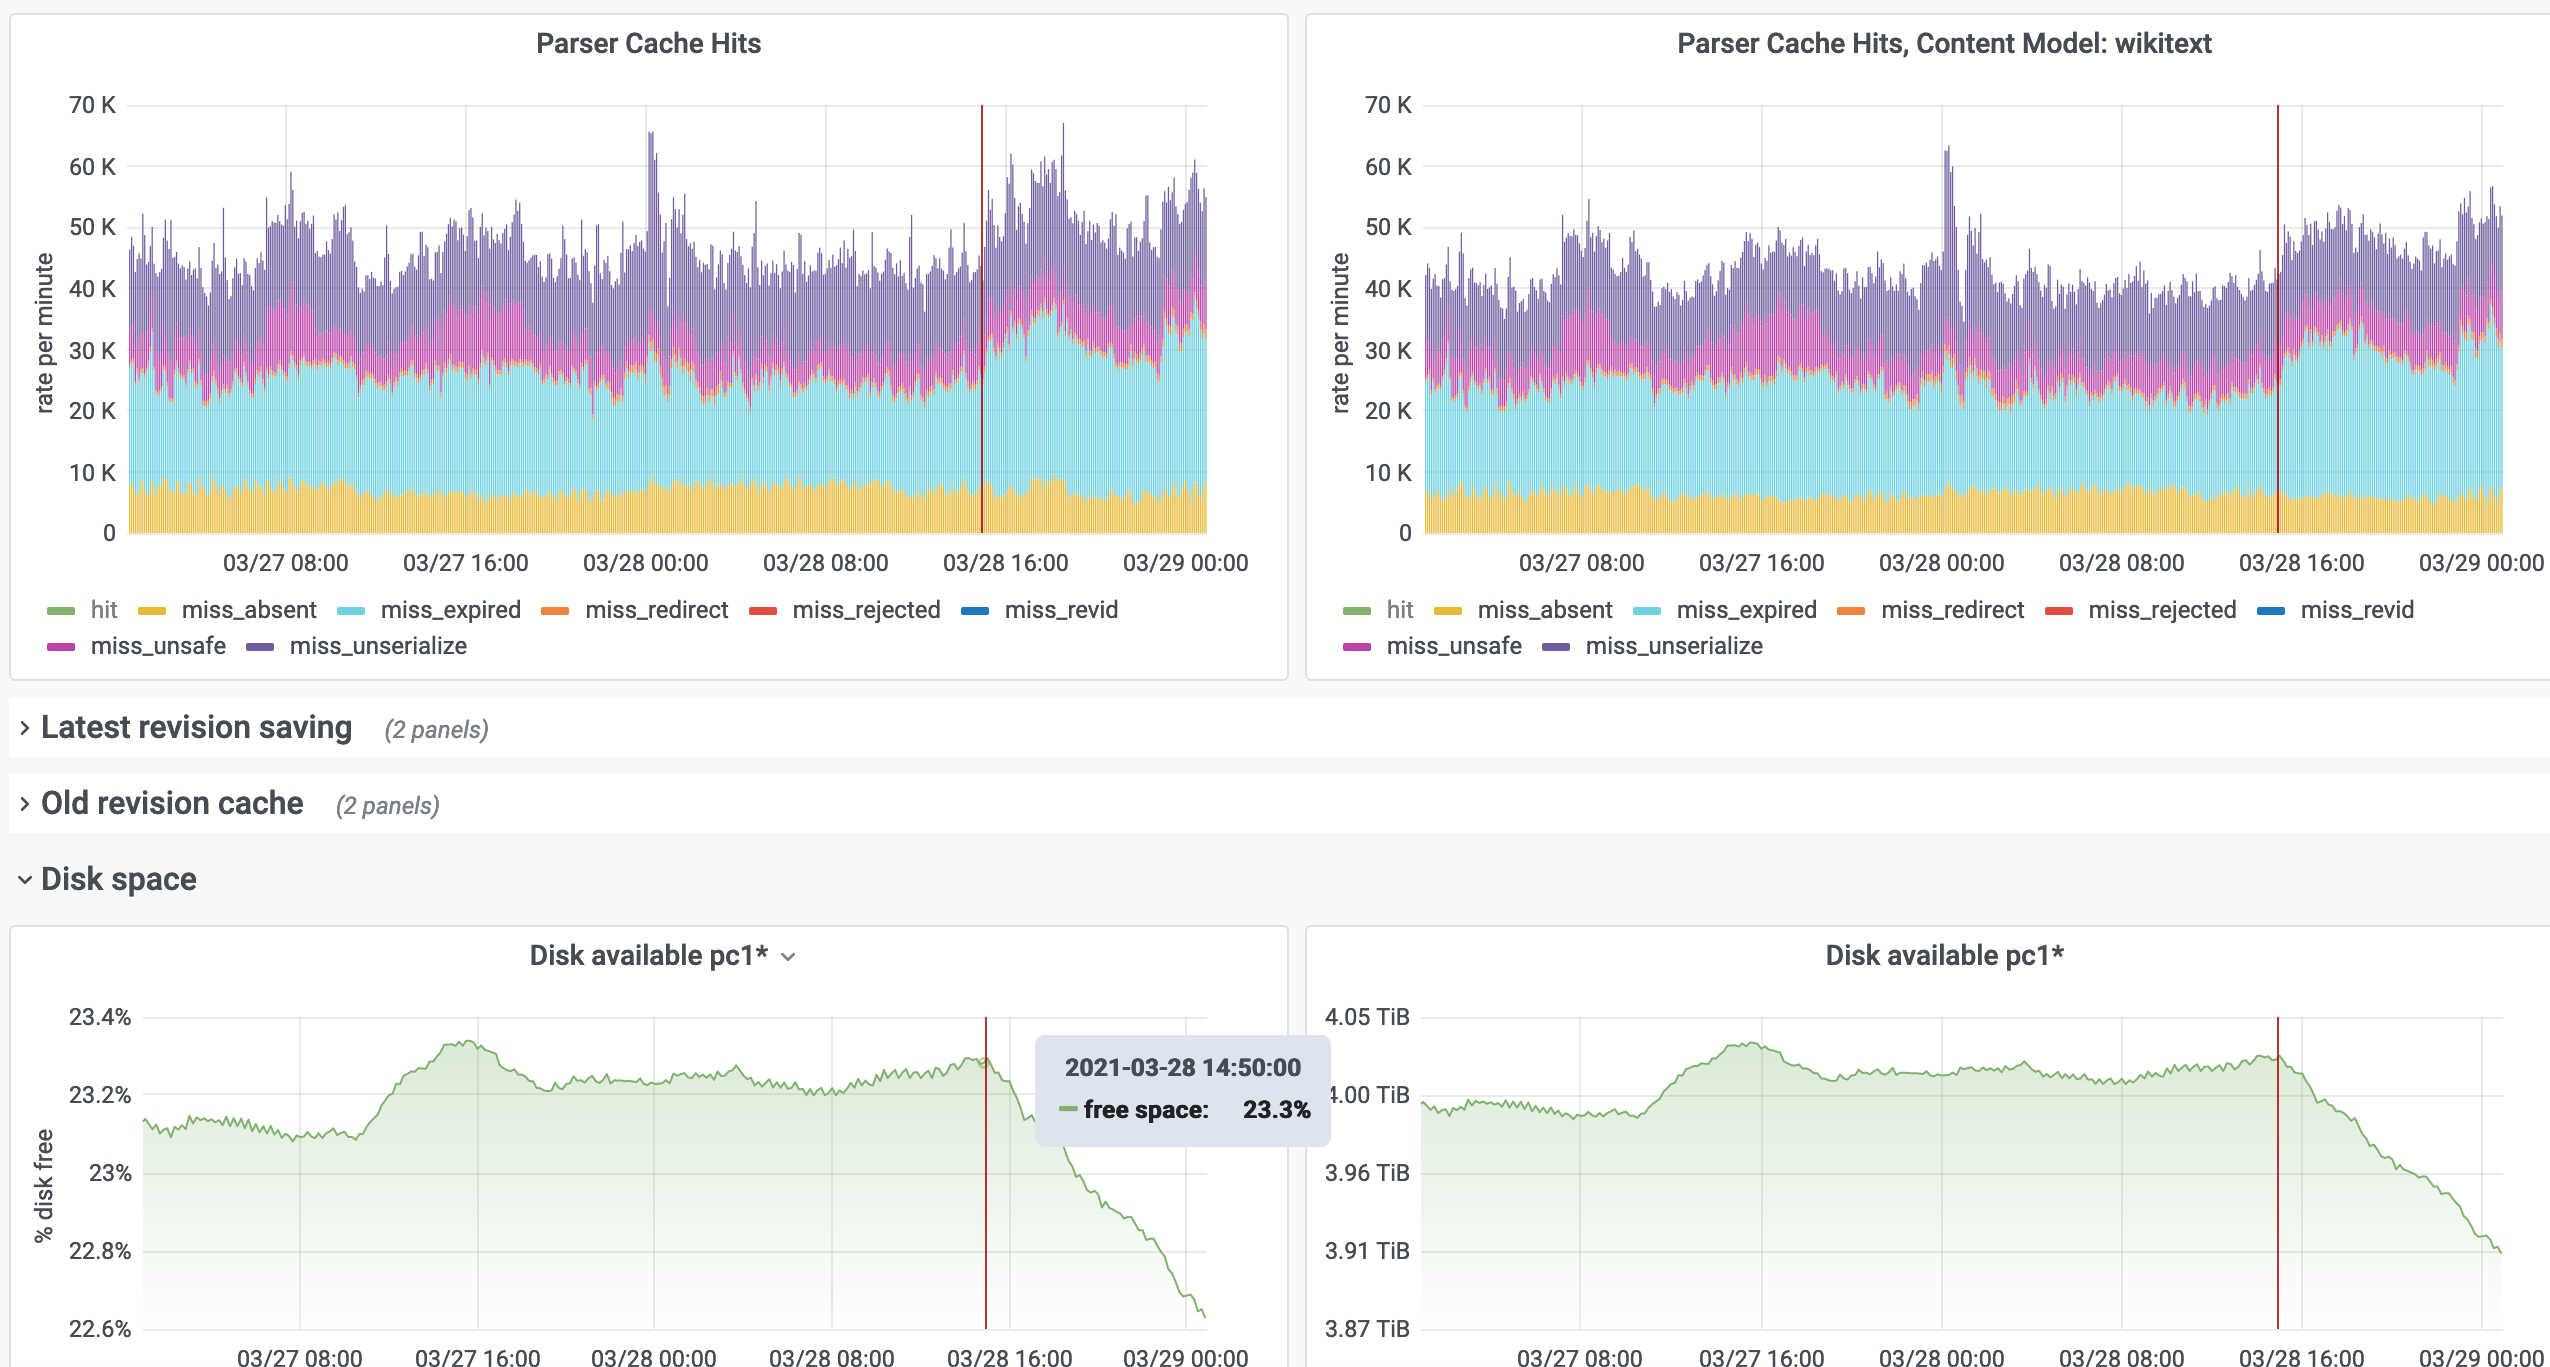
Zooming out further, I notice two trends that are not new this week:
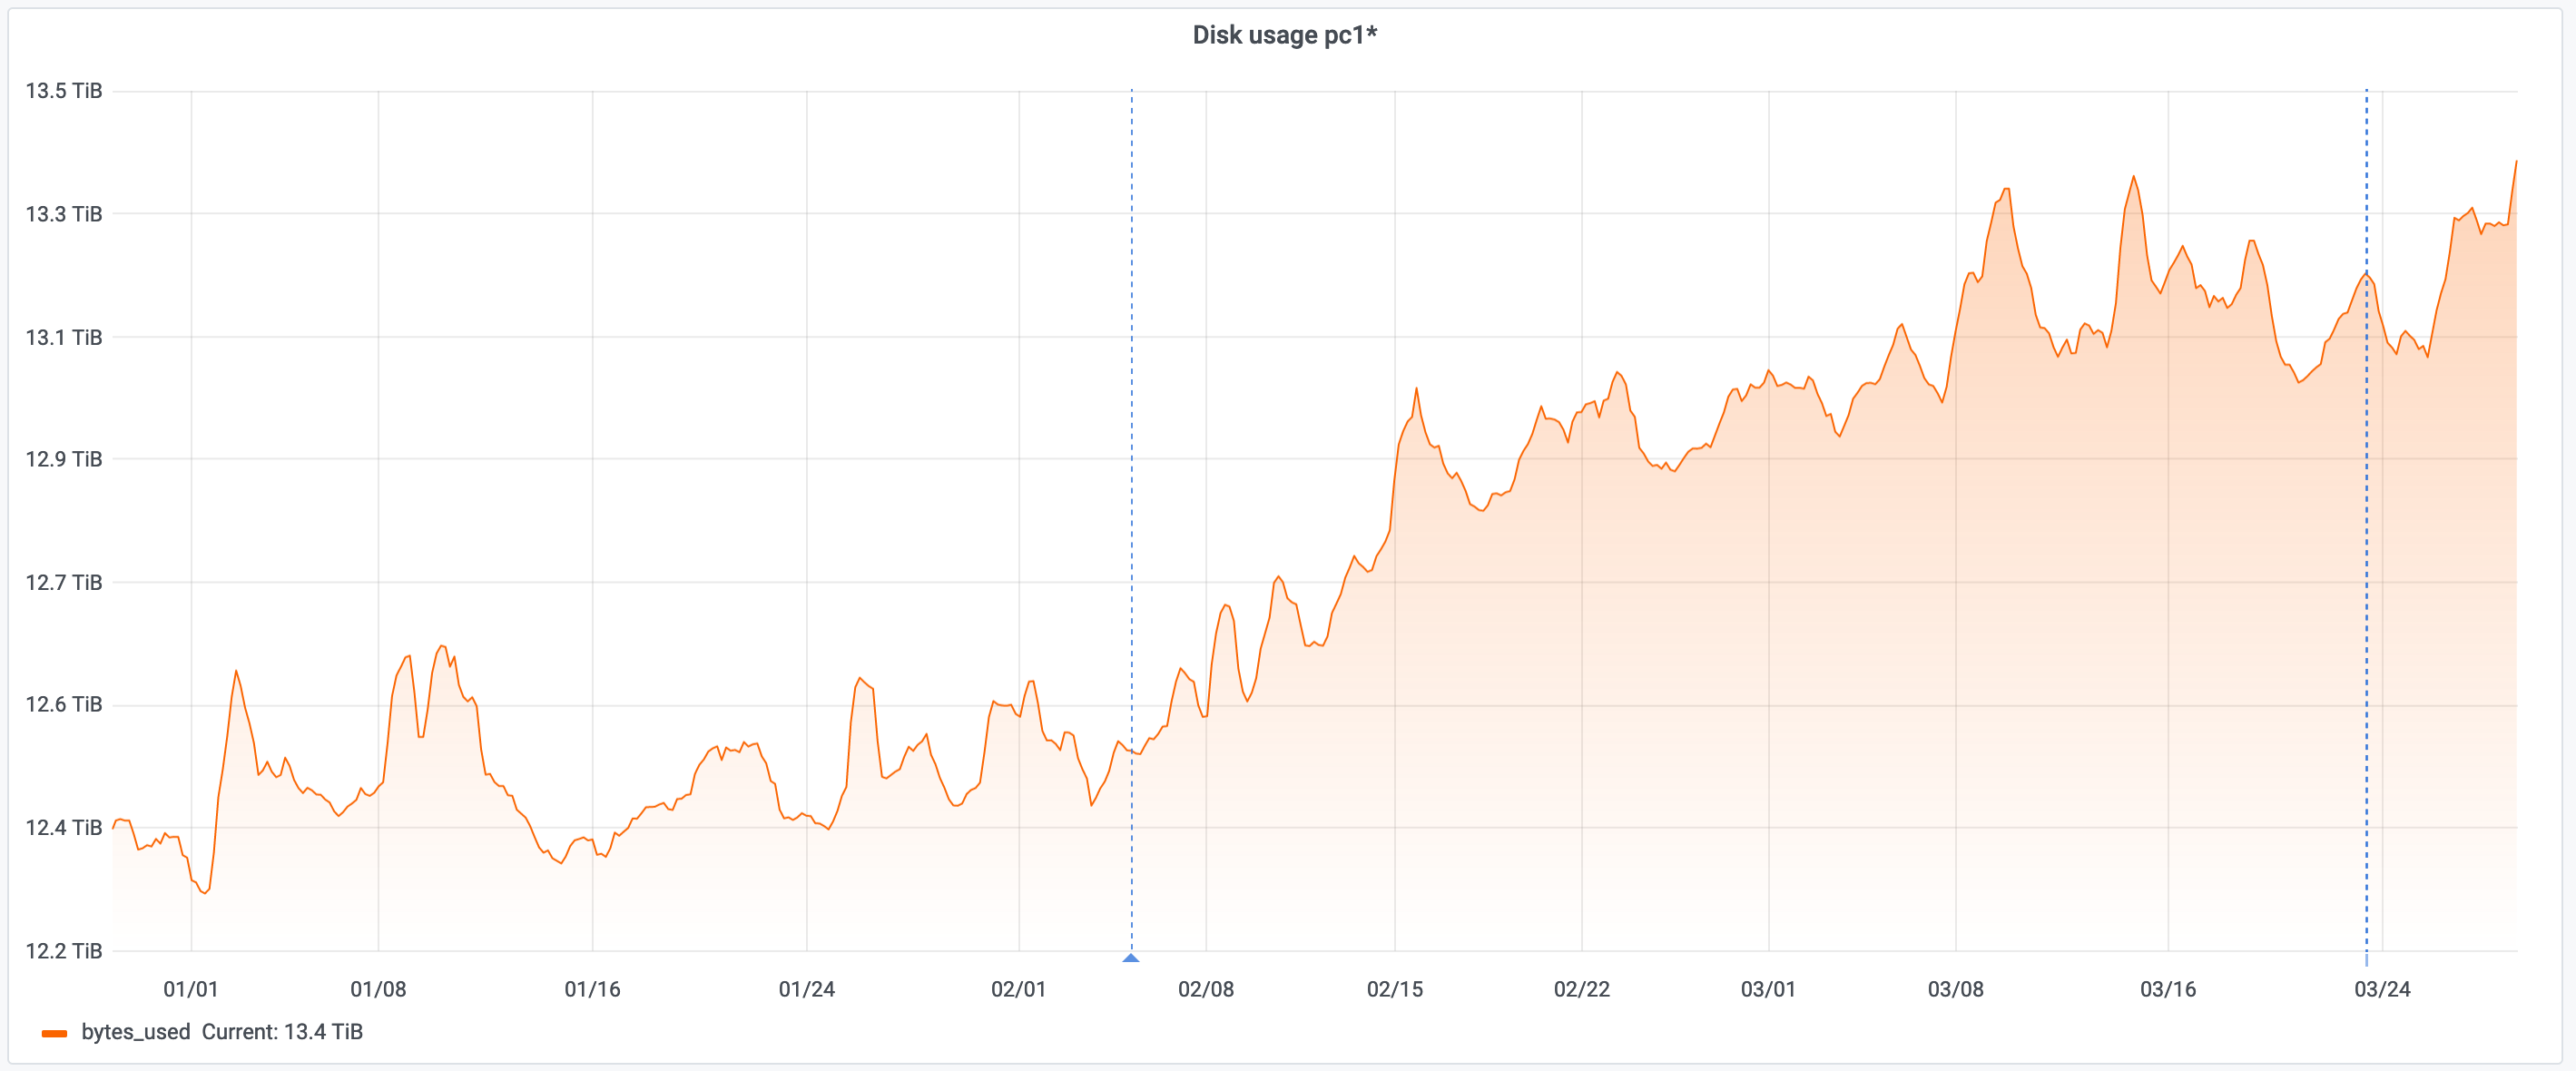
But this past week, it looks as if space may've been recovered by some unusual event. Possibly a manual purge, or perhaps 30 days ago where was unusual demand for otherwise unpopular objects that are expiring with other other things taking their place. And after that dip, the February increase is continuing as before:
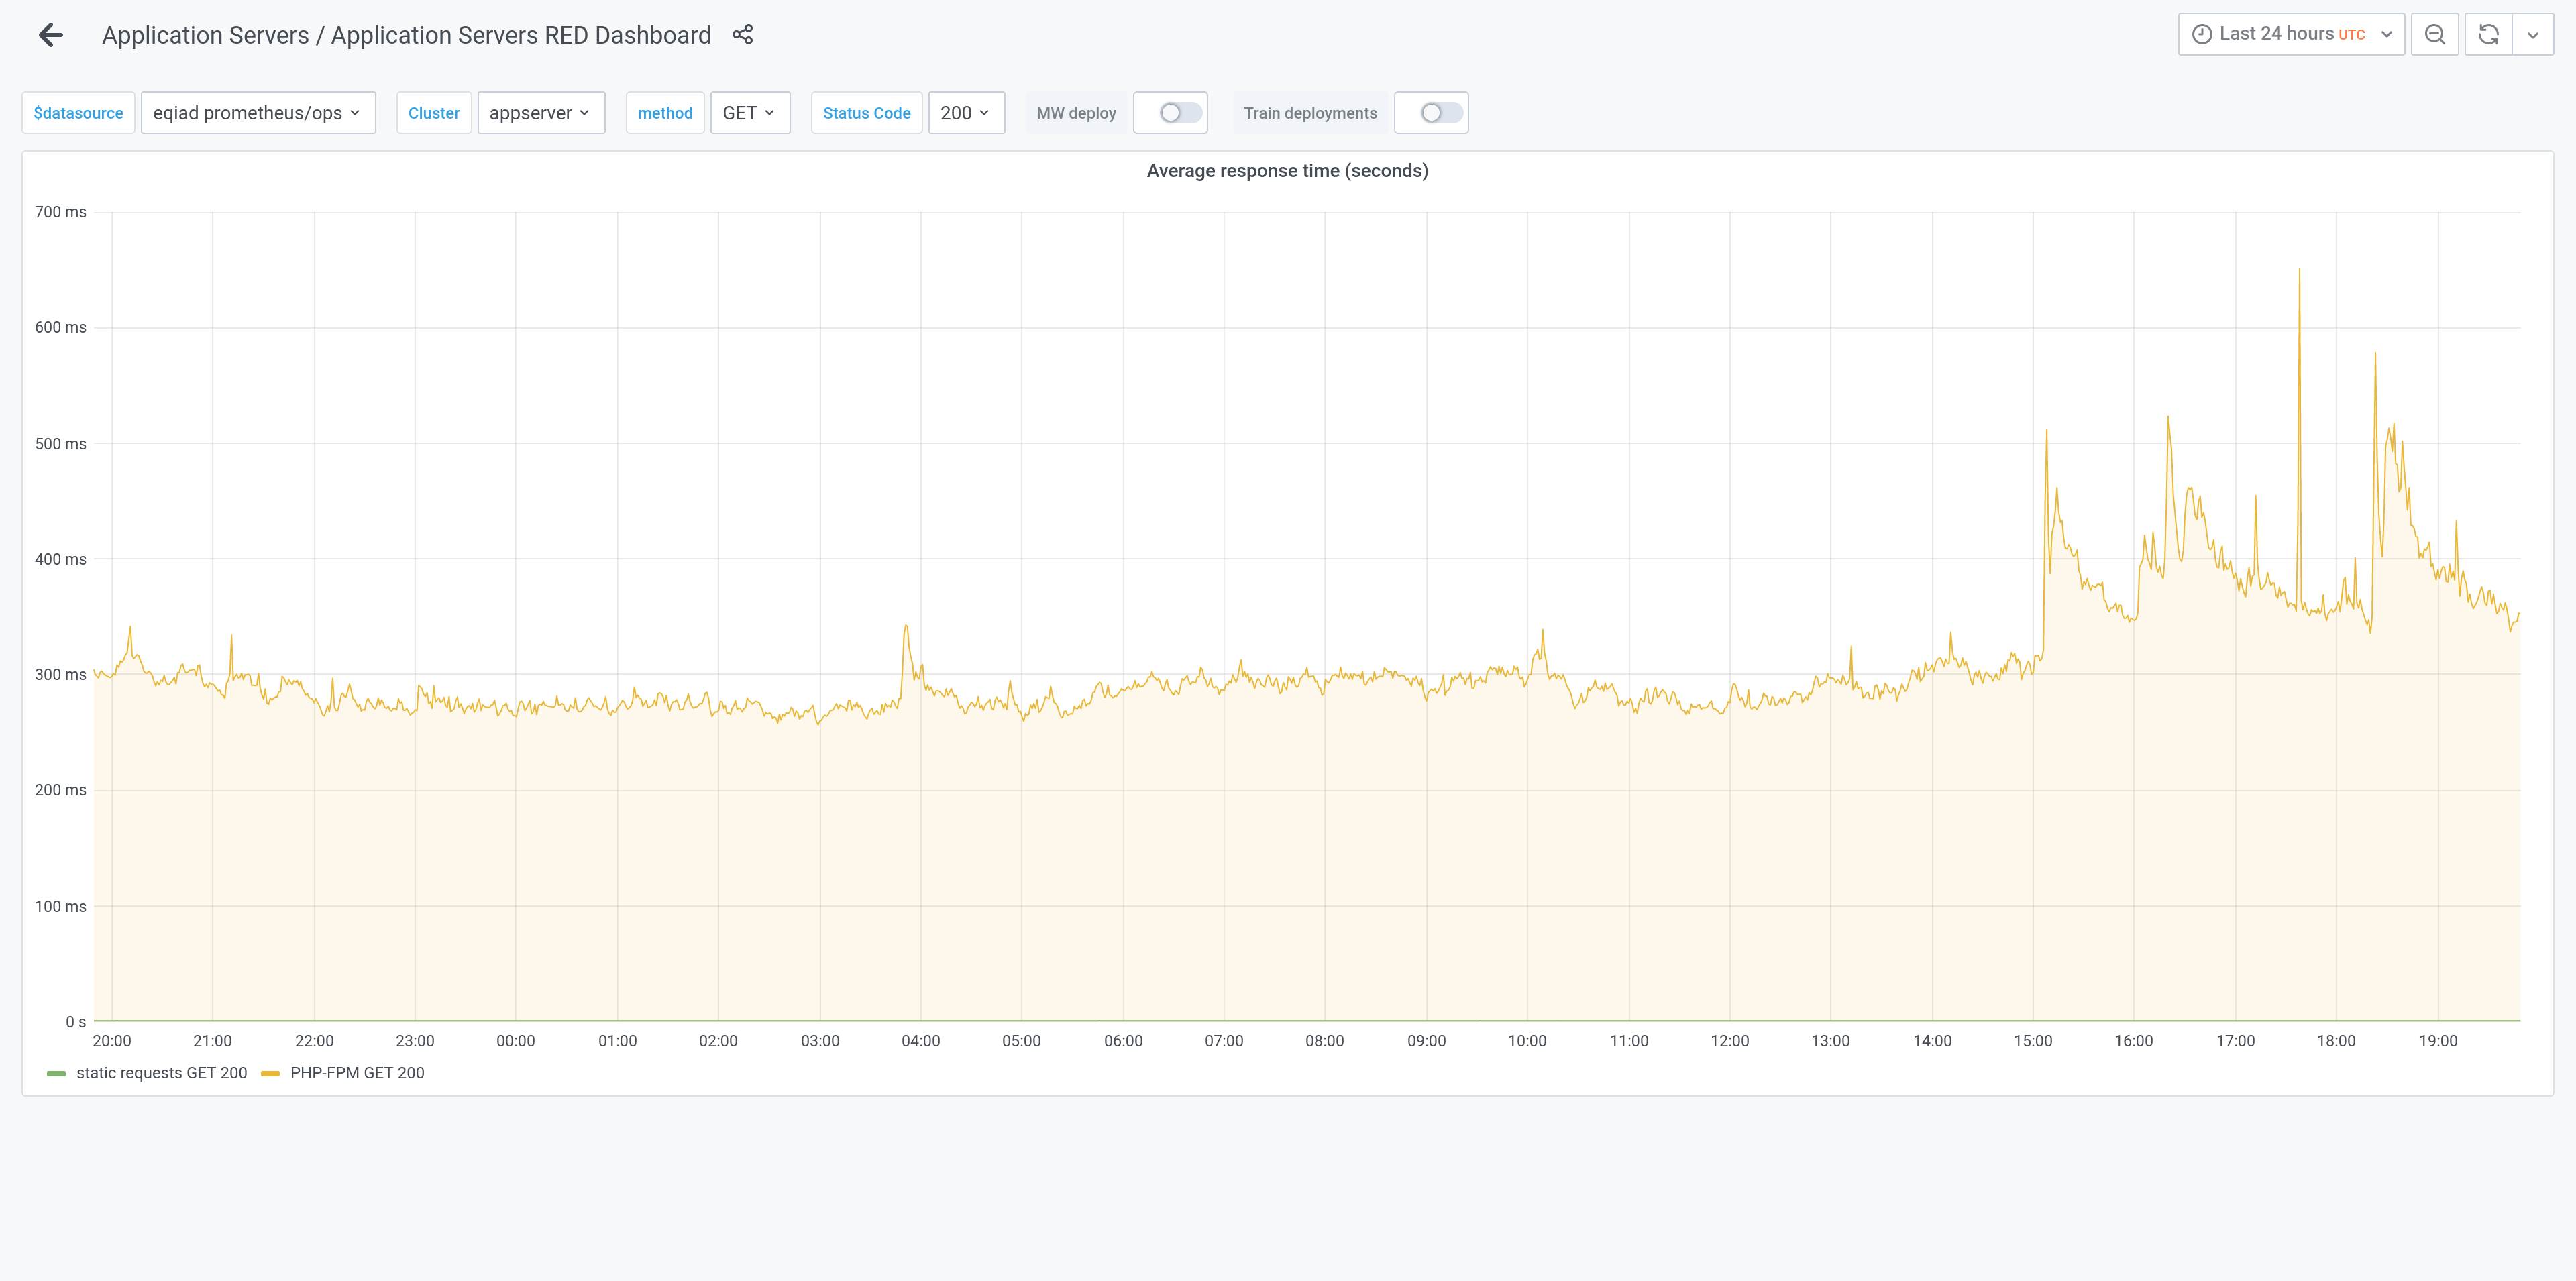
I am not sure if it is related, but I saw a pattern that fits the pattern in the task description. I looked for slow requests, since they are the ones more likely to be filling up the parser cache.
https://logstash.wikimedia.org/goto/ce439bf95a5e0bc6100238980fbf456f
Almost all of them are action=render.
ParserCache is split on action=render, so none of the action=render pages are usually cached. See T263581 for more details.
We've tried to eliminate the split, there's even a POC code written already, but it's a rather complex and risky operation, so we've never actually done it. We can prioritize it back if it causes issues.
Thanks for the ping, it doesn't seem like there's anything for me or @Esanders to do here at the moment? Let us know if there's something we should do, or if DiscussionTools is identified as a culprit rather than a bystander.
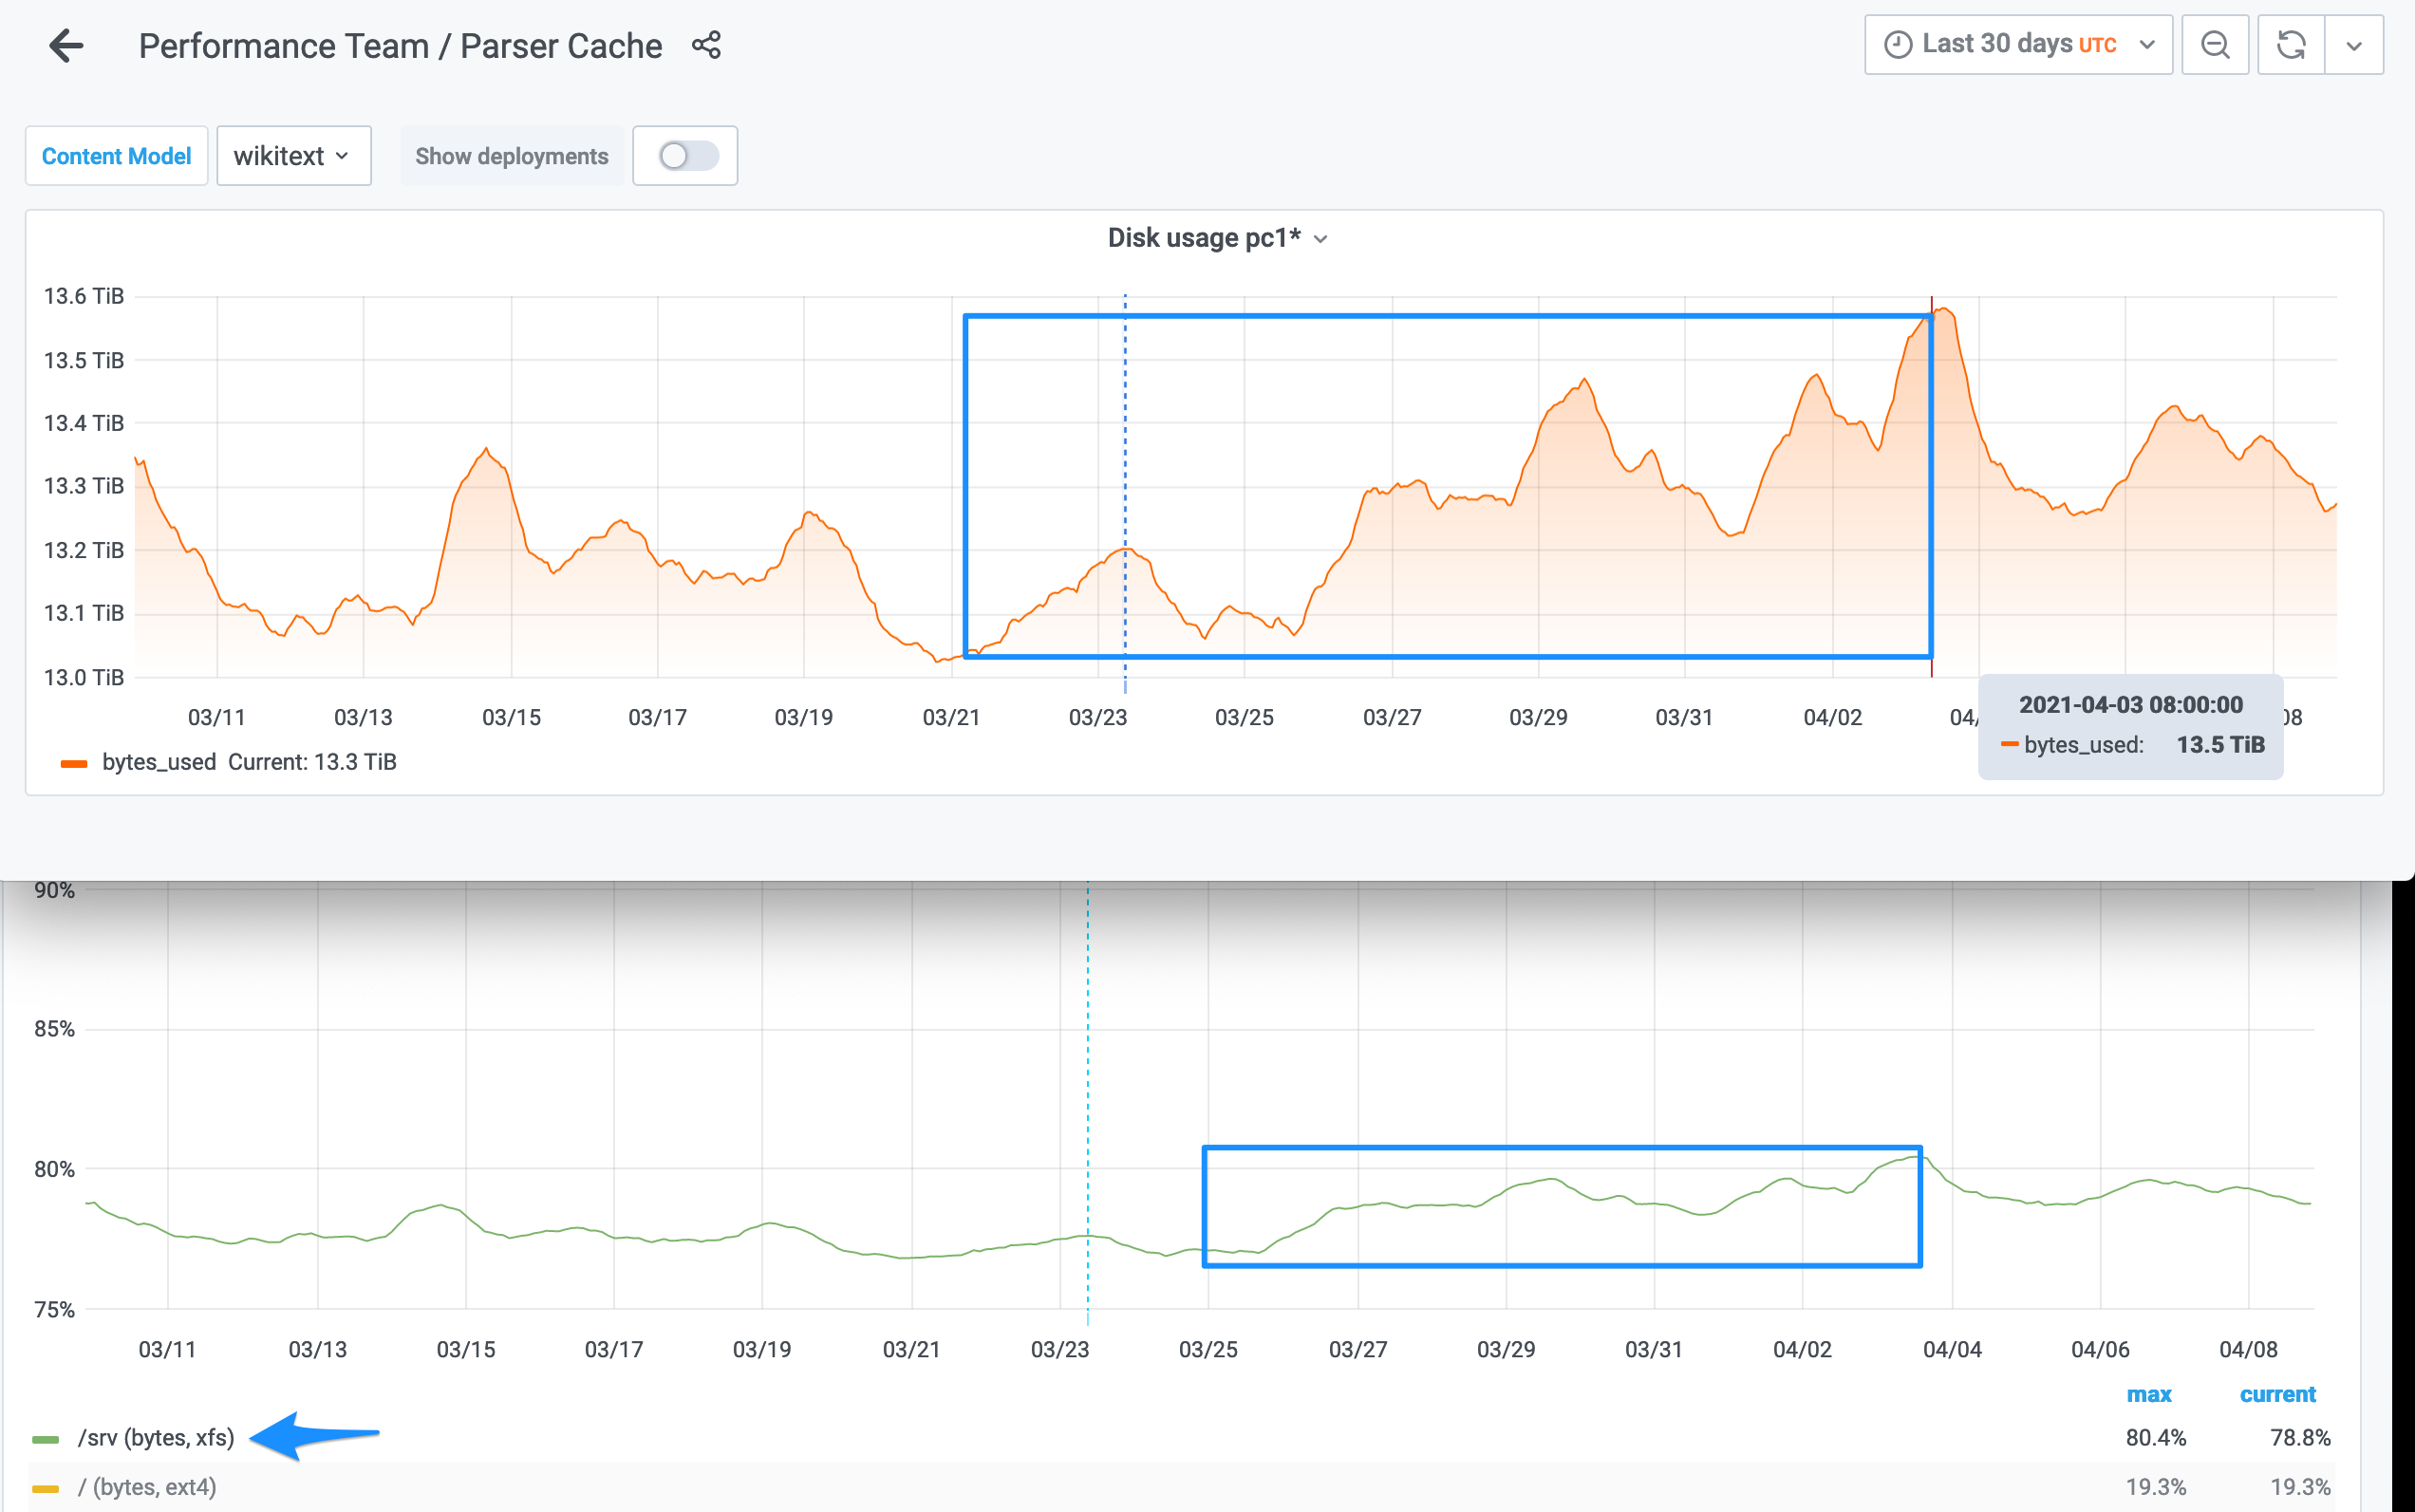
I am not fully sure I am reading the disk space graph correctly as I don't see an increase there. There's surely an increase on the graph itself but looking at the Y axis, it looks like always the same value?
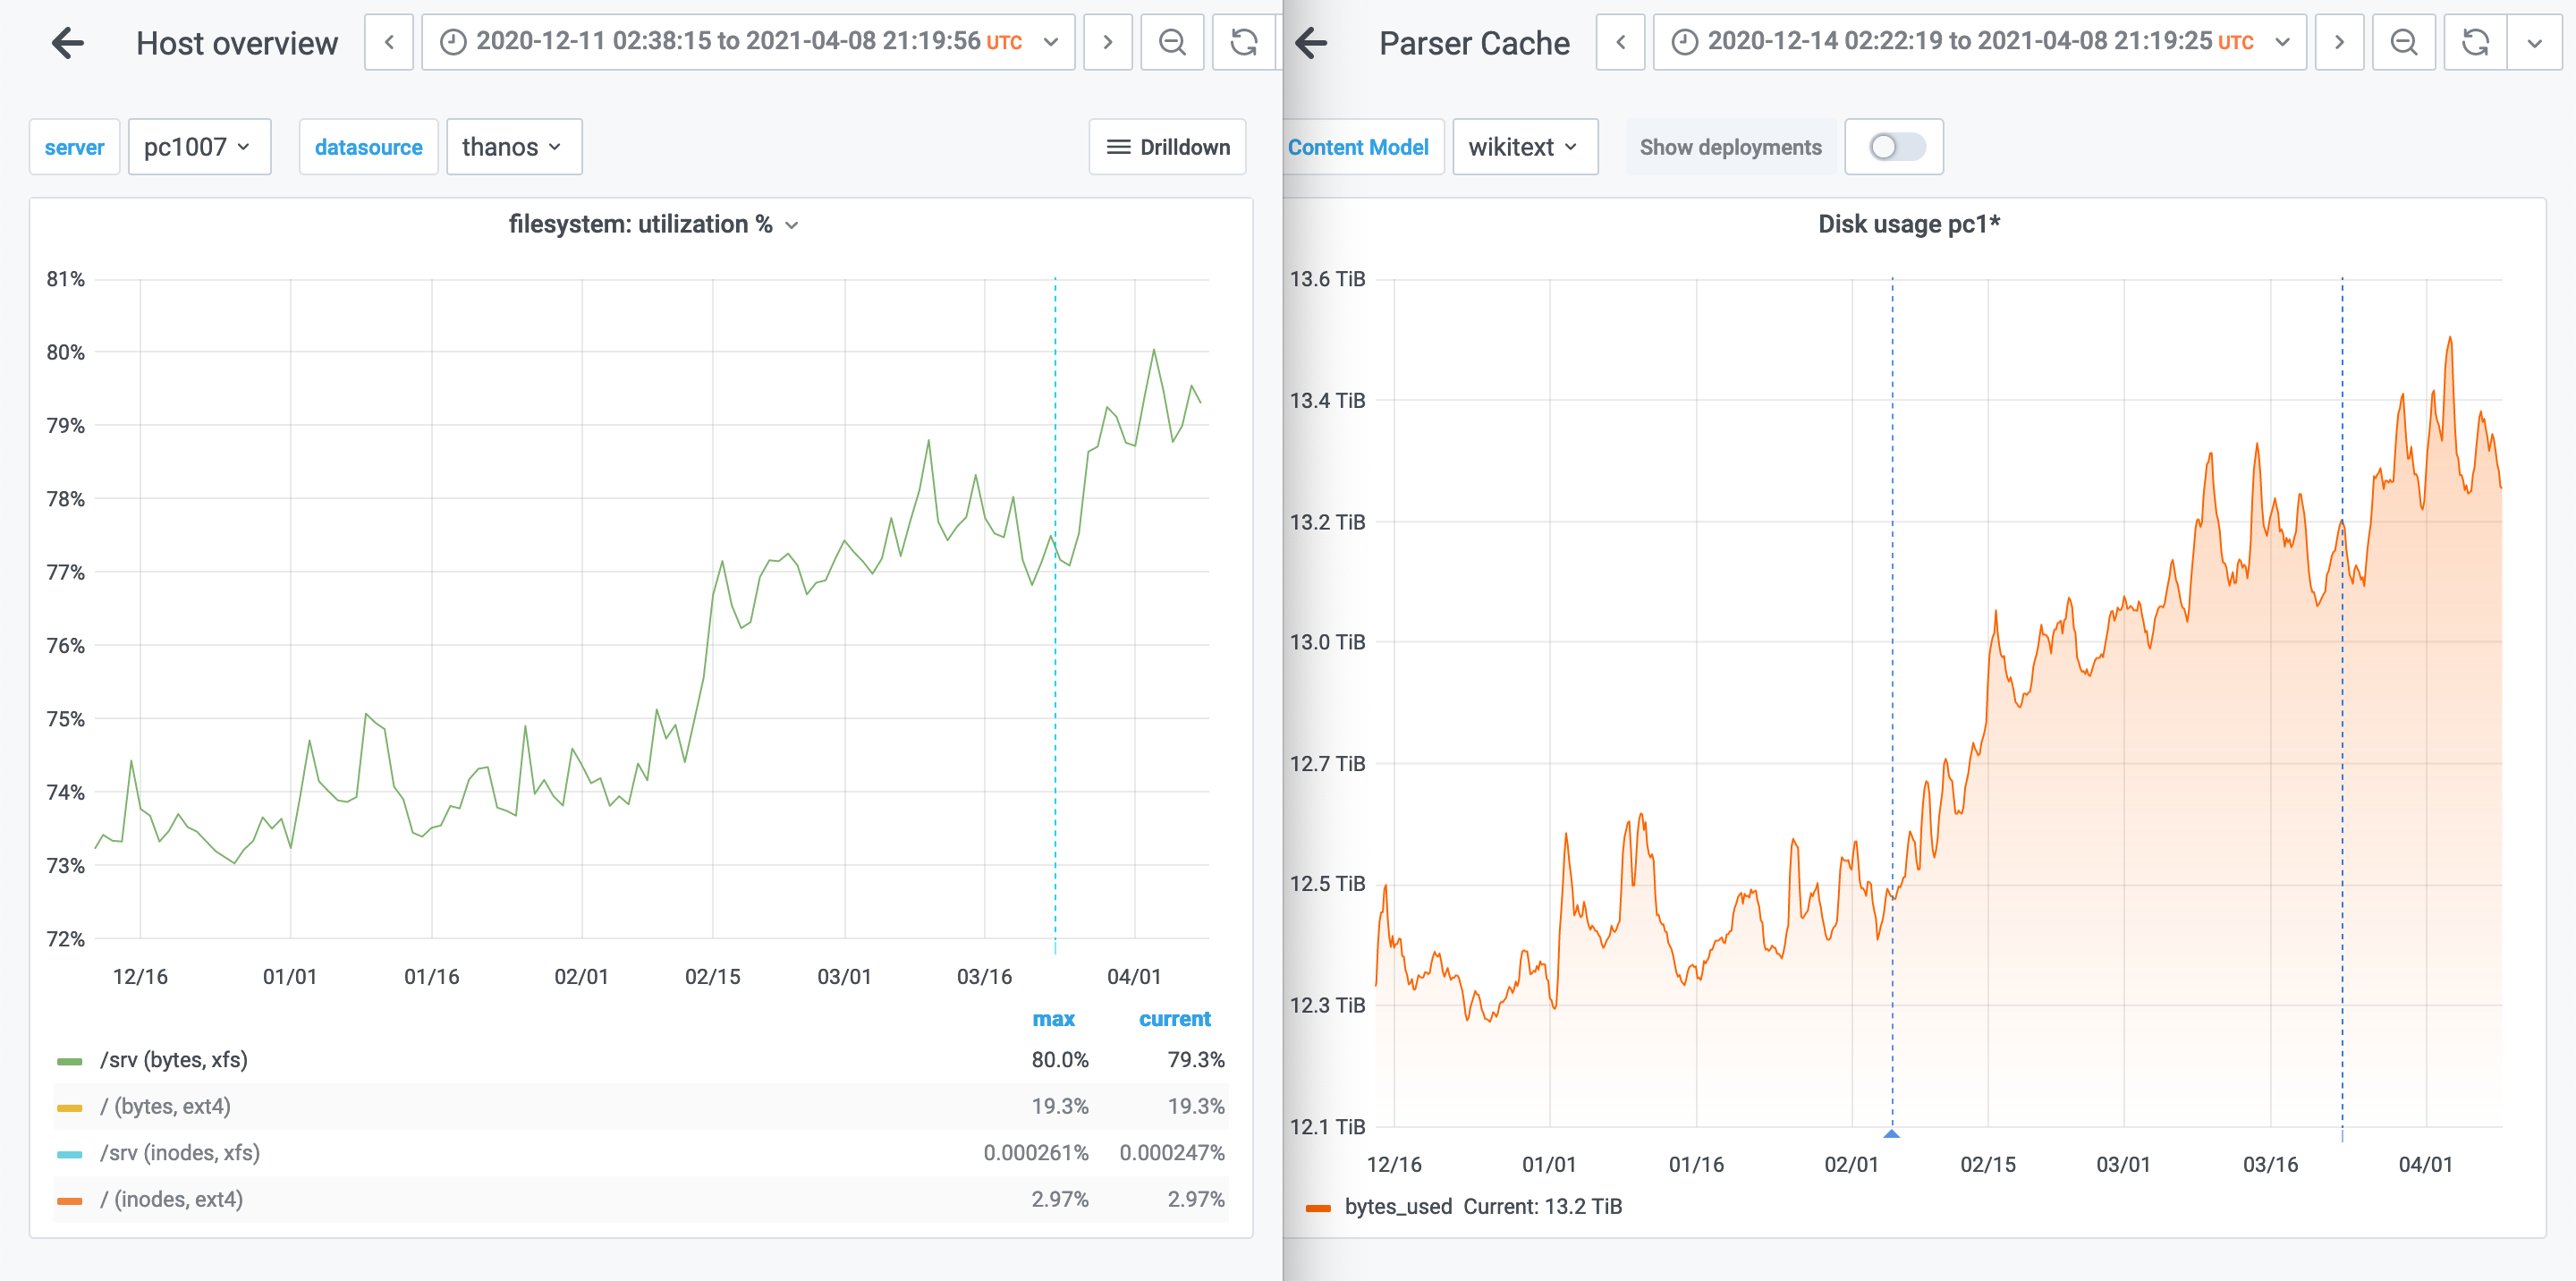
Looking at this date, I cannot find a correlation on the server disks growth: https://grafana.wikimedia.org/d/000000377/host-overview?viewPanel=12&orgId=1&from=1616889601000&to=1616975999000&var-server=pc1007&var-datasource=thanos&var-cluster=mysql
Looking for the aggregate graph, it looks like it is coming back to previous values, before the spike: https://grafana.wikimedia.org/d/000000106/parser-cache?viewPanel=9&orgId=1&from=now-30d&to=now
However, we all know that parsercache is very sensible to disk space issues, so we should probably keep an eye on this and if it keeps increasing without stabilizing, decreasing the retention period is probably the way to go.
I am not sure if it is going to stabilize, by looking at the two months graph, it shows as slow, but steady growth: https://grafana.wikimedia.org/d/000000106/parser-cache?viewPanel=9&orgId=1&from=now-60d&to=now
Like @Legoktm mentioned, the only new thing using ParserCache I am aware of is T267404: Add reply links to the parser cache.
Parsercache servers are reaching 80%, which is kinda the critical point for us to start thinking about decreasing the retention days and start a massive optimize across them to claim back some space on disk.
I have done some testing with pc000 in a testing host.
Deleted everything under 20 days so simulating that we only keep 20 days instead of 30.
Doing the delete + the optimize would give us 2.4GB back on that table (around 300k rows deleted). If we extrapolate, that's around 500GB back on disk.
That means the servers would go from 80% to around 70%.
Obviously this process isn't instant and will take a few days to be completed, during this day, we'd need to depool hosts.
Reminder: everytime we depool a host we "lose" 1/3 of the keys as we only have 1 hot spare (which currently serves on pc1), so once we place it on pc2 and pc3, that host is cold for those two sections.
This panel shows two very differently sized entities, srv-xfs at ~4 TB, and root-ext4 at ~0.007 TB (7 GB). This means the lines visually compress to the point where smaller and upcoming patterns may be hard or impossible to notice. It depends on the metric and purpose of that graph whether that's good or bad. If it can be both, then having a combined graph and a separate one may be useful so you can see it both ways. We kind of have that. There's the high-level one on the "Host" dashboard, and a lower-level one on the "Parser Cache" dashboard.
If you click on one of the lines in the legend you can reverse this visual compression and see the line for itself, at which point the correlation is easier to see:
Looking for the aggregate graph, it looks like it is coming back to previous values, before the spike: https://grafana.wikimedia.org/d/000000106/parser-cache?viewPanel=9&orgId=1&from=now-30d&to=now
However, we all know that parsercache is very sensible to disk space issues, so we should probably keep an eye on this and if it keeps increasing without stabilizing, decreasing the retention period is probably the way to go. […]
Here's last six months zoomed out. Indeed the increase from last week came back and we're now at the level we were two weeks ago. However overall we're still pretty much only going further upwards. Note, this graph is without 0 and 100 bounds, so it is emphasising the relative change. It's not a huge change, but the trend is indeed as you say worth keeping in mind to make sure it matches any growth and capacity planning long-term in terms of how quickly it grows.
1 terrabyte from 12.4 to 13.4 TB in two months, and for this particular server that translated to 7 percentage points from 73% to 80%.
Thanks @Krinkle!
Yes, we are well aware of the trends parsercache is having lately and the fact that is growing steadily and quicker than we thought. We have some options in case this becomes a (more) serious issue, which is essentially reduce the expiration time for the keys (it is set to 30 days) like we've done in the past and then manually purge+optimize the tables to get some more disk space back.
I am planning to request some budget for next FY if possible to, in Q1 replace these hosts with bigger hosts and the standard HW we use in production so we can have some peace of mind (and get rid of another HW configuration snowflake in our infra).
Specifically to this task, I don't think there's much of a follow up for now, so I am inclined to say: let's close it.
We have one host using 80% of the disk indeed, once the others reach it, I will probably create a more specific task to start thinking about reducing the expiration time and acting to keep parsercache away from that dangerous 80% usage, as another spike like this one could result on the hosts being 100%.