Lets run tests against our static page https://en.m.wikipedia.org/speed-tests/Banksy.enwiki.872156204/ and https://en.wikipedia.org/wiki/Barack_Obama.
Description
| Status | Subtype | Assigned | Task | ||
|---|---|---|---|---|---|
| Resolved | Peter | T279572 Evaluate doing Android performance test using a Raspberry Pi | |||
| Declined | • dpifke | T309041 Create and verify the full image | |||
| Declined | Peter | T279581 Continuously run tests using Chrome |
Event Timeline
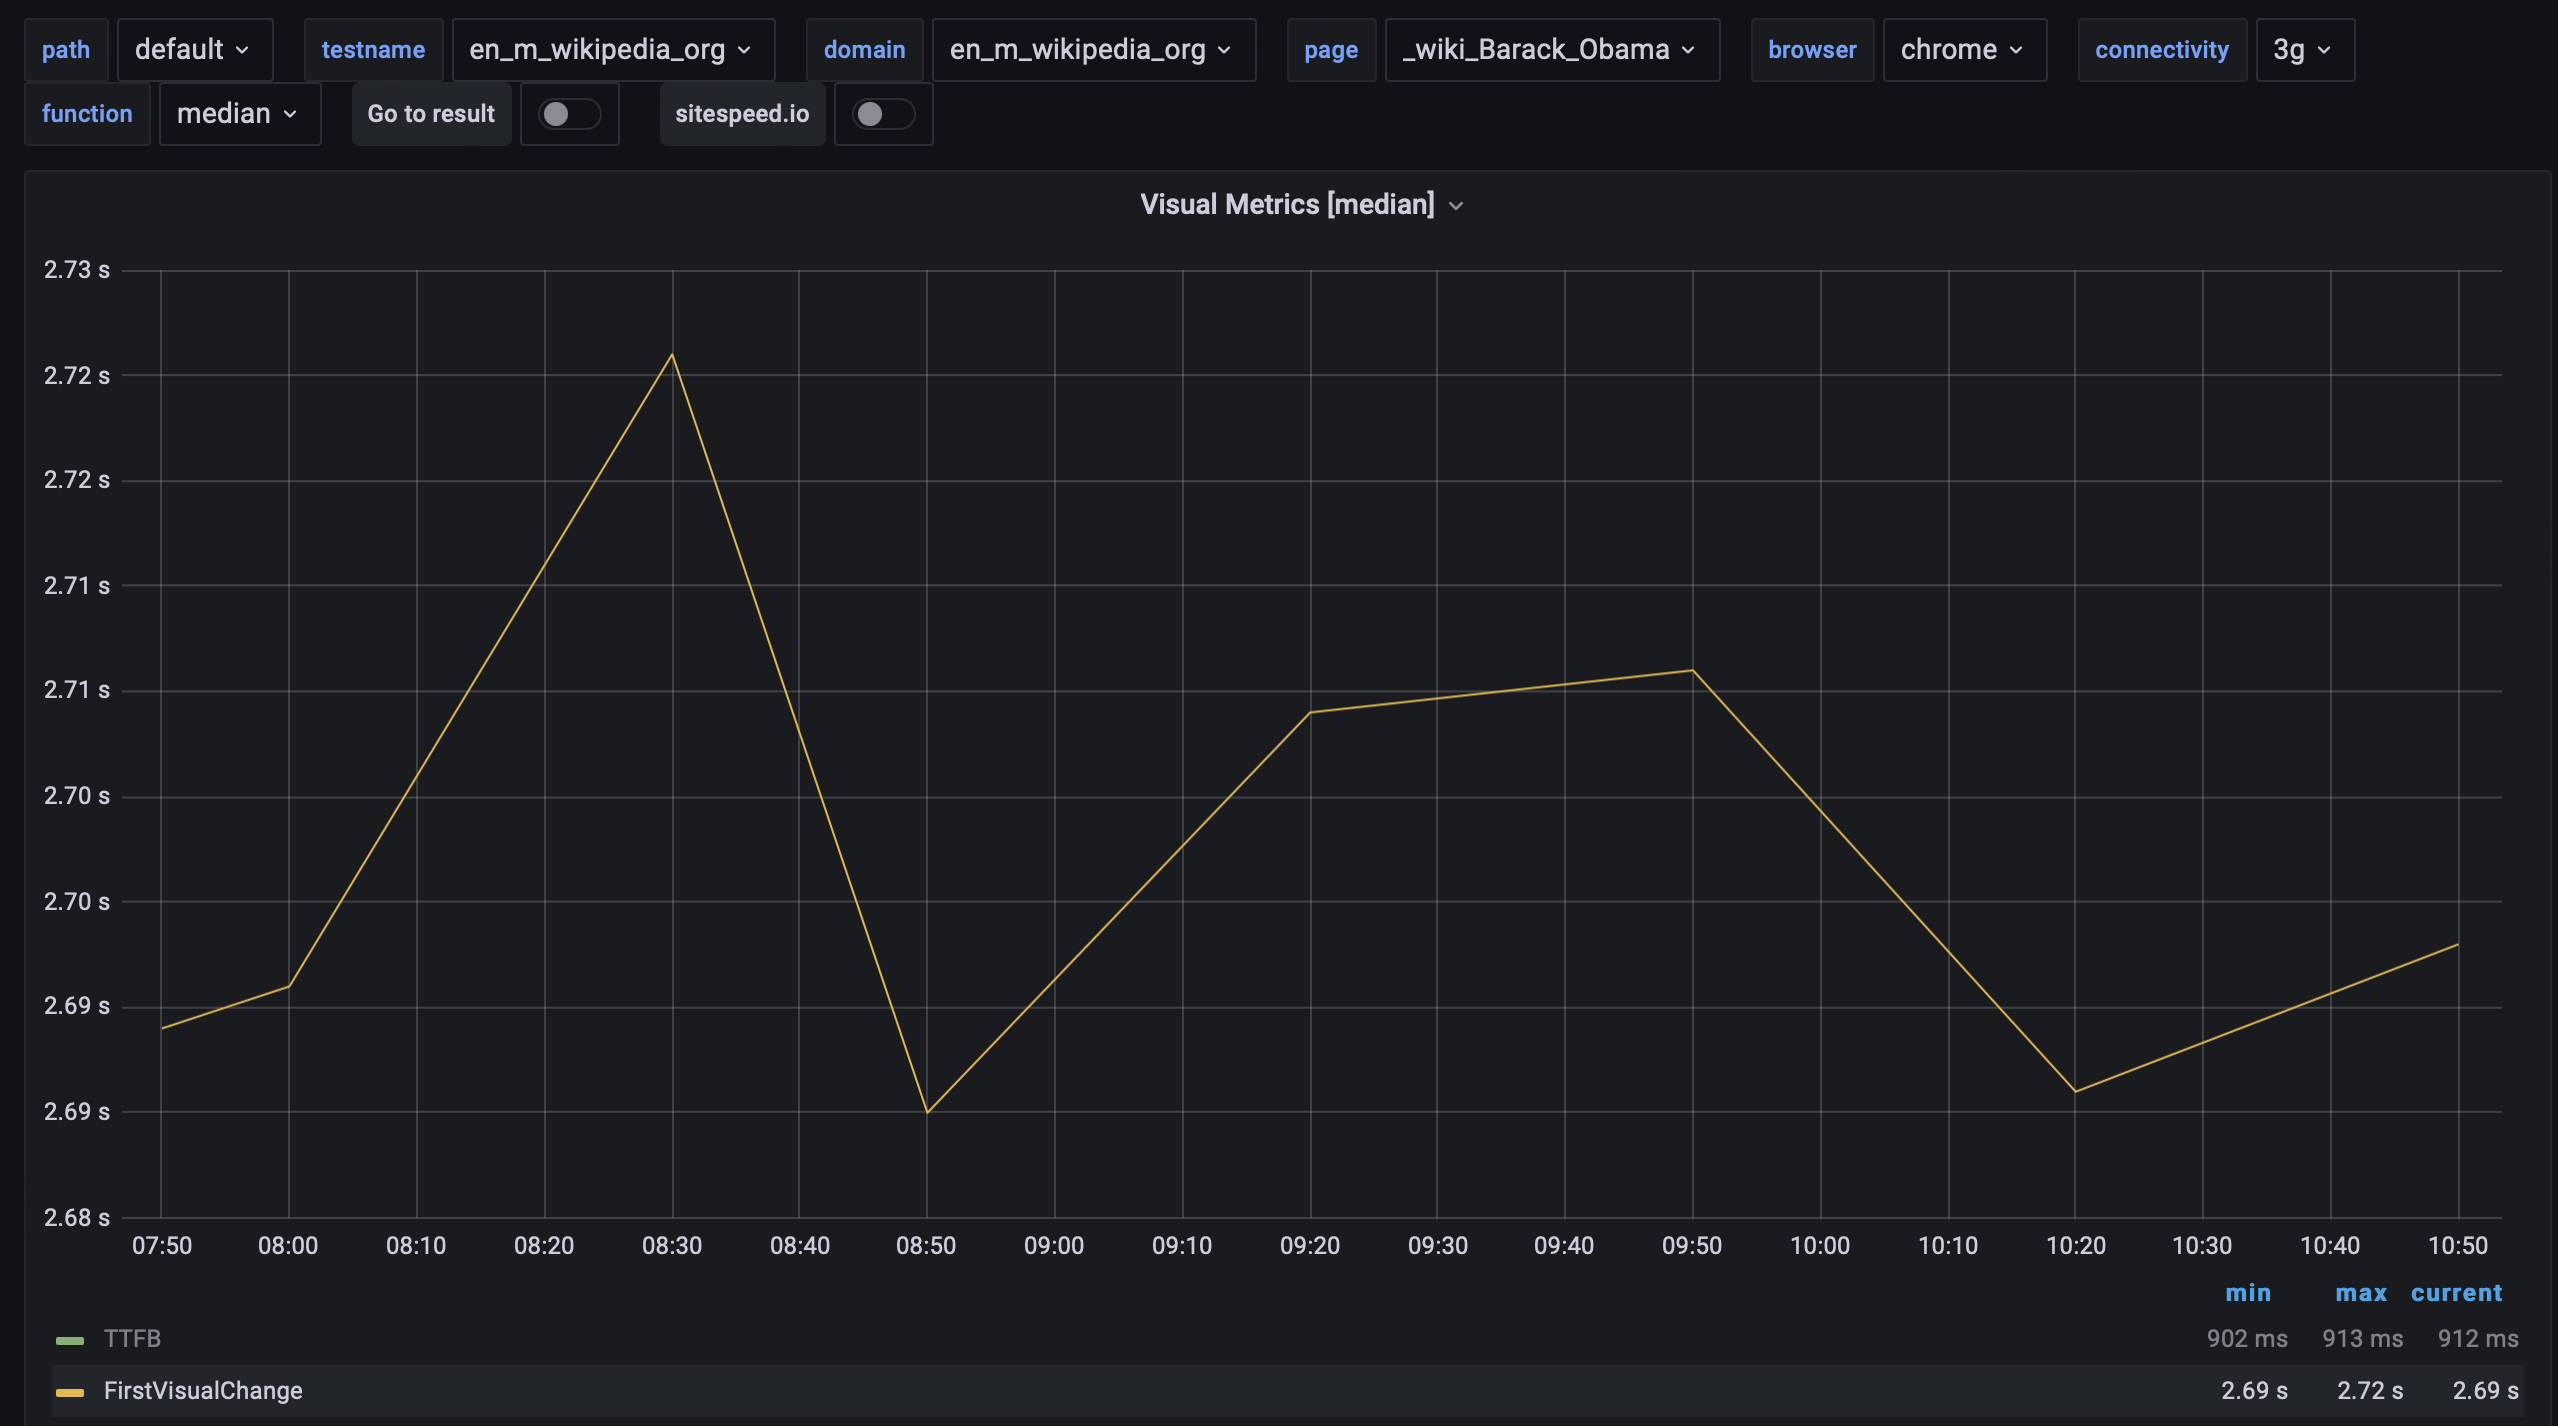
I tried running some tests using Humble Wifi to see what kind of stability we get using 3g.
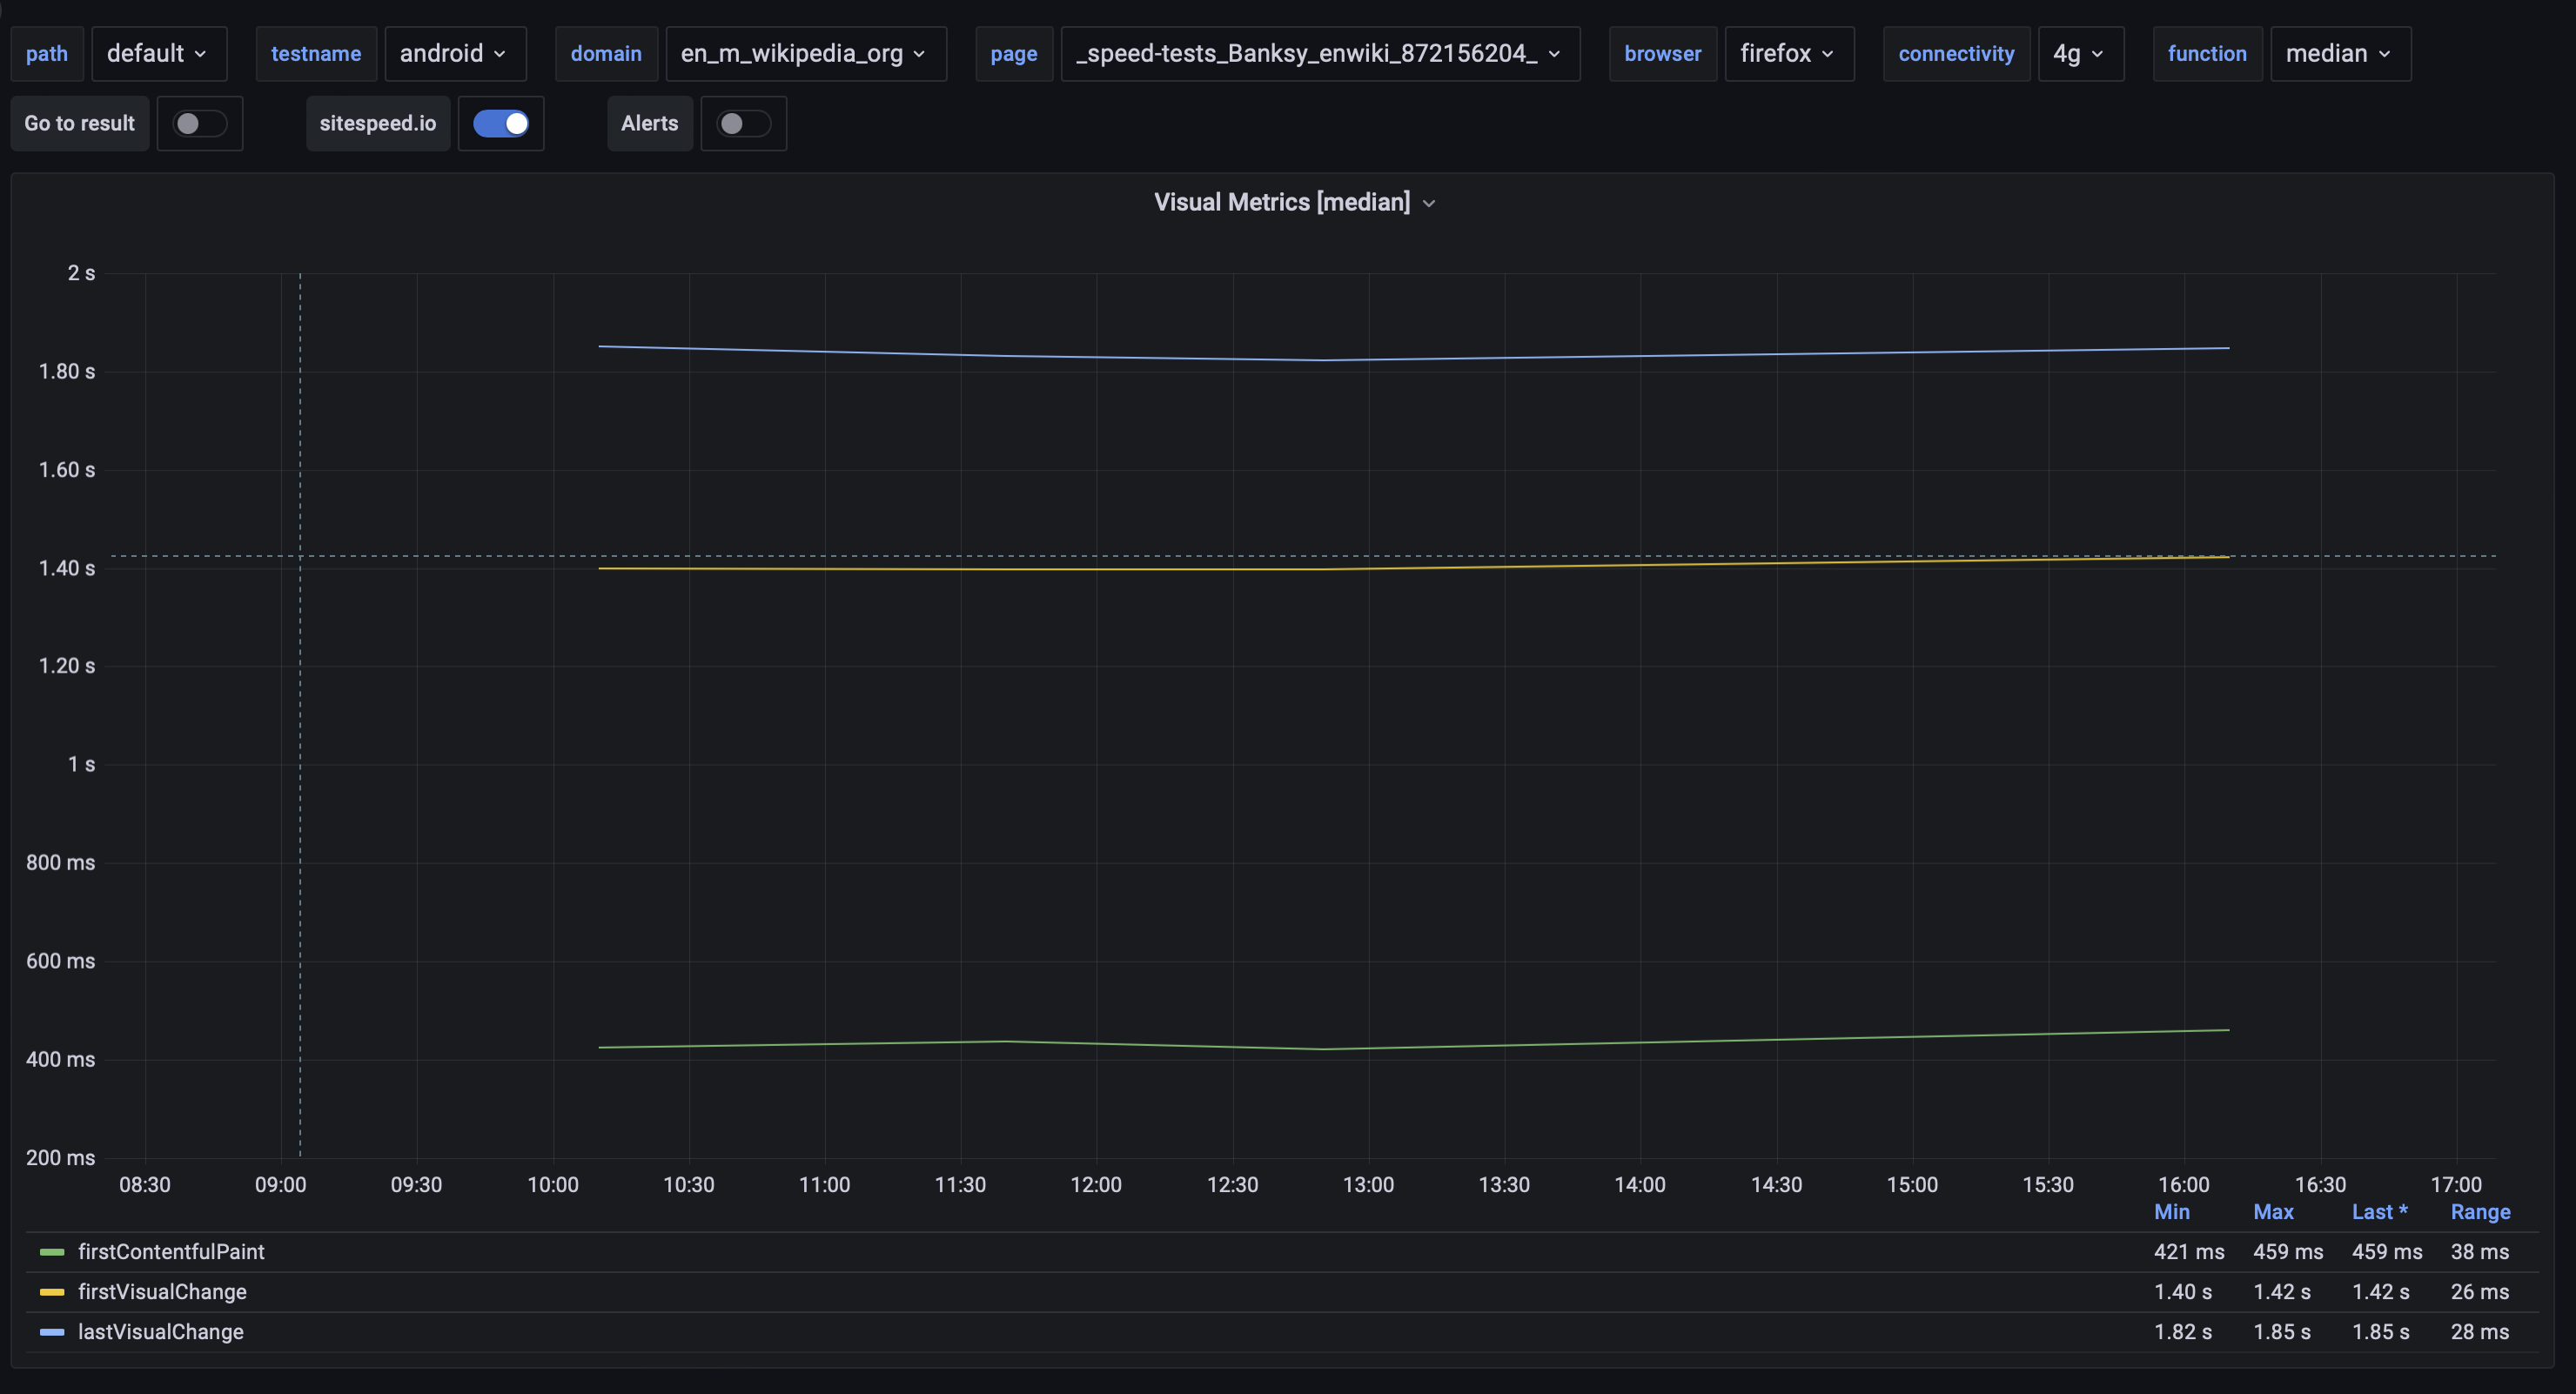
Using 11 runs during a couple of hours gives us pretty good median first visual change:
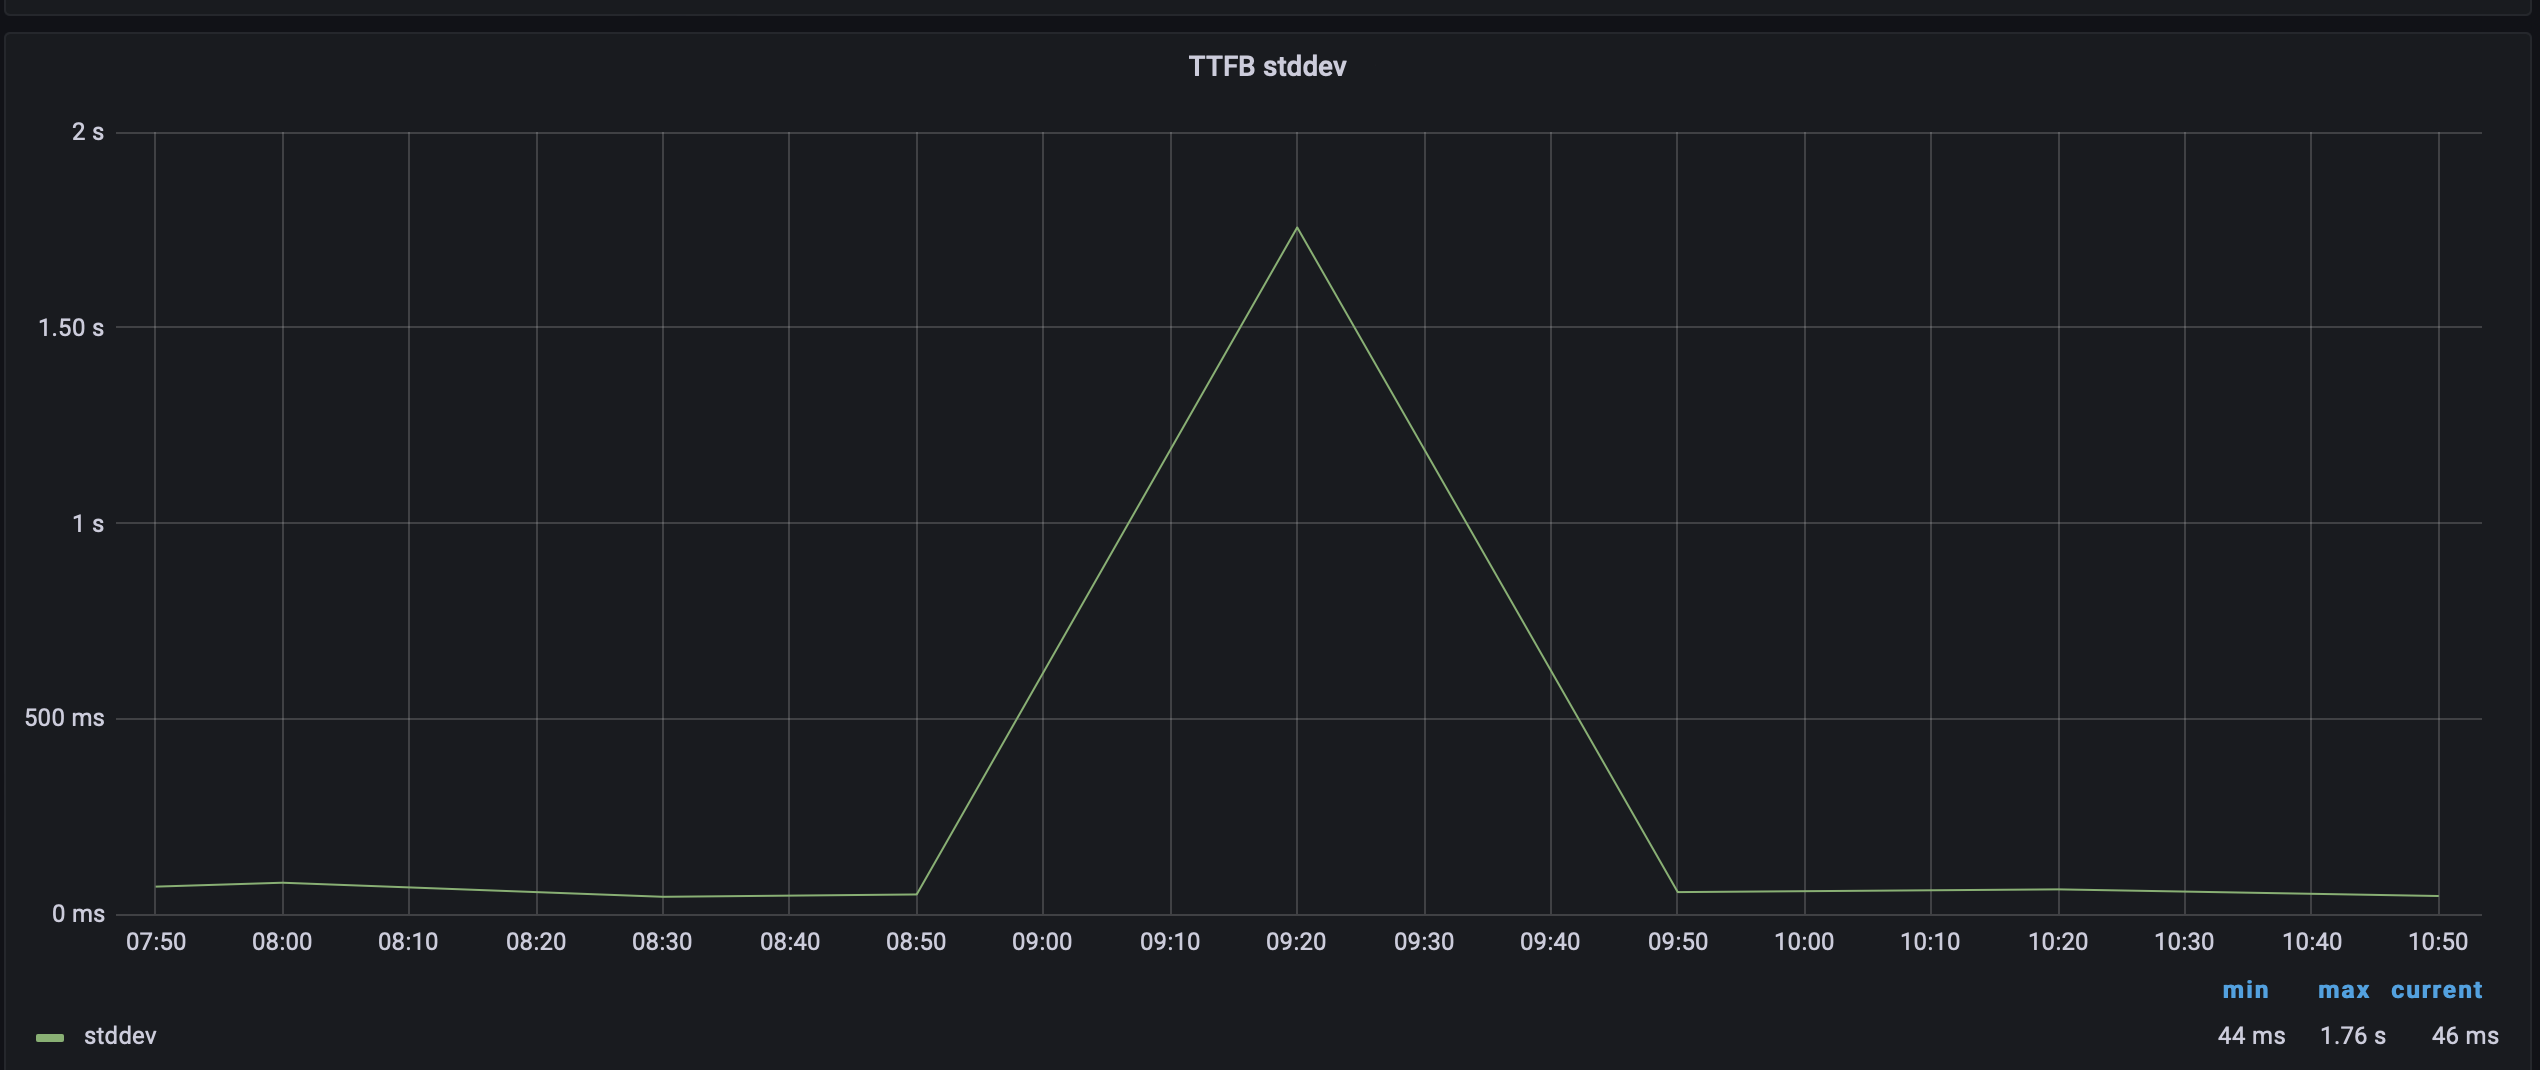
There one time there was a big disturbance of the TTFB, not sure if its because of the WiFi or something else.
I started to run some tests using gnirehtet today, the positive thing is that I didn't get the same as in T274237#6830535 where tests stopped to work. Been running a couple of hundred runs and everything works just fine. For stability of ttfb I need to do more tests.
Been running tests like this:
sitespeed.io https://en.m.wikipedia.org/wiki/Barack_Obama -n 25 --android -c 4g --connectivity.engine throttle -b chrome --browsertime.gnirehtet true
And the result looks like this:
[2022-06-21 12:01:48] INFO: https://en.m.wikipedia.org/wiki/Barack_Obama 29 requests, TTFB: 725ms (σ33.00ms), firstPaint: 1.27s (σ51.00ms), FCP: 1.27s (σ51.00ms), DOMContentLoaded: 1.99s (σ146.00ms), LCP: 1.85s (σ111.00ms), CLS: 0.0681 (σ0.00), TBT: 1.28s (σ116.00ms), Load: 2.35s (σ507.00ms) (11 runs)

[2022-06-21 12:15:49] INFO: https://en.m.wikipedia.org/wiki/Barack_Obama 29 requests, TTFB: 726ms (σ35.00ms), firstPaint: 1.28s (σ39.00ms), FCP: 1.28s (σ39.00ms), DOMContentLoaded: 2.00s (σ83.00ms), LCP: 1.83s (σ160.00ms), CLS: 0.0681 (σ0.00), TBT: 1.26s (σ26.00ms), Load: 2.26s (σ91.00ms) (25 runs)
Never got a fail but need to run it continuously for X hours.
@dpifke here's how I run:
On my desktop computer I run Graphite/Grafana using this Docker compose file. Graphite is configured to manage the same metric every 10 minutes, so there's no win in running tests more often. Then on your computer run docker-compose up to start Graphite/Grafana.
Then on my Raspberry Pi I put gnirehtet in the path and make sure I use sitespeed.io 25.1.1 so that the fix for ip route is included. At the moment I run so that gnirehtet is started automatically from sitespeed.io and I think we also should start it manually so we can check the logs if something fails + make sure that its started correctly from sitespeed.io.
Create a config.json file on you Raspberry Pi that looks like this:
{
  "android": true,
  "slug": "android",
  "graphite": {
    "addSlugToKey": true,
    "host": "192.168.50.76",
    "annotationRetentionMinutes": 10
  },
  "browsertime": {
    "iterations": 11,
    "connectivity": {
      "engine": "throttle",
      "profile": "4g"
    },
    "androidBatteryTemperatureWaitTimeInSeconds": 300,
    "androidBatteryTemperatureLimit": 37,
    "cpu": true,
    "video": true,
    "visualMetrics": true,
    "gnirehtet": true
  }
}
In the host field I added the ip of my desktop computer.
Then on the Raspberry I added a executable run.sh that looks like this:
#!/bin/bash
set -e
LOGFILE=./sitespeed.io.log
exec > $LOGFILE 2>&1
CONTROL_FILE=".run"
if [ -f "$CONTROL_FILE" ]
then
  echo "$CONTROL_FILE exist, do you have running tests?"
  exit 1;
else
  touch $CONTROL_FILE
fi
function control() {
  if [ -f "$CONTROL_FILE" ]
  then
    echo "$CONTROL_FILE found. Make another run ..."
  else
    echo "$CONTROL_FILE not found - stopping after cleaning up ..."
    echo "Exit"
    exit 1
  fi
}
while true
do
	sitespeed.io --config config.json https://en.m.wikipedia.org/wiki/Barack_Obama
	sitespeed.io --config config.json https://en.m.wikipedia.org/speed-tests/Banksy.enwiki.872156204/
	sitespeed.io --config config.json https://en.m.wikipedia.org/wiki/Barack_Obama -b firefox
	sitespeed.io --config config.json https://en.m.wikipedia.org/speed-tests/Banksy.enwiki.872156204/ -b firefox
	rm -fR ./sitespeed-result
	sleep 10m
	control
done
And then run the tests.
nohup ./run.sh & and then I use .run to stop.
Best case this will work out of the box for you.
Then on you desktop computer you can access Grafana on port 3000. There's a couple of ready made dashboards, you can access the most useful one like this: http://127.0.0.1:3000/d/9NDMzFfMk/page-metrics-desktop?orgId=1&var-base=sitespeed_io&var-path=default&var-testname=android&var-group=en_m_wikipedia_org&var-page=_wiki_Barack_Obama&var-browser=chrome&var-connectivity=4g&var-function=median&var-resulturl=resulturl&var-screenshottype=screenshottype&from=now-2d&to=now
Do it after you put some data in Graphite :) Then scroll down on the dashboard and look for "TTFB variation" and you can see two graphs one showing min/median/max and one stddev.
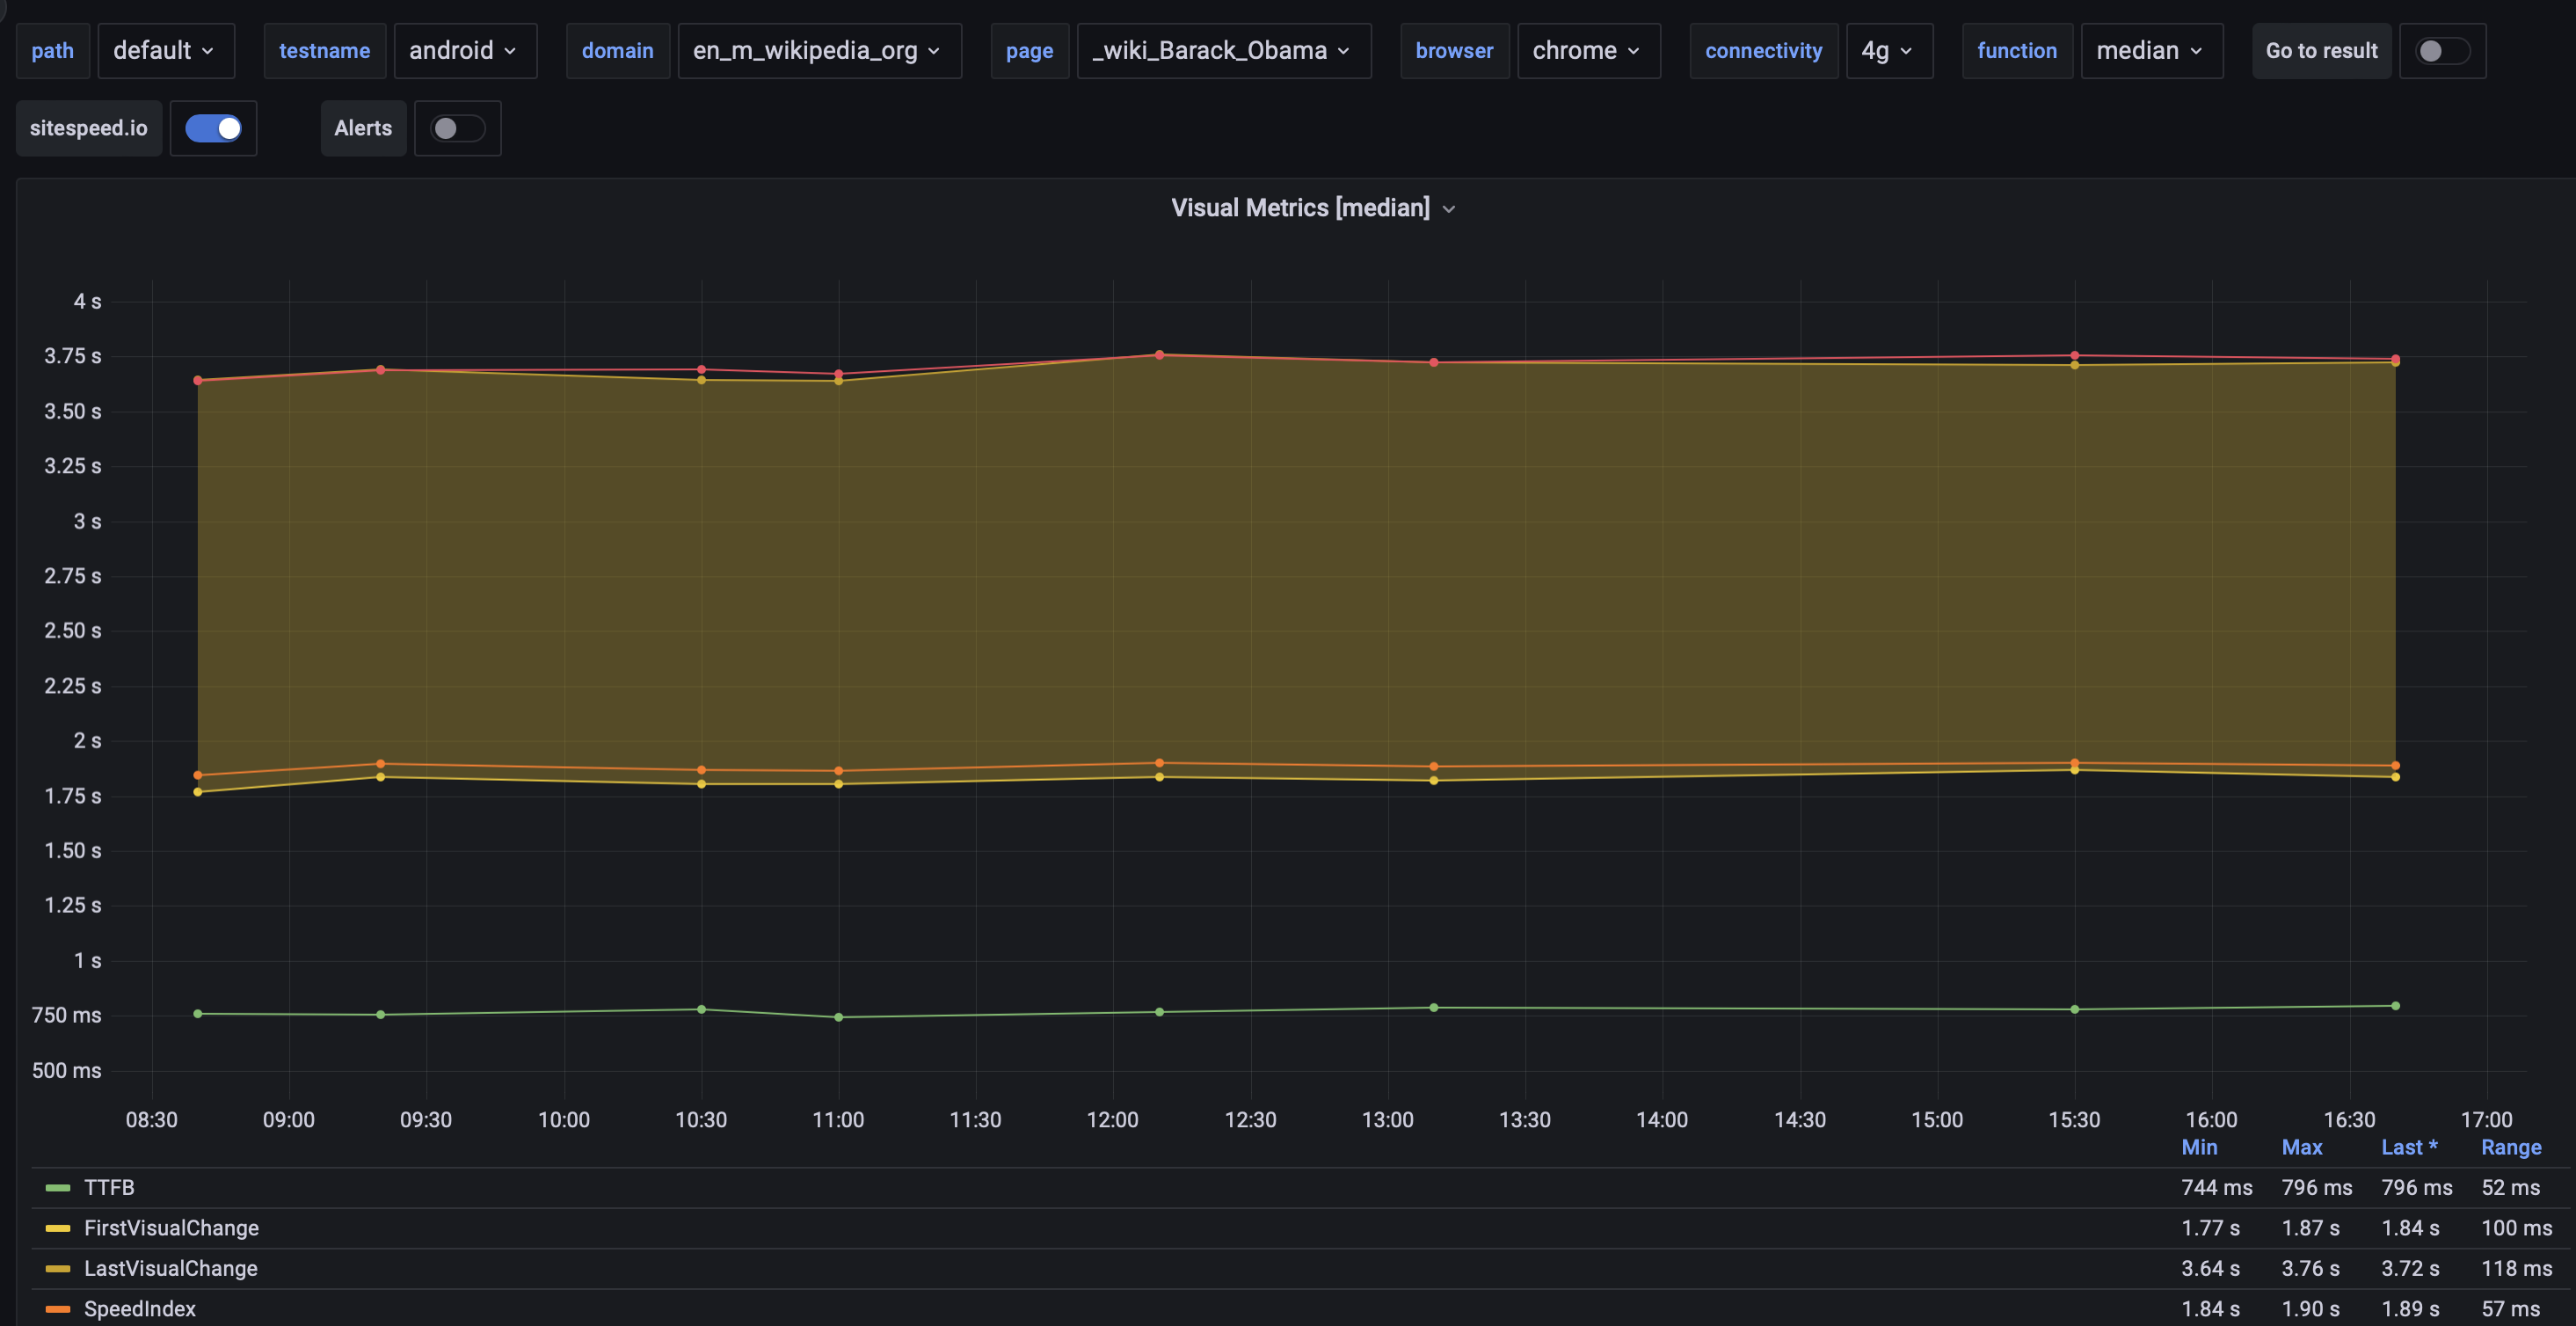
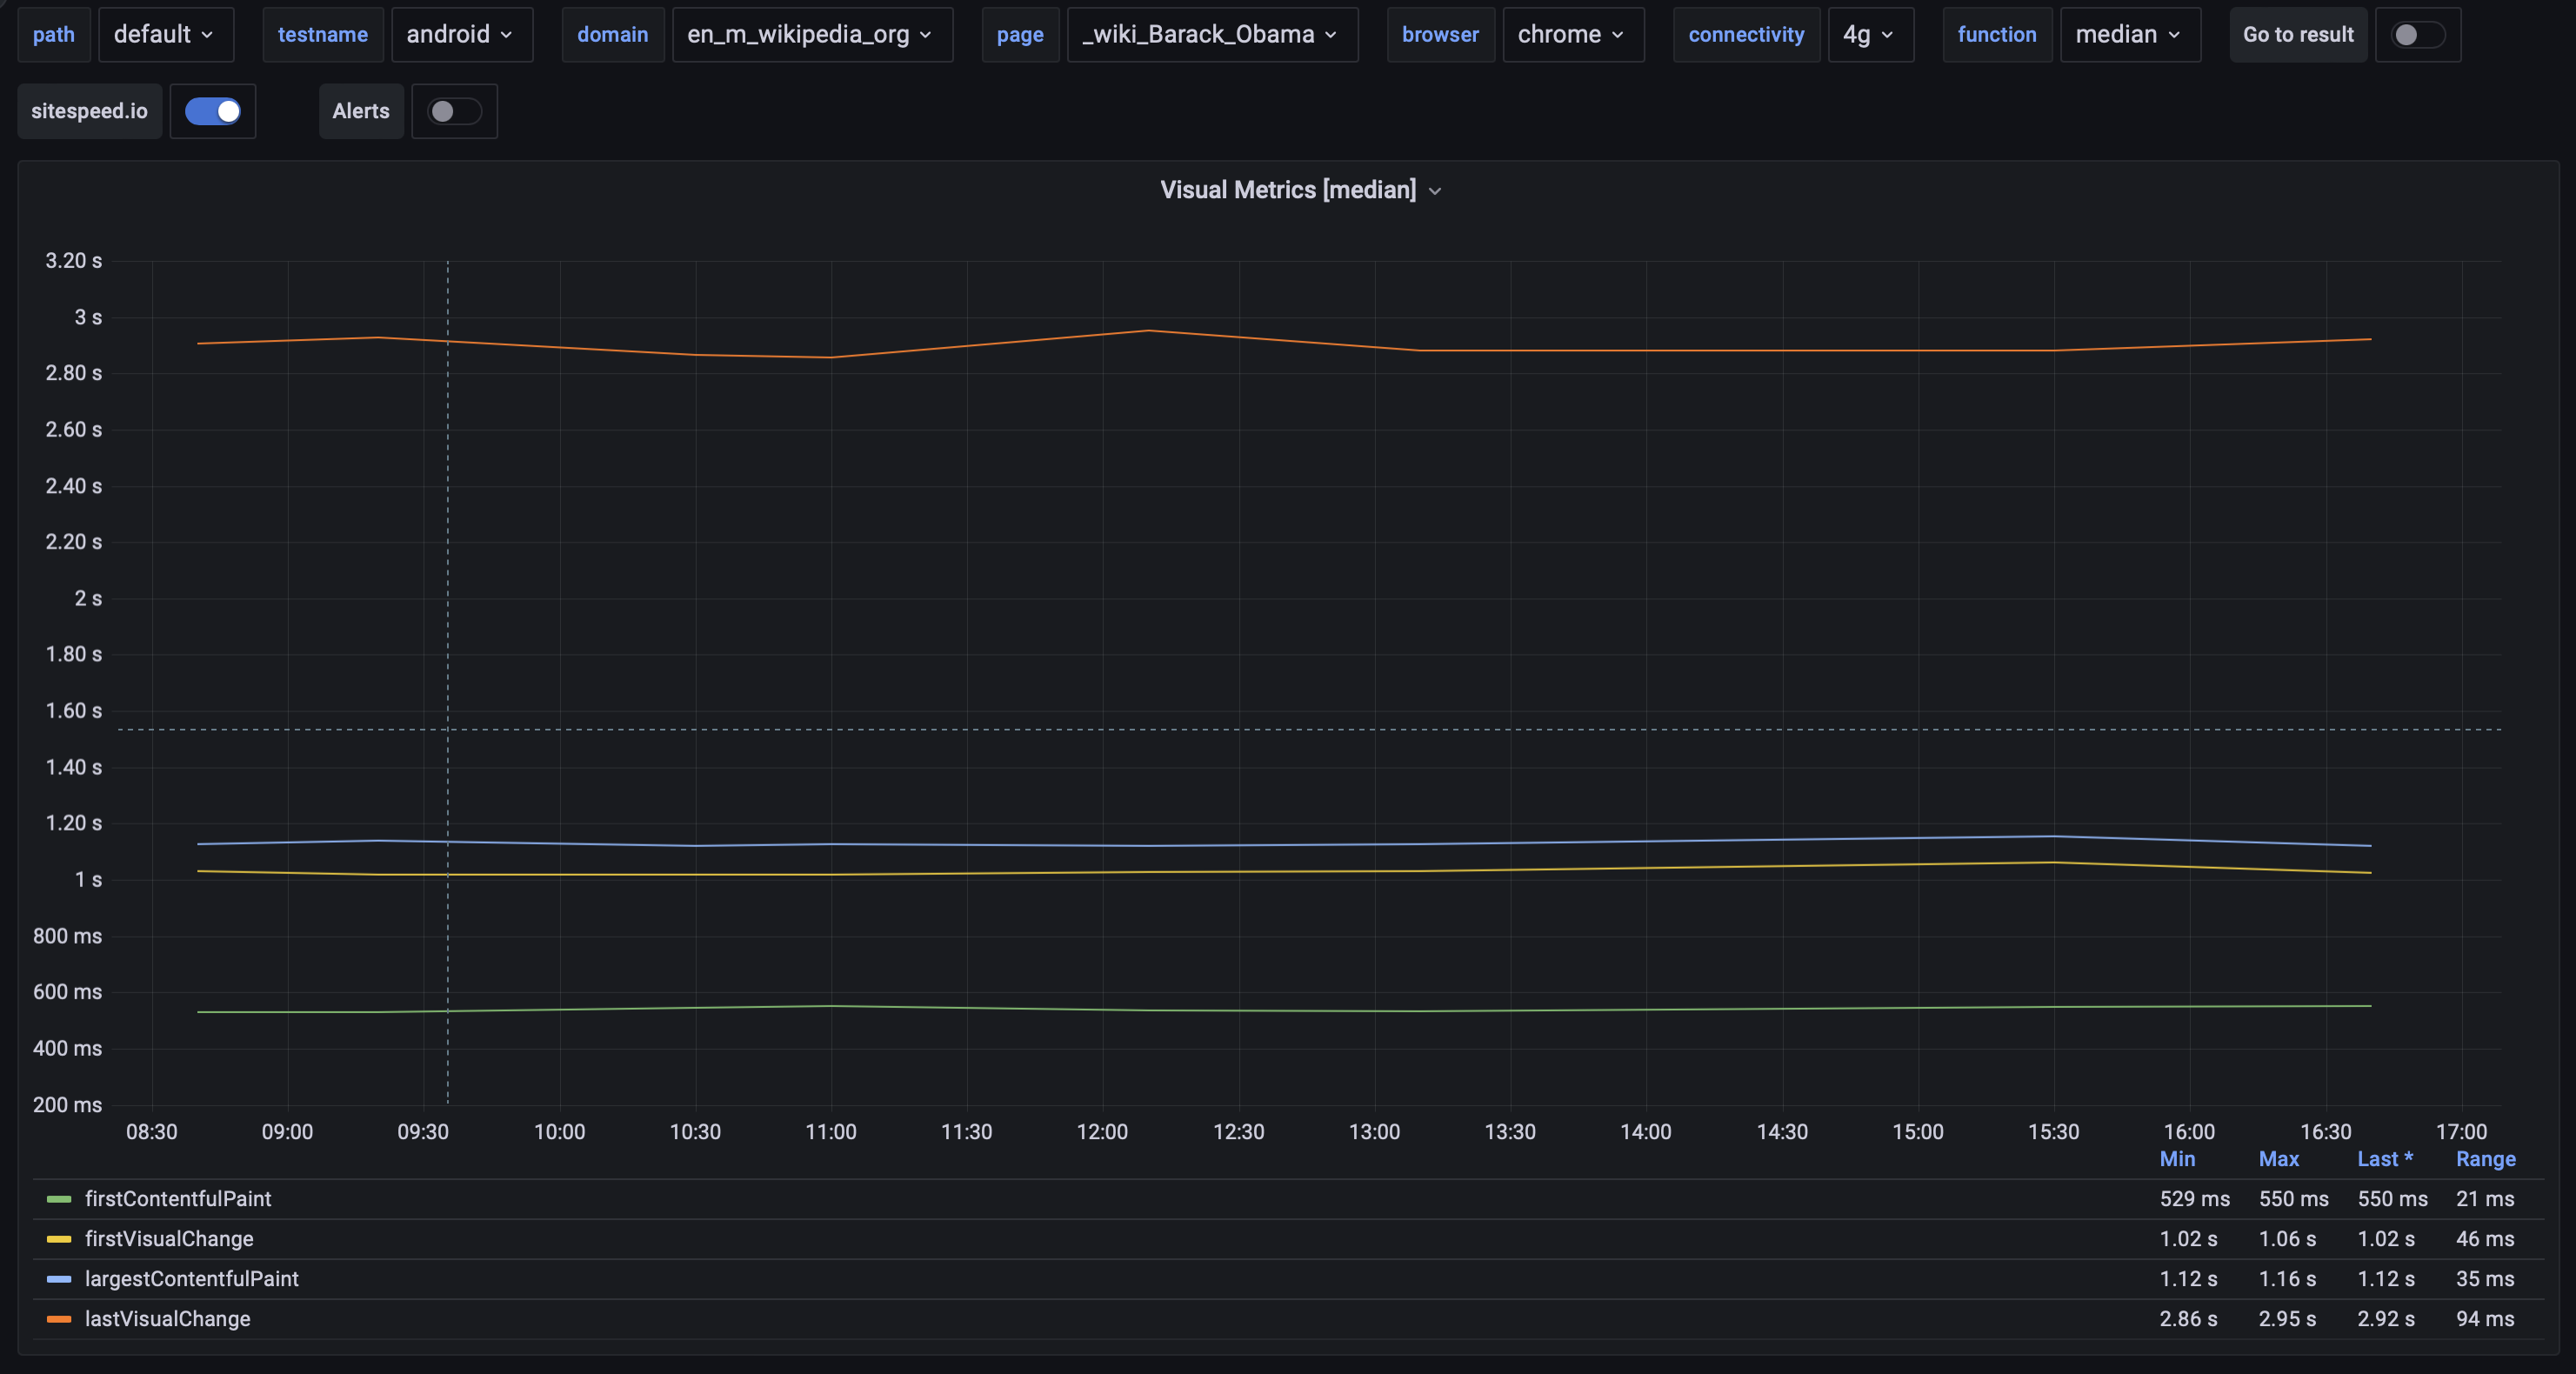
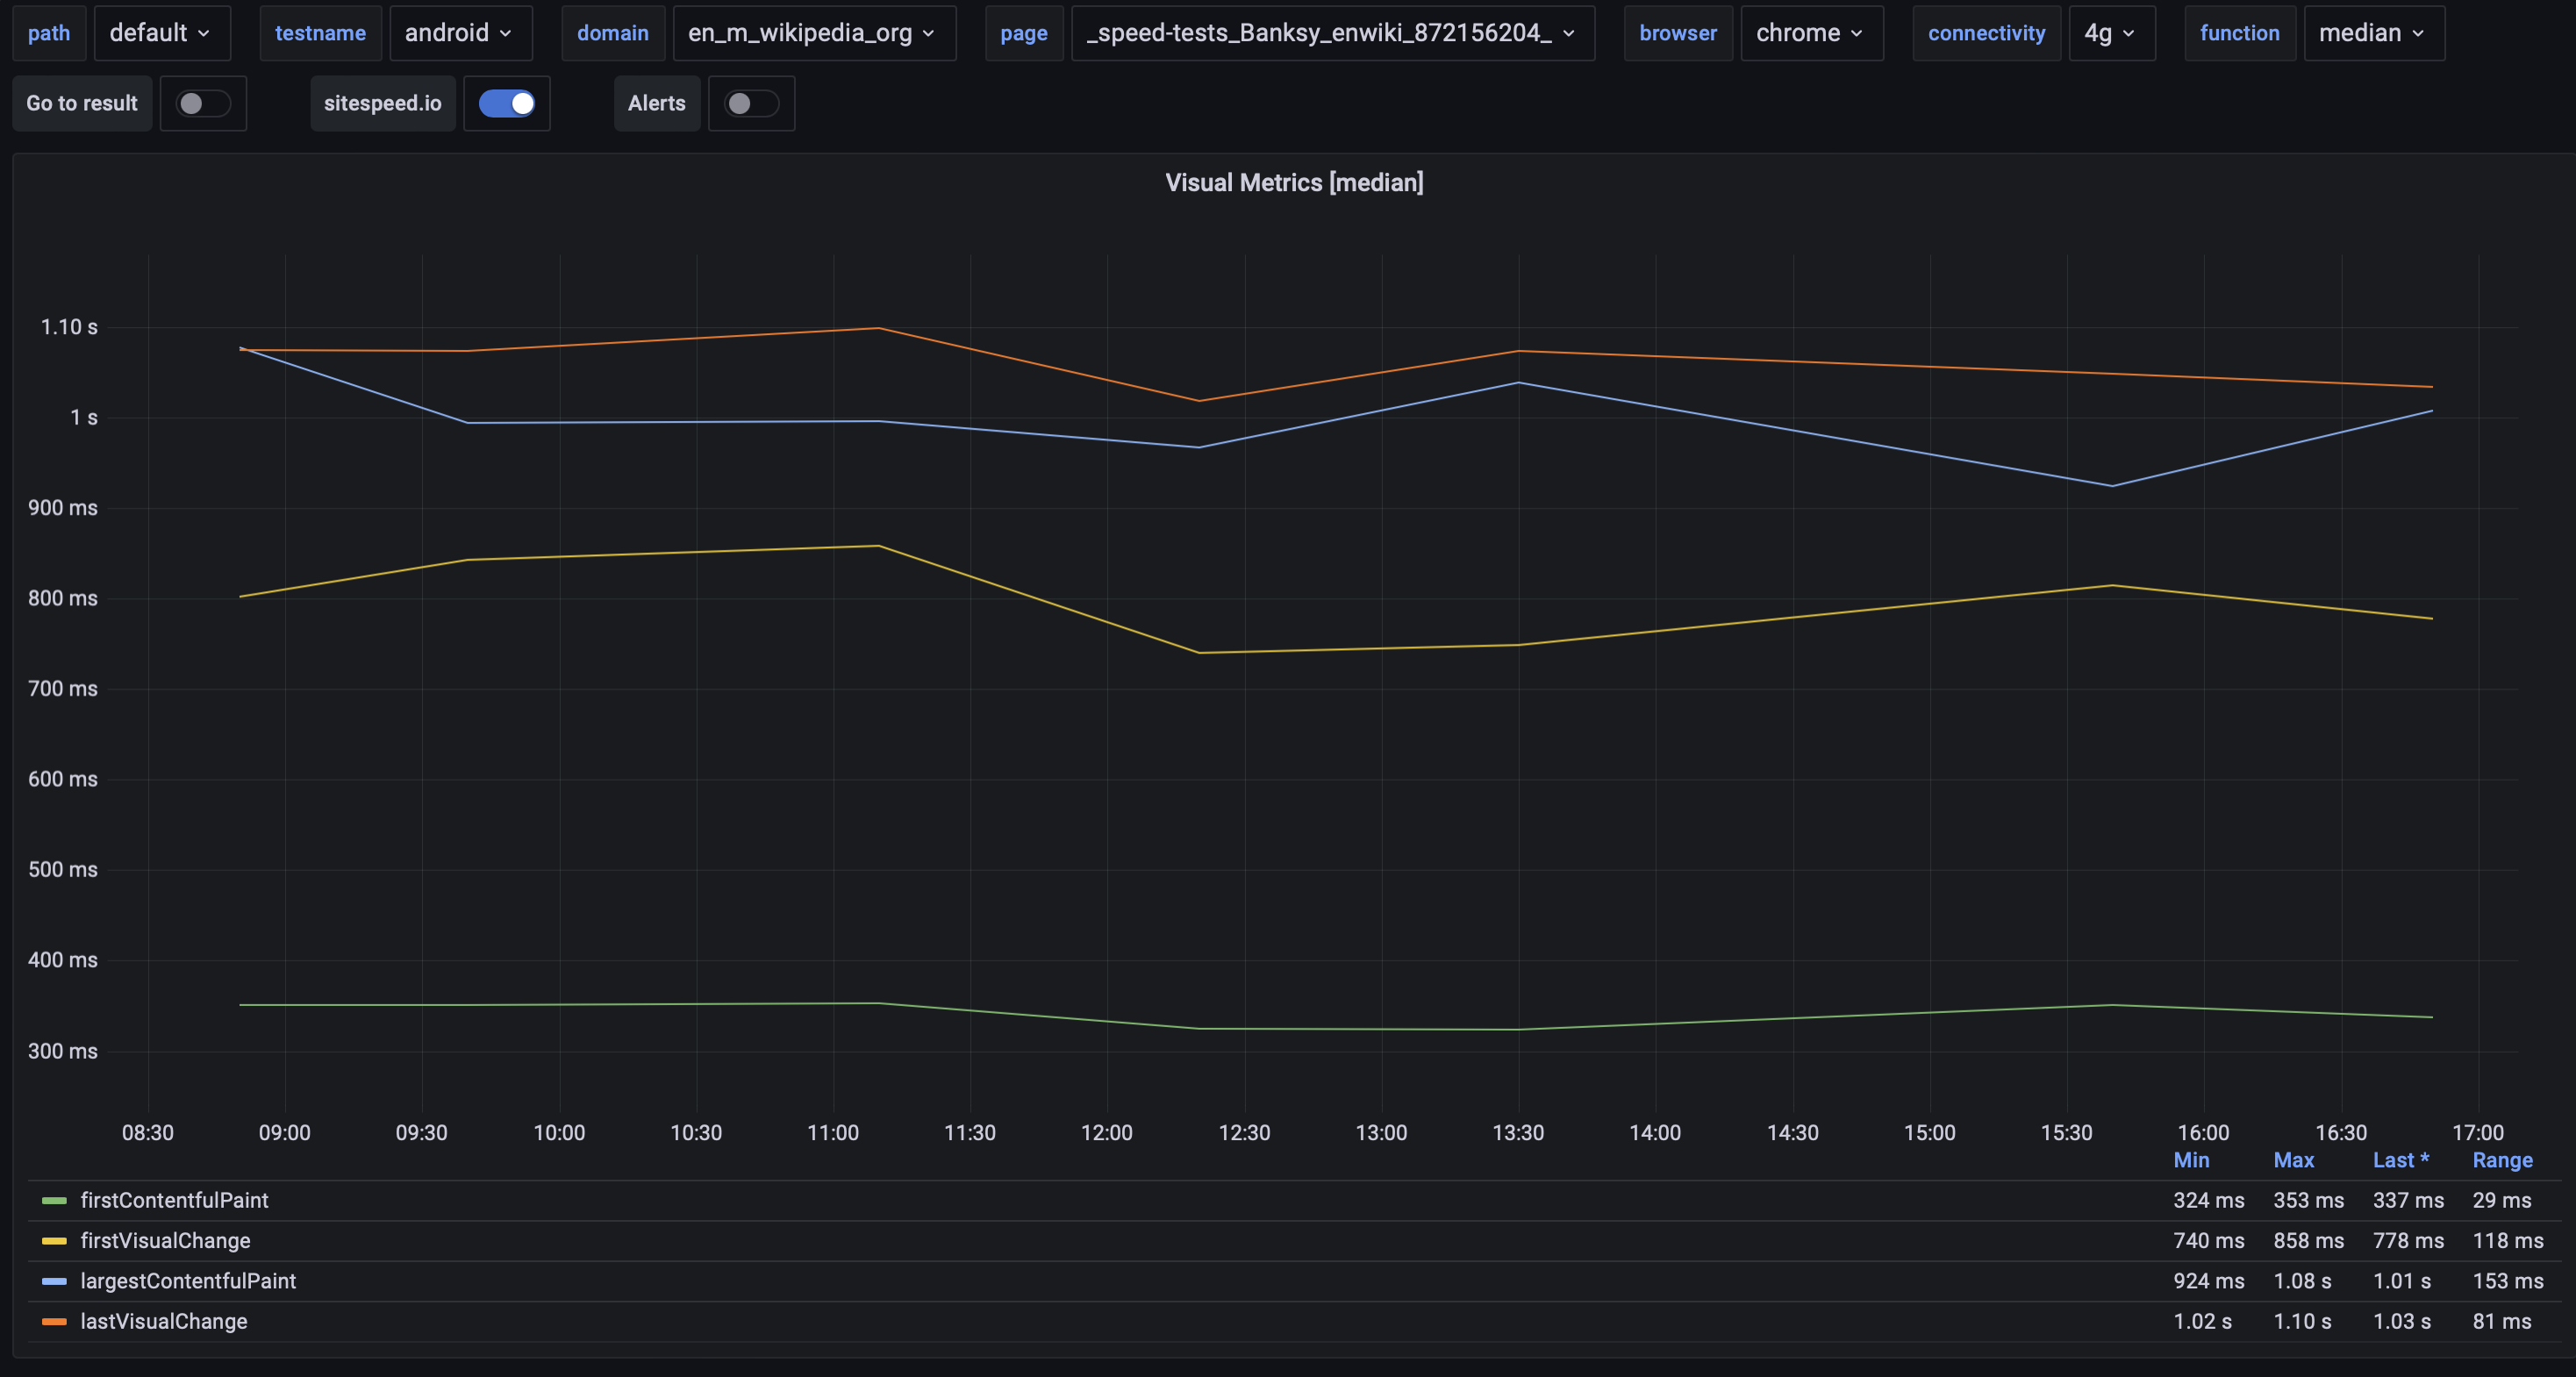
I got some metrics today for Chrome but I'll set it up this weekend or early next week, then I have a unused connection I can use:
{F35264008 width=600}
{F35264013 width=600}
{F35264014 width=600}
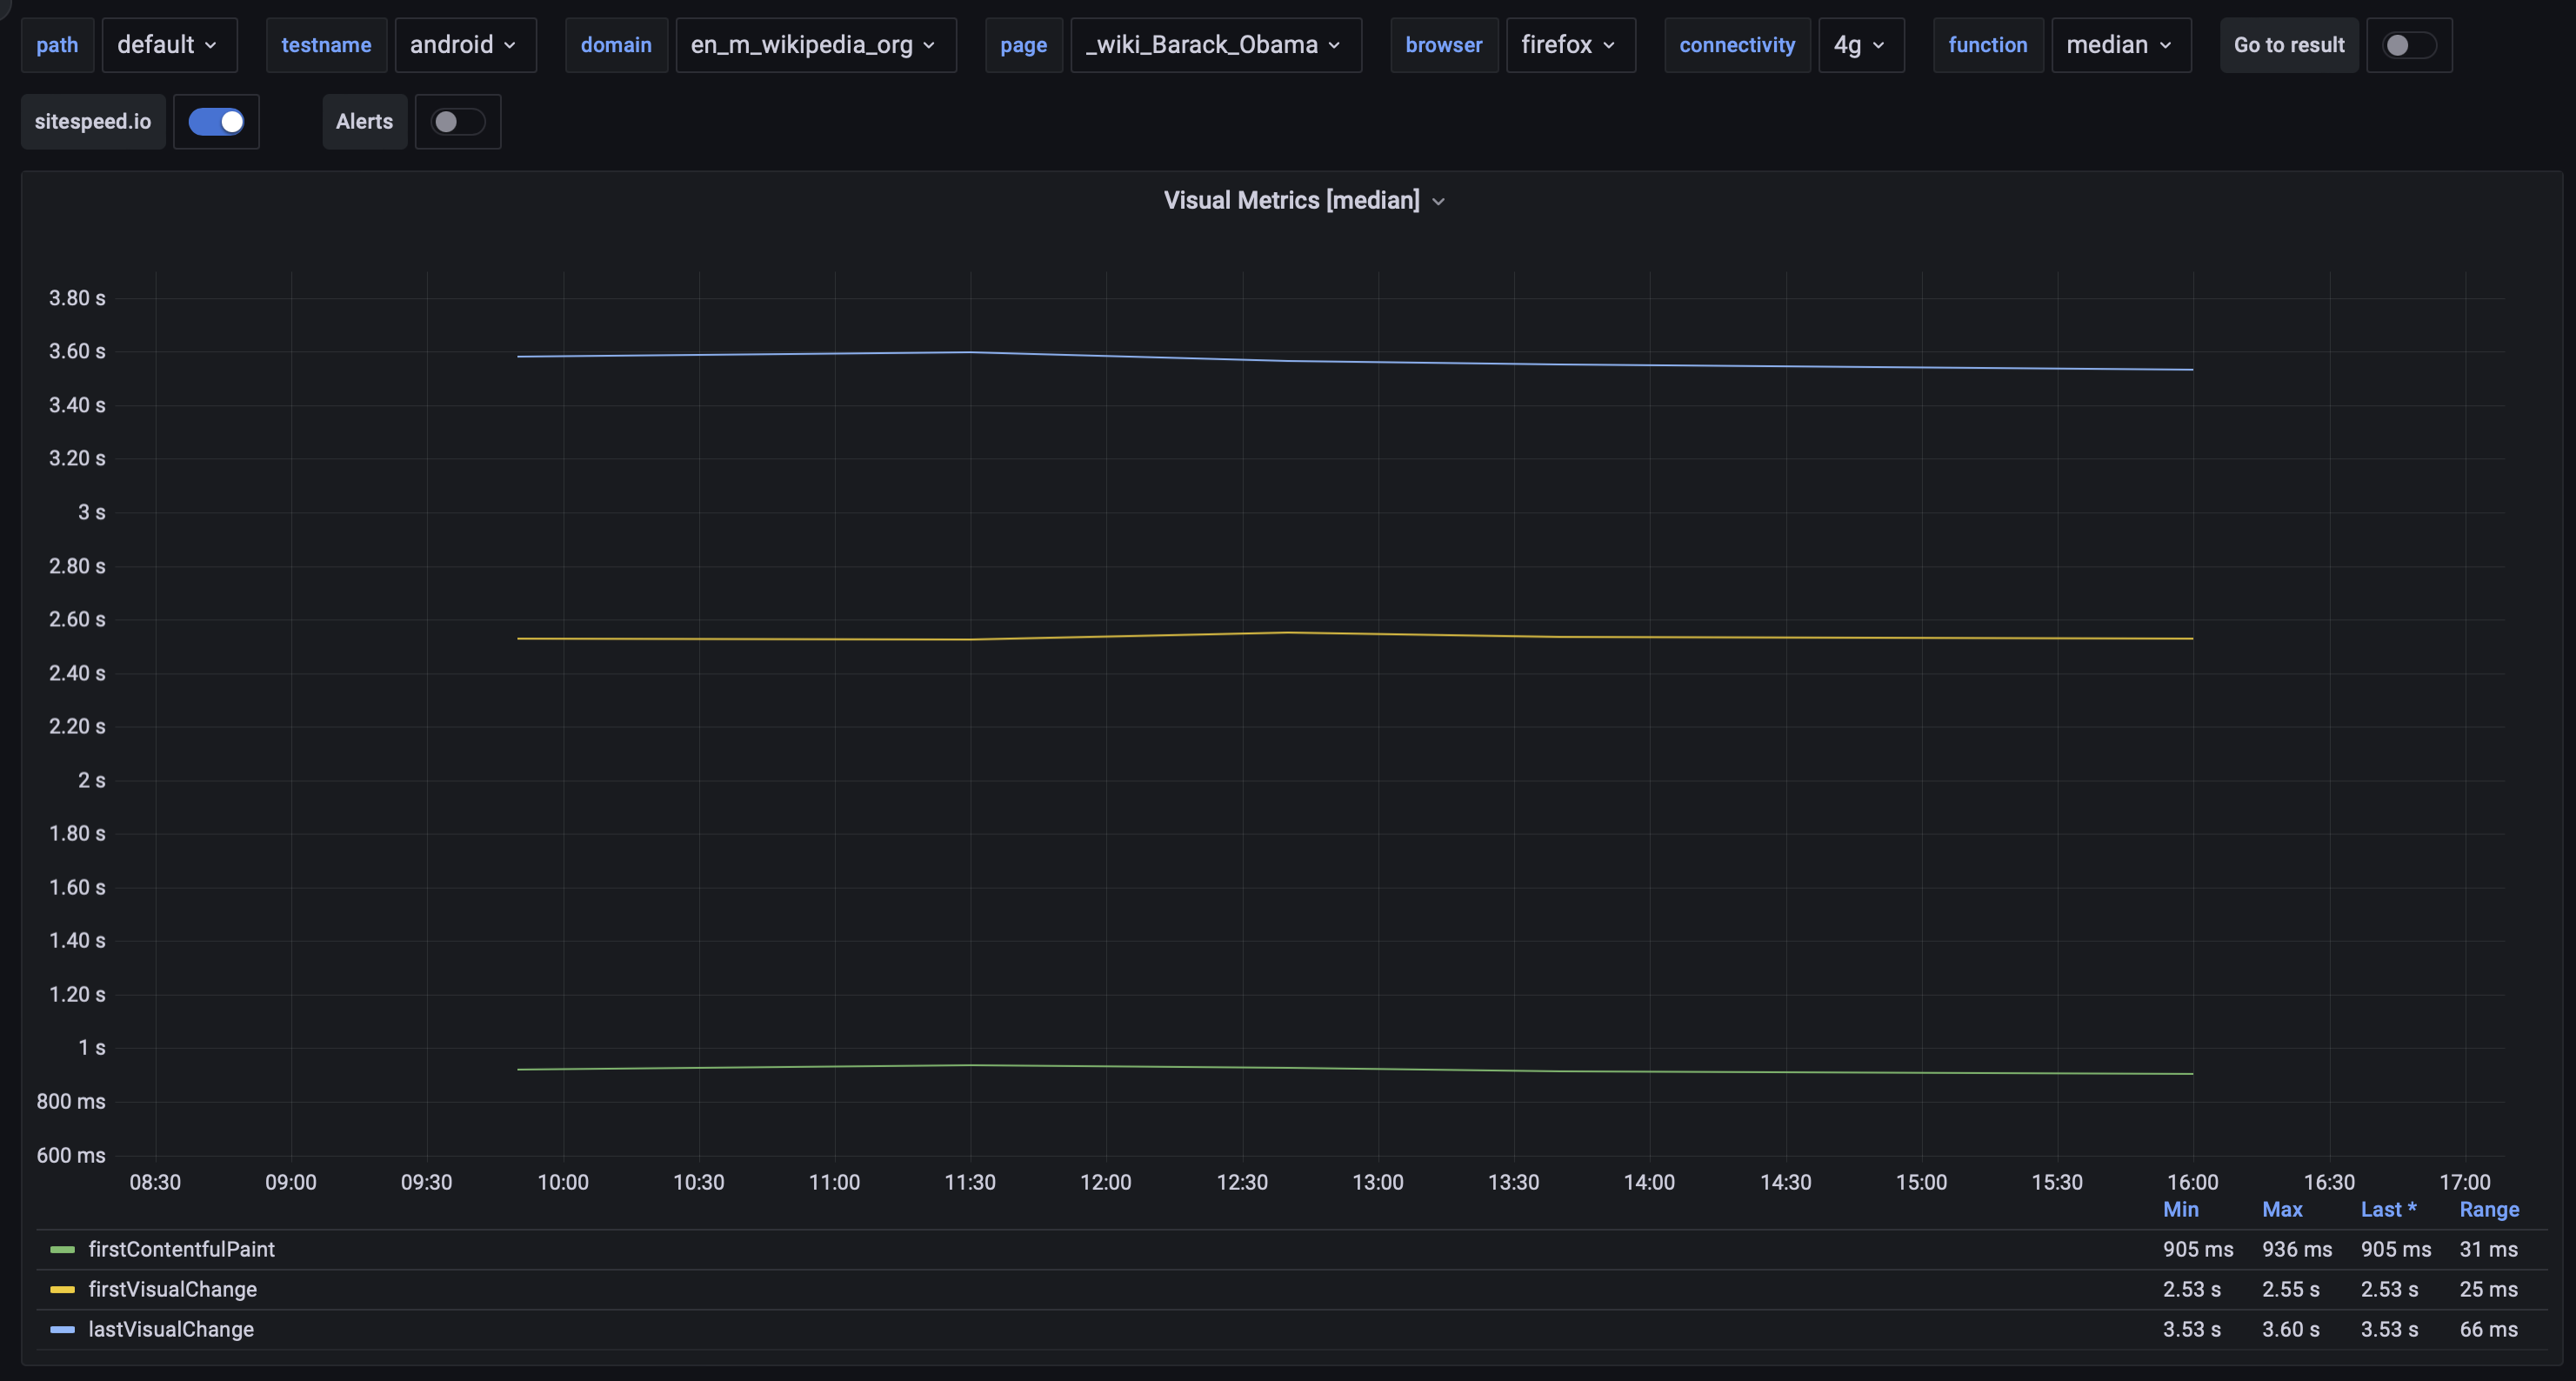
For Firefox the variation is higher (TTFB is measured using the Navigation Timing API):
{F35264037 width=600}
{F35264039 width=600}
{F35264044 width=600}
What's positive is that there where no failures for me that comes from tethering.
I'm running some more tests today and it seems it's better to start gnirehtet separate (I start it through nodejs but it seems there's something I've done wrong) , I'll update https://phabricator.wikimedia.org/T279581#8018799 - I was wrong :)
I'm continuing running the tests today and then I'll post the delta to ttfb metrics. There's a couple of metric that we collect that we subtract the ttfb from to make sure they aren't affected by unstable ttfb.
Here's some data from today
And here is delta TTFB, compared to other tests it looks really good, so we can use it for alerts:
I kept it on for a couple of hours more but it has stopped to work, so we need to keep it running again and see what's going on with that.
@dpifke did you things up and running as in https://phabricator.wikimedia.org/T279581#8018799 ?
