Page MenuHomePhabricator

entity usage dashboards no longer show data [timebox: 4h]
Closed, ResolvedPublic

Description

Problem:
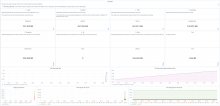
The dashboard at https://grafana.wikimedia.org/d/000000160/wikidata-entity-usage?orgId=1&refresh=5m no longer shows data for a large part of the panels for quite a while now. We should get this back.

Acceptance criteria:

Event Timeline

Restricted Application added a subscriber: Aklapper. · View Herald Transcript
Lydia_Pintscher renamed this task from entity usage dashboards no longer show data to entity usage dashboards no longer show data [timebox: 4h].Apr 28 2021, 10:43 AM

oh I know why this is happening.

This is due to too much branching of metrics. For example. this graph tries to sum over all wikis and all aspects, meaning > 5k metrics for each minute. Branching in metrics (aka verbose metrics) cause this kind of issues. There are ways to mitigate it. We can simply introduce a new metric that is summed up by nature and use that instead.

Change 688216 had a related patch set uploaded (by Ladsgroup; author: Ladsgroup):

[analytics/wmde/scripts@master] Send aggregated entity usage data per dbname and per aspect as well

https://gerrit.wikimedia.org/r/688216

Change 688216 merged by jenkins-bot:

[analytics/wmde/scripts@master] Send aggregated entity usage data per dbname and per aspect as well

https://gerrit.wikimedia.org/r/688216

Change 688305 had a related patch set uploaded (by Ladsgroup; author: Ladsgroup):

[analytics/wmde/scripts@production] Send aggregated entity usage data per dbname and per aspect as well

https://gerrit.wikimedia.org/r/688305

Change 688305 merged by jenkins-bot:

[analytics/wmde/scripts@production] Send aggregated entity usage data per dbname and per aspect as well

https://gerrit.wikimedia.org/r/688305

Addshore subscribed.

Looks good to me!

image.png (1×3 px, 416 KB)