We need to test, given different pod sizes (see T278220), what perfomance do we get from mediawiki on kubernetes.
We can use our own mediawiki performance testing framework for this work.
There are several dimensions to this problem so it will need proper testing; specifically we need to test which combination of:
- N. of php workers per pod
- CPU and Memory limits of the pods
- Round 1: 4000-5000m CPU, 1000-2000Mi mem
- Opcache/apcu size
- Socket or TCP proxying to fcgi
- Will be tested later on as we expect it to scrape a few ms from a single request.
Notes:
- Opcache/apcu sizes will be determined when we have a wider list of urls test, eg replay reads from production
- Regardless of other factors, in production we will probably always observe some latency on k8s vs baremetal. In baremetal, a single request can warm up eg 96 workers on a server for a codepath, while we will need multiple requests to hit different pods to achieve the same result. Pods are more ephemeral, and we will have pods being terminated and spawned constantly.
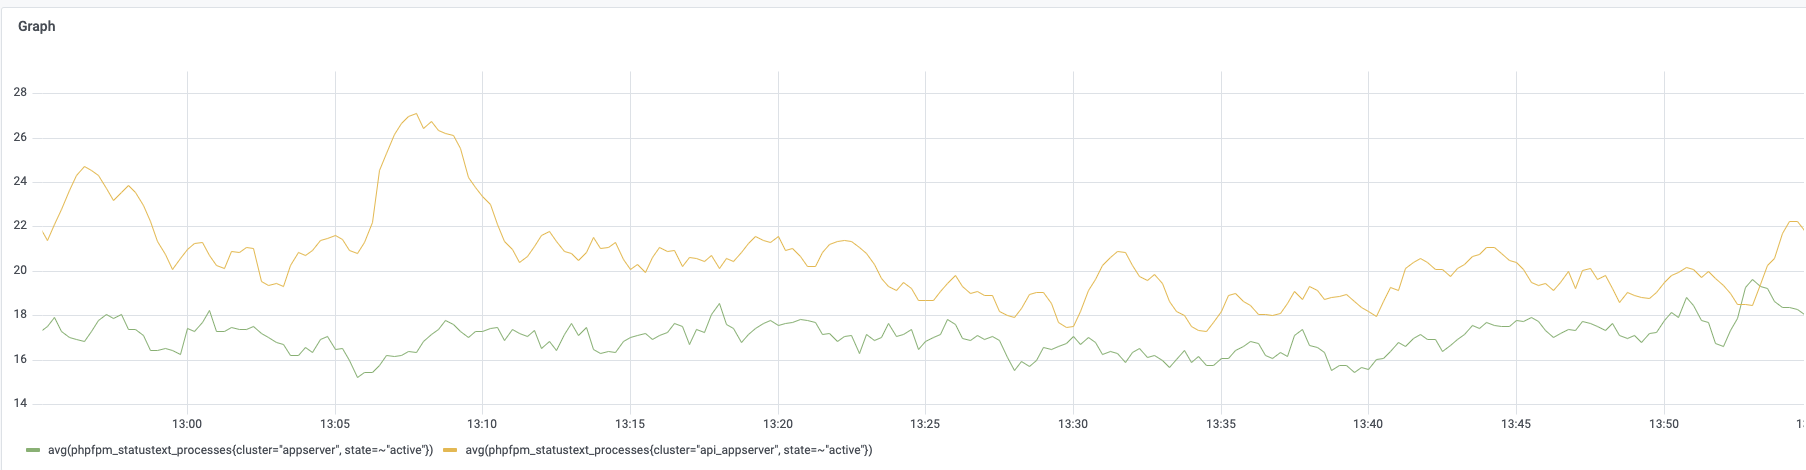
- On average, concurrency is ~12-20 per server https://grafana.wikimedia.org/goto/7k4VvbS7z
Our goal is to get the same performance (within reasonable limits) at all concurrencies with the ones of the appserver. I would also suggest we get in touch with Performance to ask for other URLs they think we should benchmark.
Single request profiling
Another thing we should check is what is faster and what is slower on kubernetes; one way to test this is the following:
- Disable the timer doing the automatic deployments to mediawiki on deploy1002 for the duration of the test
- Deploy mediawiki to k8s using the latest mediawiki-multiversion-debug image https://docker-registry.wikimedia.org/restricted/mediawiki-multiversion-debug/tags/, that includes tideways and so it's able to send profiling data to xhgui
- Run profiling request on k8s and one mwdebug server at the same time, after some warmup of the cache on both (basically request the same page twice without profiling, then grab a profile)
- Check for big differences in the results - functions that require much more time on k8s in order to run
Again for this test we can use the set of URLs we use in mwbench, but we should also reach out to performance to ask them if they see other stuff that should be tested.
Methodology and Testing
Original plan:
In order to be able to compare results with production, we will need to reserve one kubernetes node for mediawiki only, run as many pods on it we can given their size, then run our testing framework https://gerrit.wikimedia.org/g/operations/software/benchmw on mwdebug.discovery.wmnet on the HTTP port (8444), and on one appserver in the active datacenter, so prepared:
- should have similar hardware (esp. cpu) to the kubernetes node
- depooled from traffic
- php-fpm has been restarted before starting the tests
Round 1: mw2254 vs k8s, TLS enabled, 12 pods x 8 workers
Tideways-xhprof: generally increases request times, while we already know that mediawiki's performance on VMs is poorer, so in order to get a more informative profile, we selected a random production appserver where we temporarily installed tideways-xhprof. Addtionally we run ab tests with both tideways enabled and disabled.
mw2254 re-parsing profile: https://performance.wikimedia.org/xhgui/run/view?id=613b33ac1d2b2a8ba4f624bf
k8s re-parsing profile: https://performance.wikimedia.org/xhgui/run/view?id=613b33ea1e630124211e665e
Hardware: Given than mw2254 is a 2016 server where almost all kubernetes nodes in codfw were purchased after 2017, we didn't put an limitations as to where a pod can be spawned (except a server having an SSD disk T288345). We didn't observe any kubernetes node being under pressure, so we saw no need to assign mediawiki on specific nodes
TLS::The caching layer is talking to our app layer via TLS, for that reason, we chose to use TLS at least for this round of tests.
Pods specs:
- 96 workers (12 pods x 8 workers, mw2254 has 96 workers configured as well)
- PHP: opcache.size=500M, opcache.interned_strings_buffer=50M, apc.size=400M
- CPU: 4000-5000m, MEM: 1000-2000Mi
Fixes:
- There was added latency due to mediawiki failing to reach etcd via its ipv6 addresses 719278
- Kubernete's p99s were unreasonably high, due to instantaneously hitting max CPU 720324
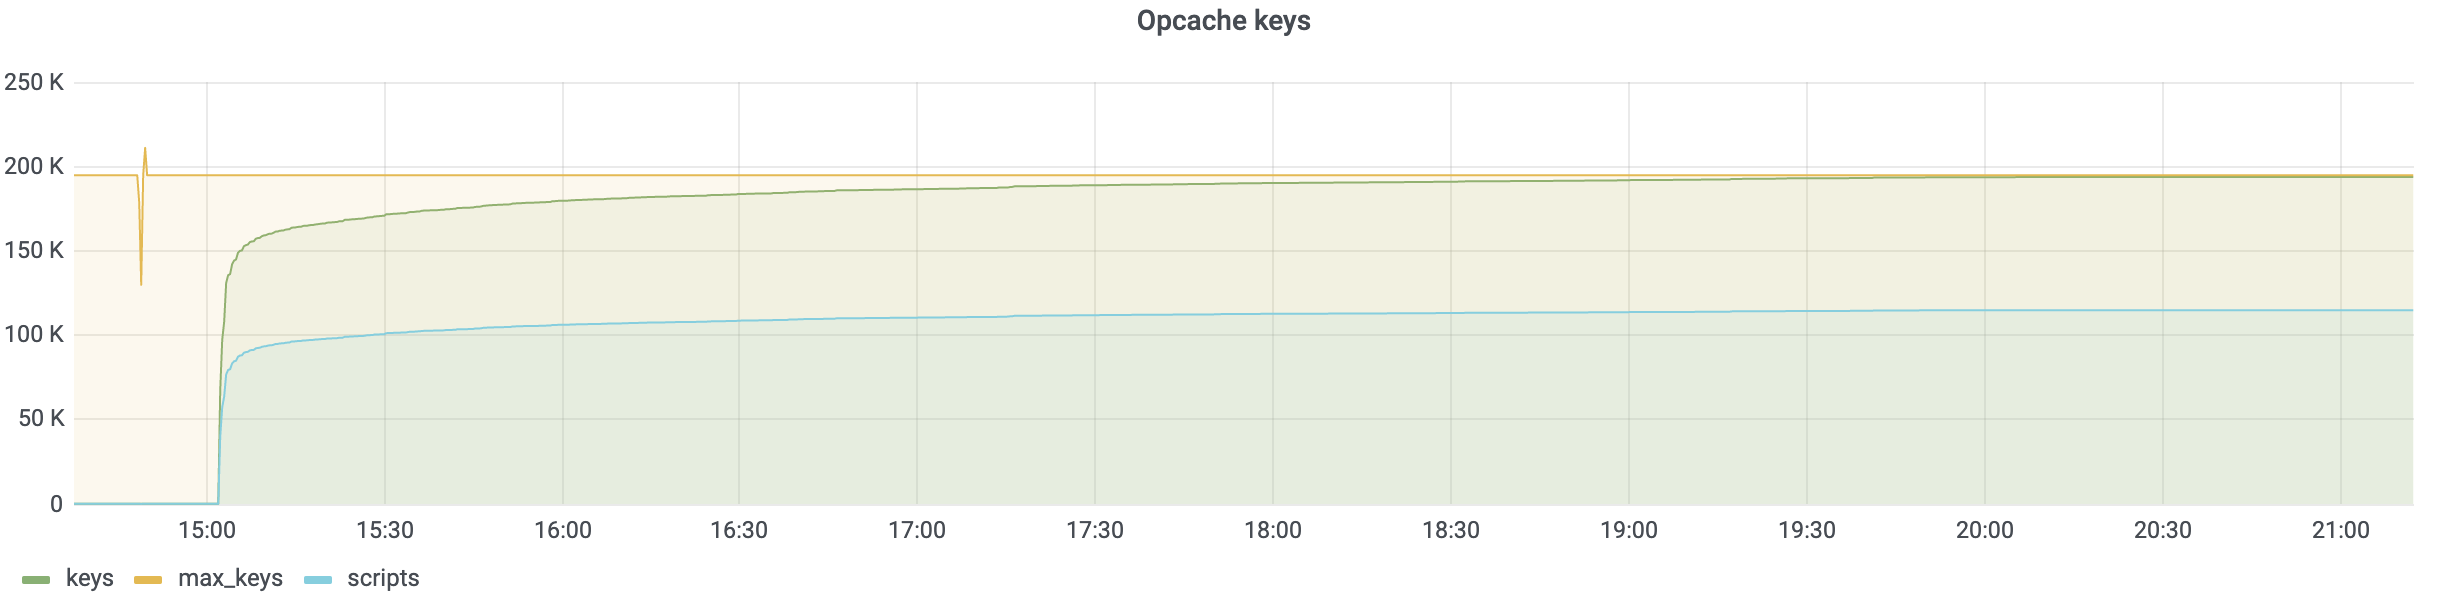
- Interned string buffer needed was at least 12MB and we used the default of 10MB 720188
- Increased opcache max_accelerated_files (nofiles)
- increased APCu size to 768M
- increased app container memory limit
Extra tests:
Run a benchmark with 6 pods (=48 workers), and observe if higher concurrency per pod (thus, per master process), affects the results for concurrencies c=10, c=15, c=20.- Get a profile for each URL we are testing both for k8s and baremetal if needed
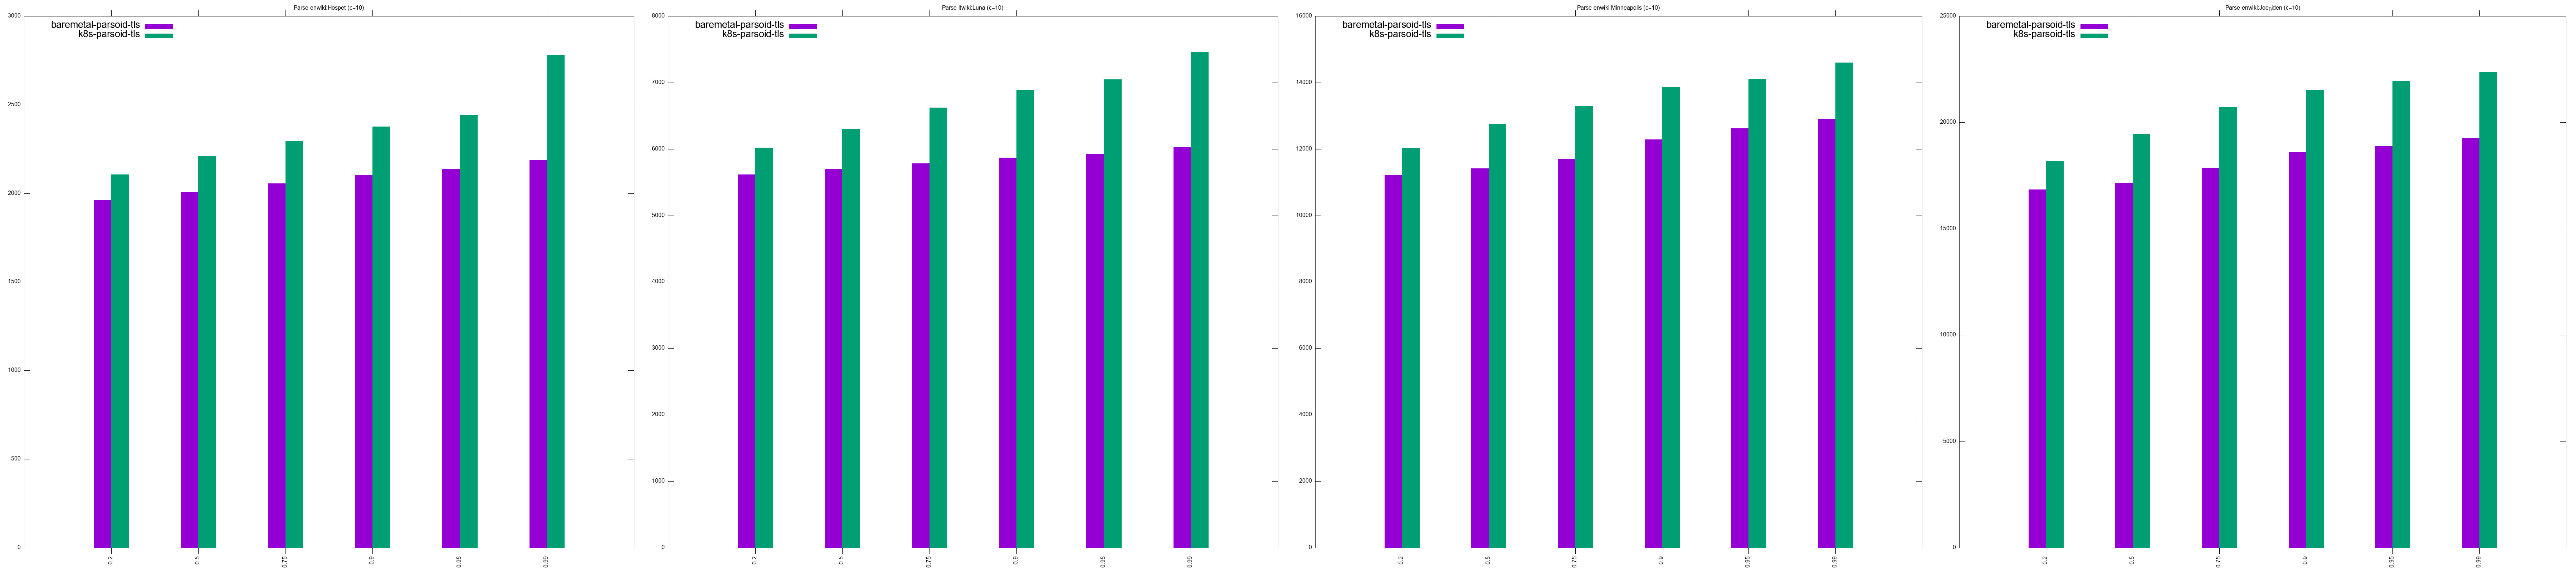
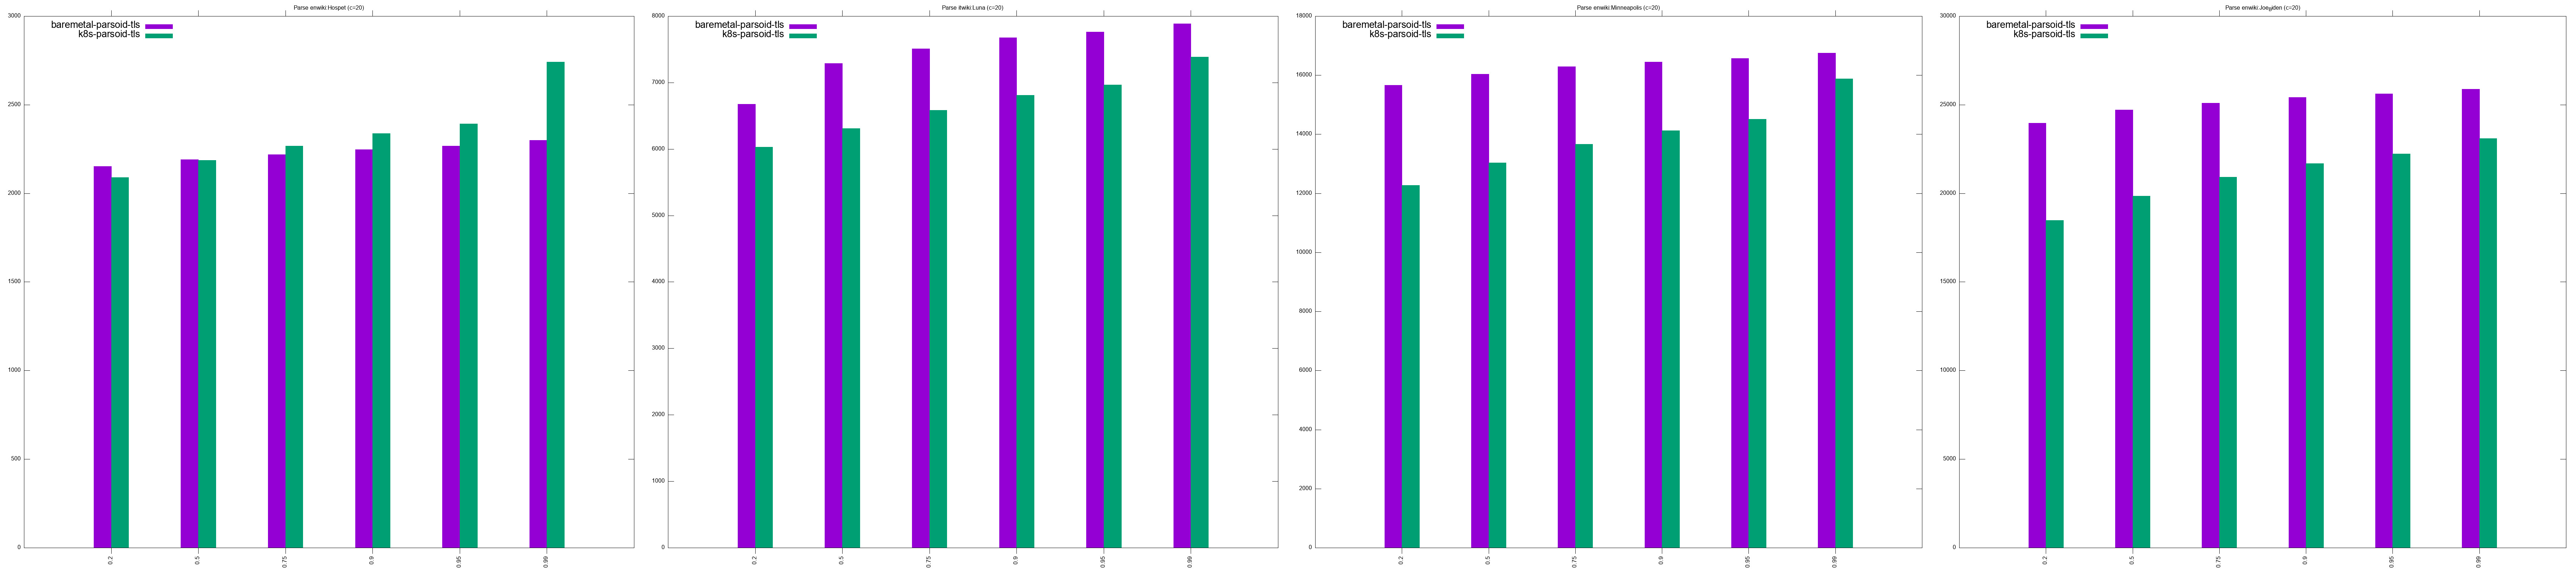
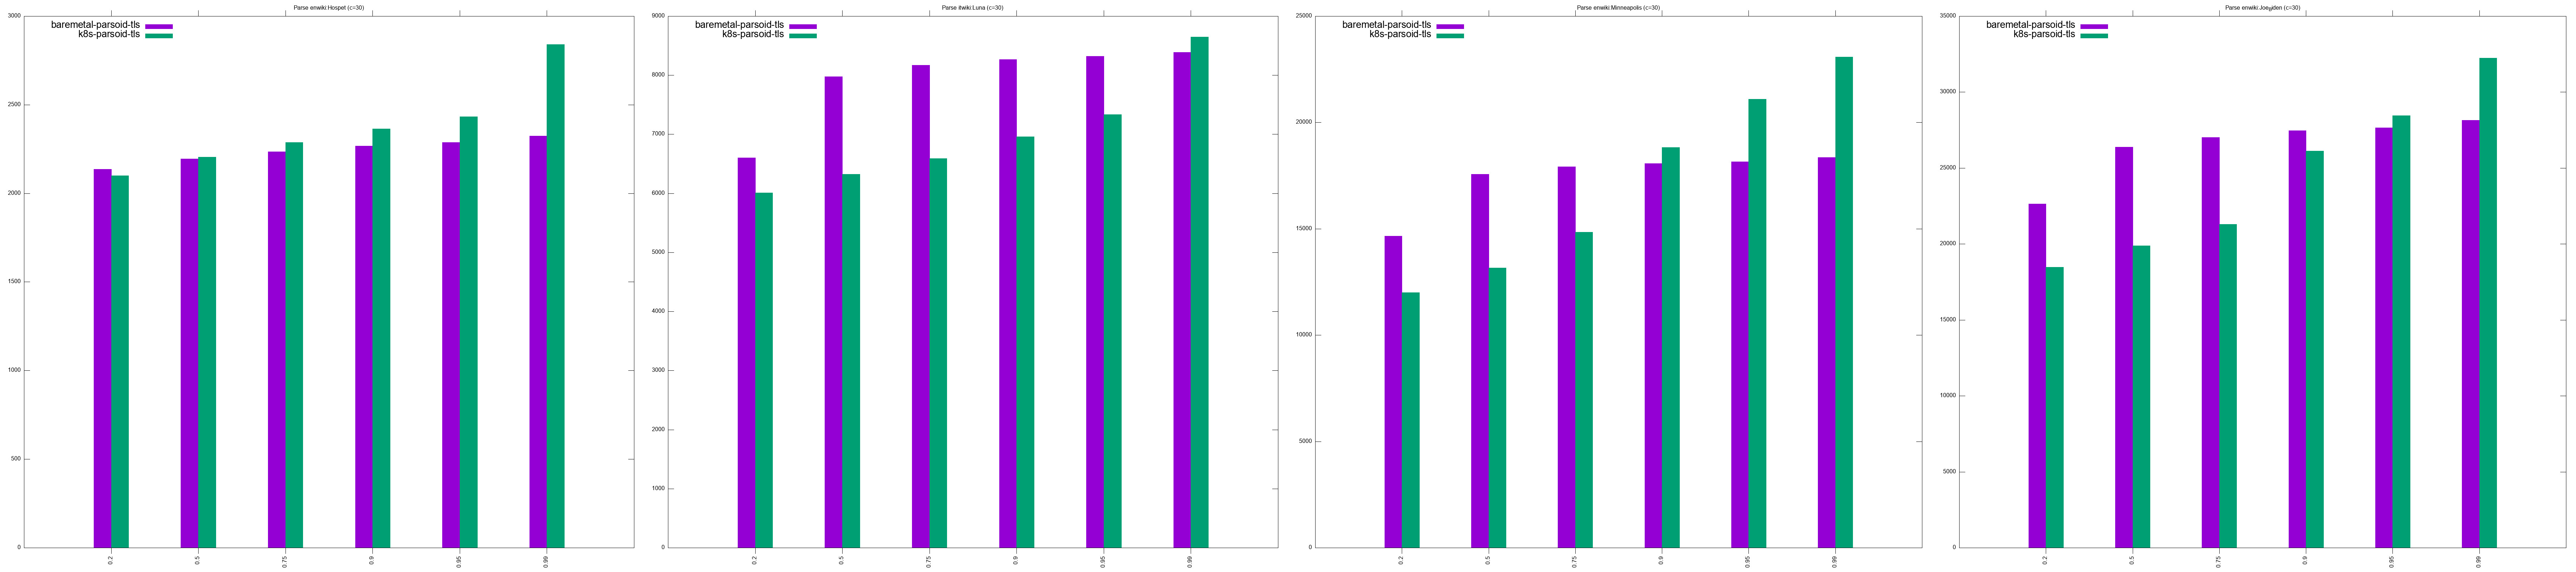
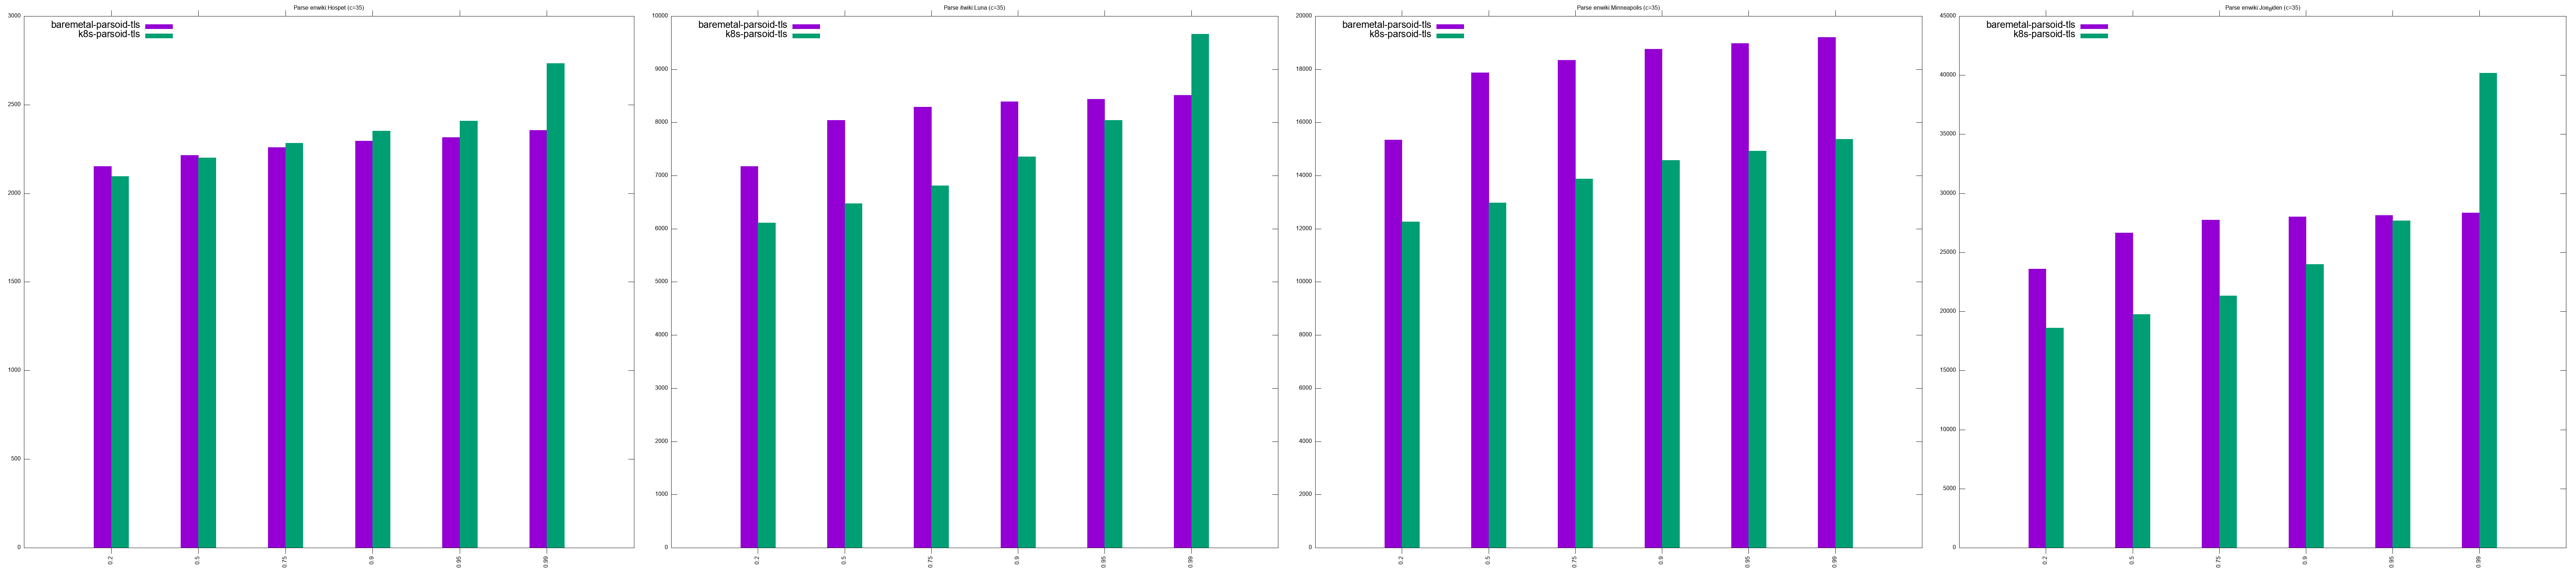
- Parsoid URLs testing:
- http://en.wikipedia.org/w/rest.php/en.wikipedia.org/v3/page/html/Hospet/1043074958 takes between 1 - 1.2s
- http://it.wikipedia.org/w/rest.php/it.wikipedia.org/v3/page/html/Luna/122769677' takes between 4.7 - 4.9s
- http://en.wikipedia.org/w/rest.php/en.wikipedia.org/v3/page/html/Minneapolis/1044317827 takes between 9 - 9.5s
- http://en.wikipedia.org/w/rest.php/en.wikipedia.org/v3/page/html/Joe_Biden/1045585041 takes 14 - 14.5s
Conclusions:
- For most workloads, at low concurrencies (c > 20), baremetal performs marginally better than k8s, to the point where we can consider it negligent T280497#7351513
- At higher concurrencies (c < 20), kubernetes outperforms baremetal, sometimes by far
- Having ~10 workers per pod will be sufficient
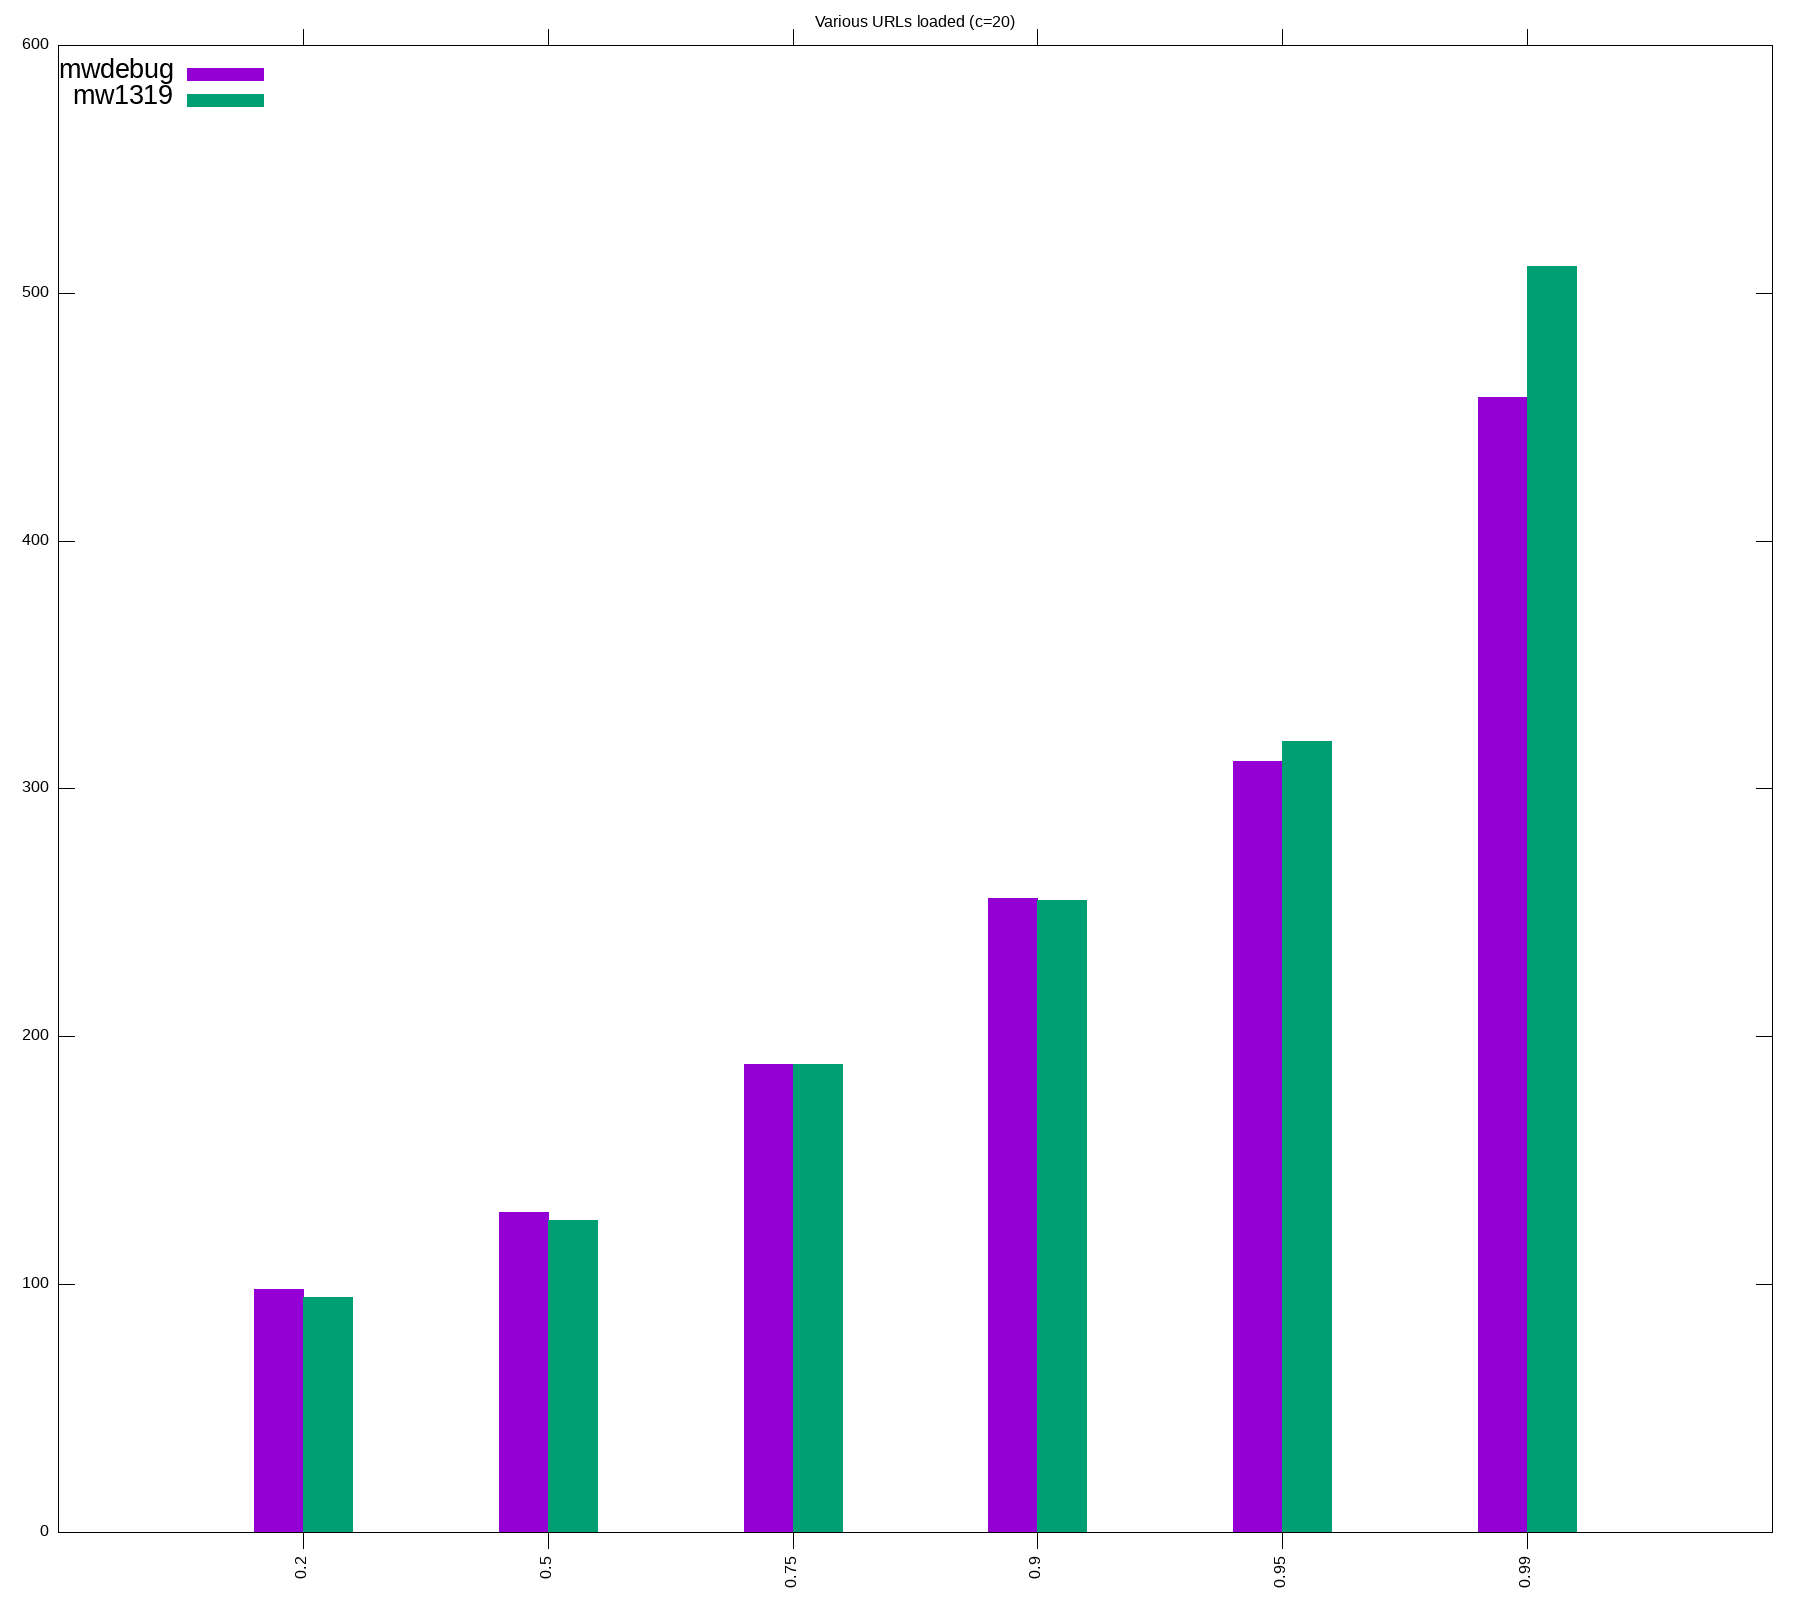
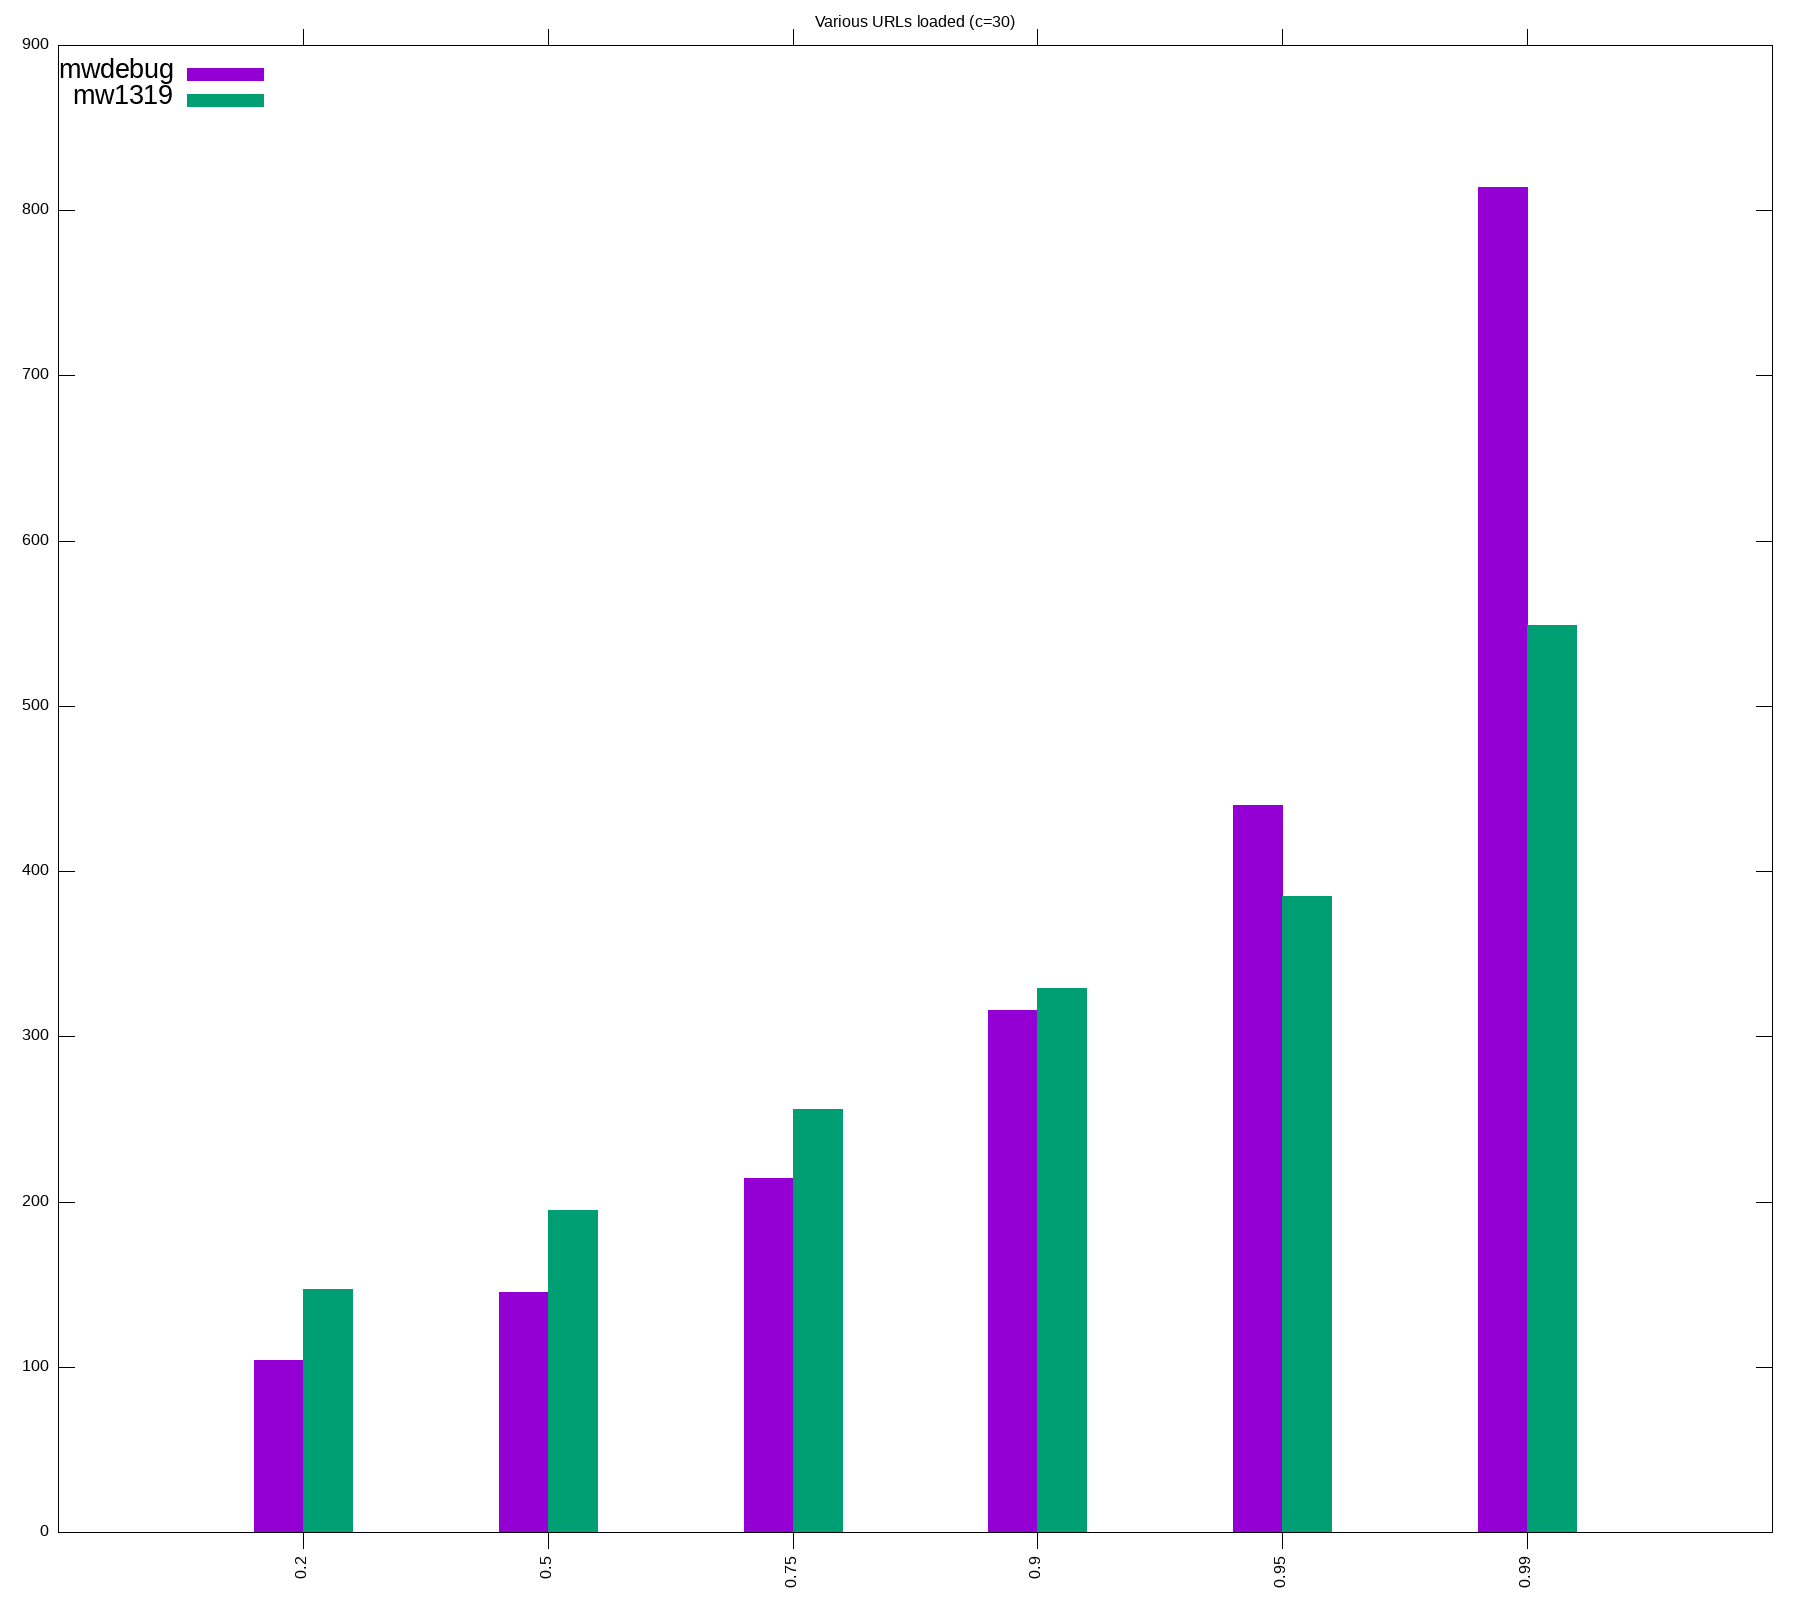
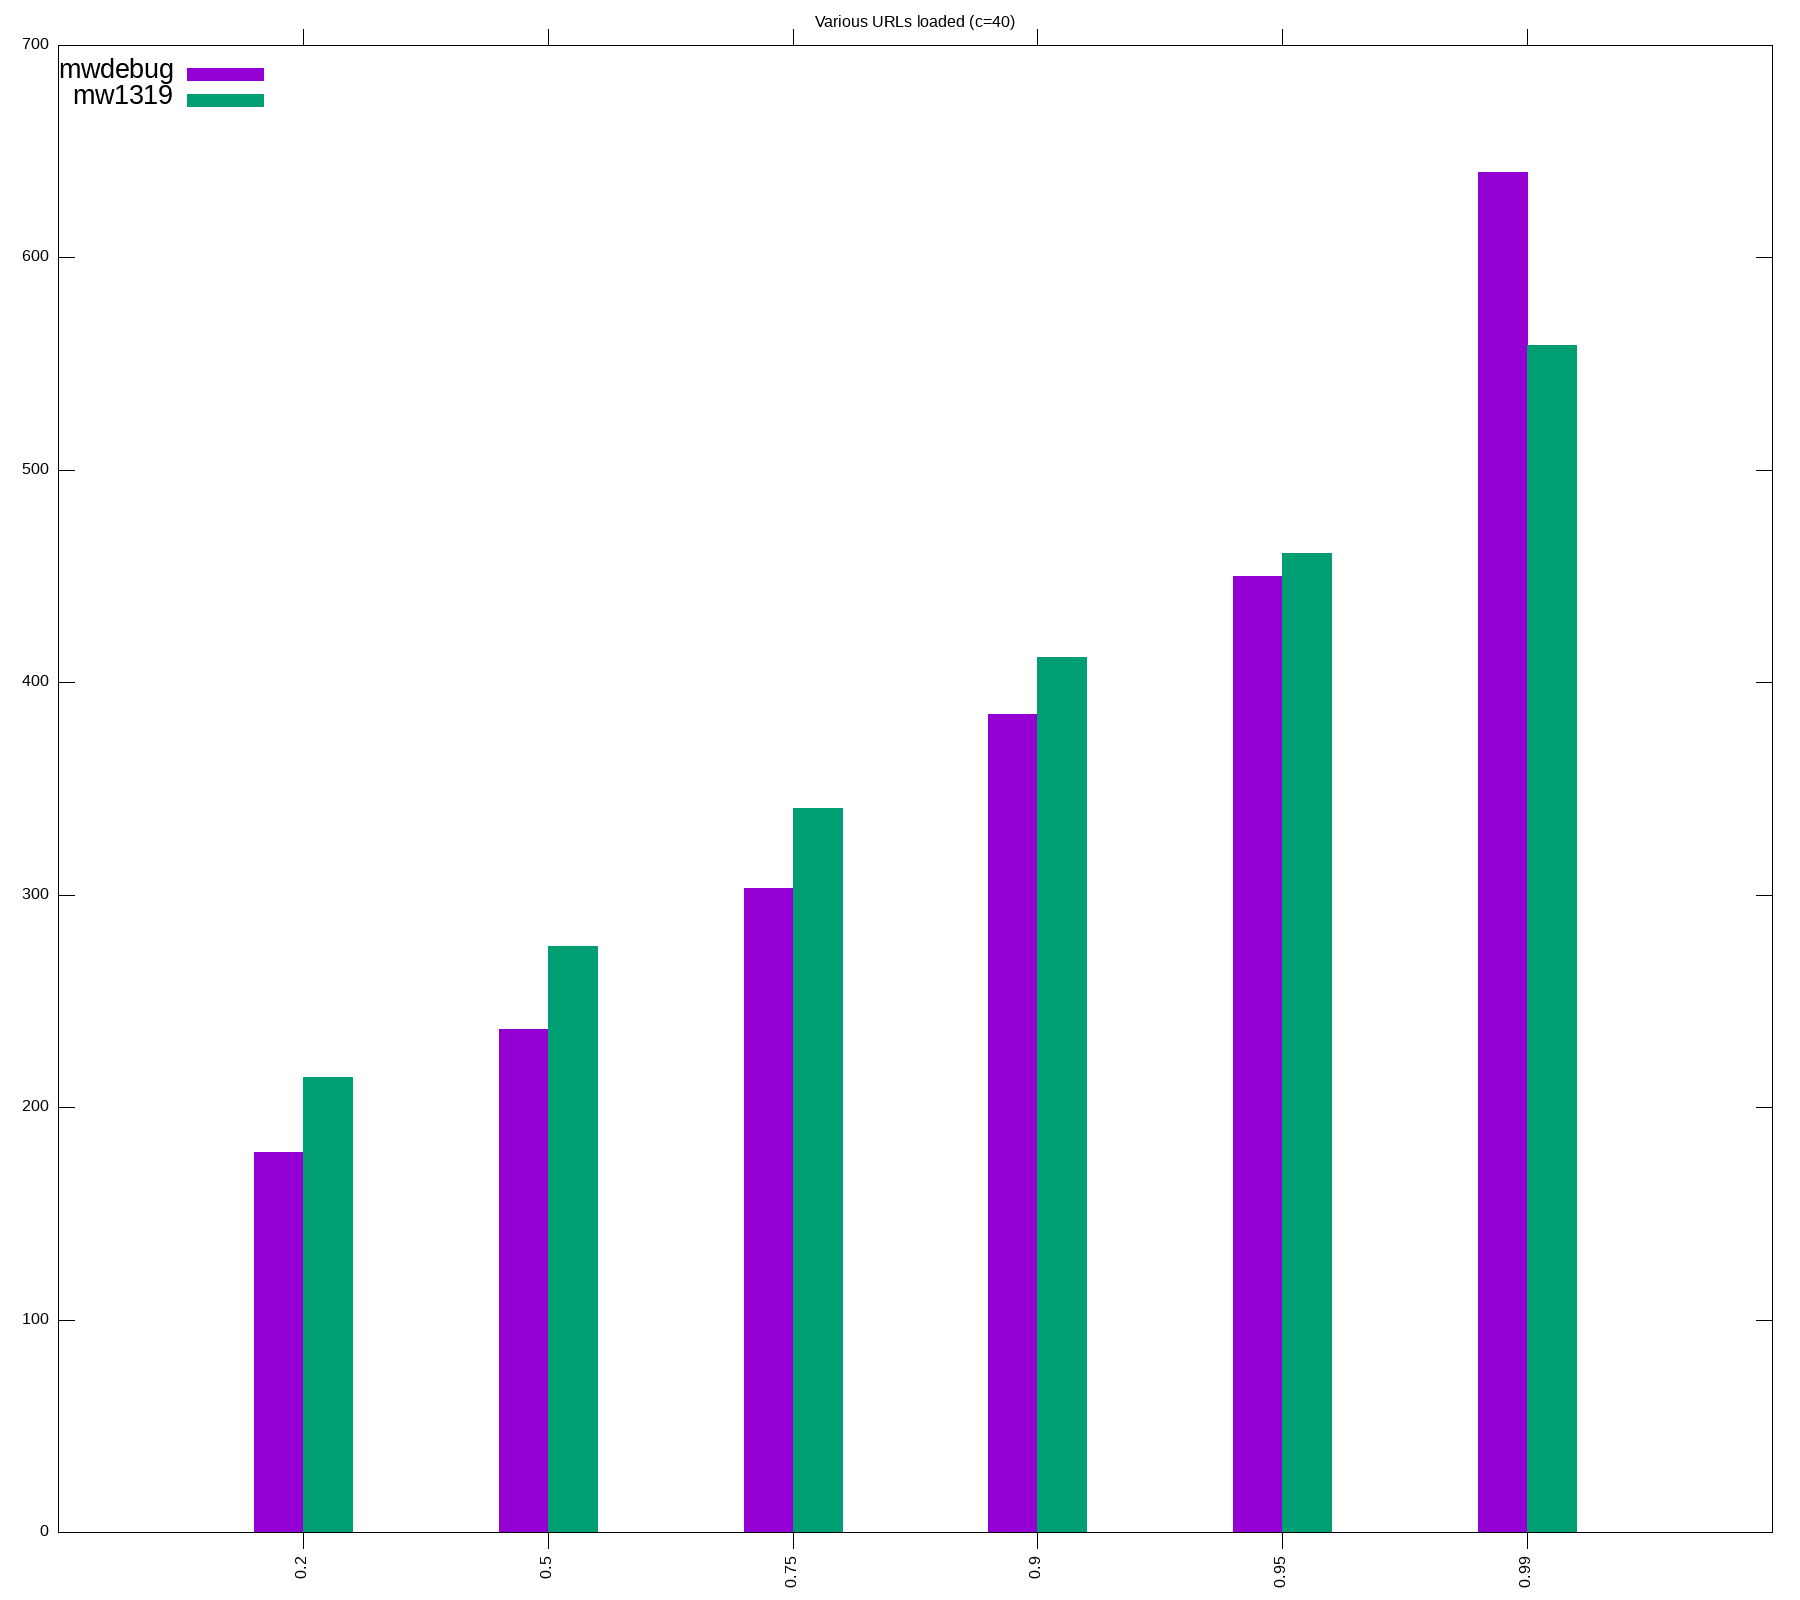
Round 2: replay read requests
We will run a large number of urls (~700k or less) at same concurrencies as in Round 1, and compare p20, p50, p75, p95, p99 for successful requests. After running the tests multiple times, we made the following adjustments
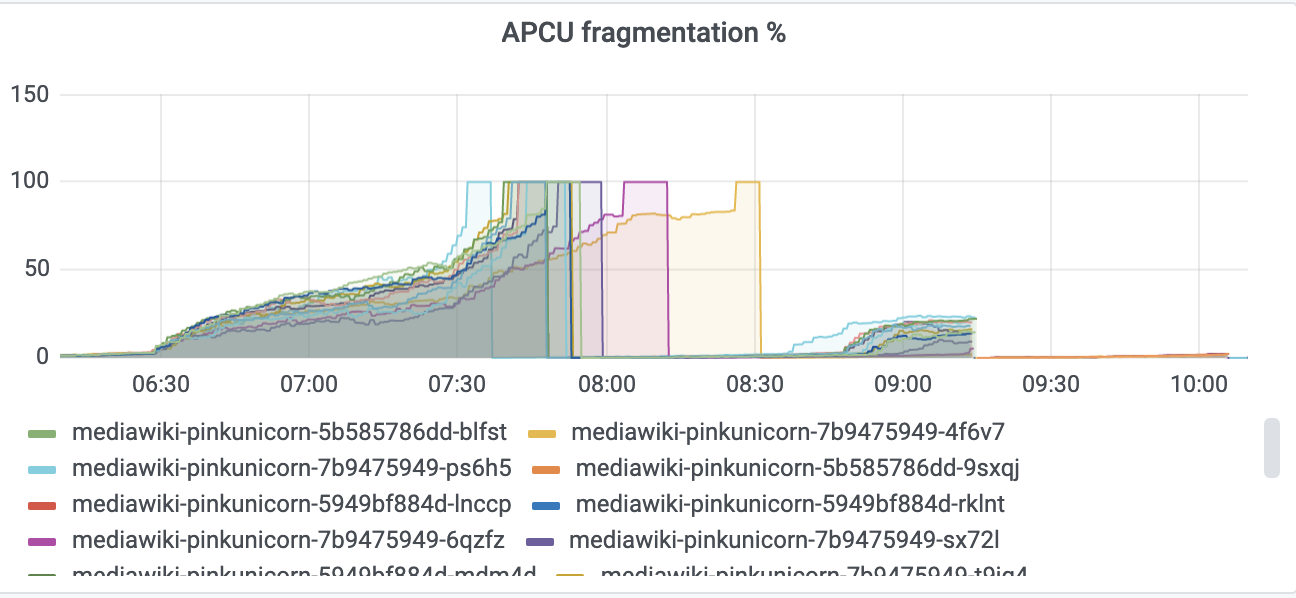
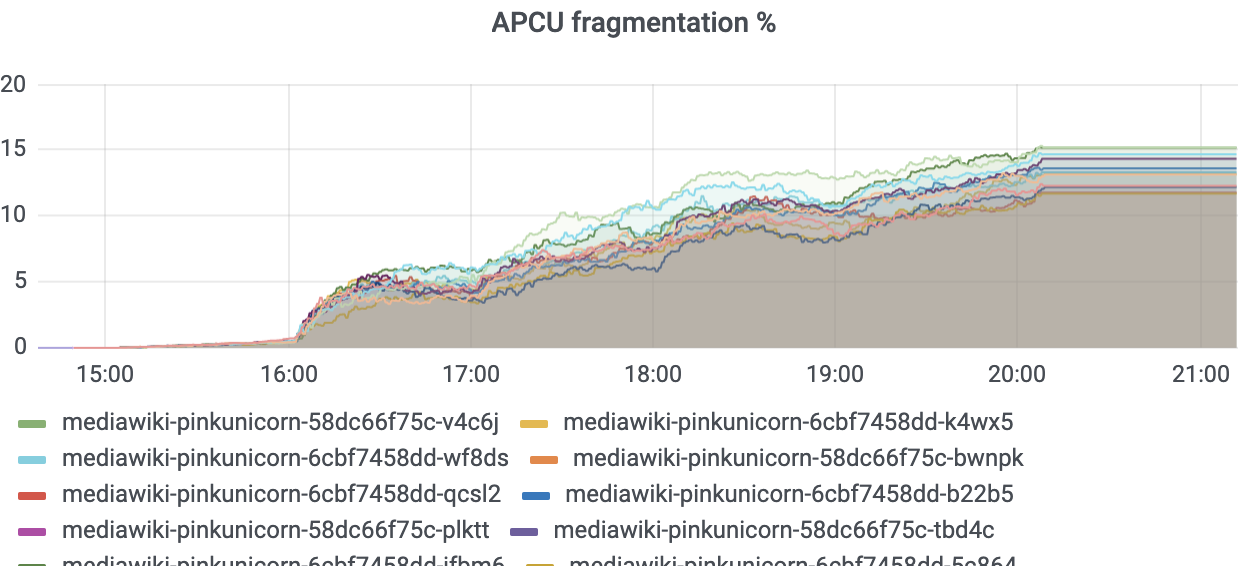
Improvements
- Envoy: more CPU and memory added
- PHP: Increased max_accelerated_files and APCu size
- main_app: more memory
- mcrouter: reduced CPU
- bumped namespace's limit as our pod size overall increased
Notes
- During kubernetes deployments (aka every time there was a scap run), we were getting connection errors and timeout errors, quite expected