Page MenuHomePhabricator

Superset query timeouts for charts using Druid table
Closed, DeclinedPublic

Description

Issue

I am experiencing timeouts when using GROUP BY in multiple charts using Druid tables.

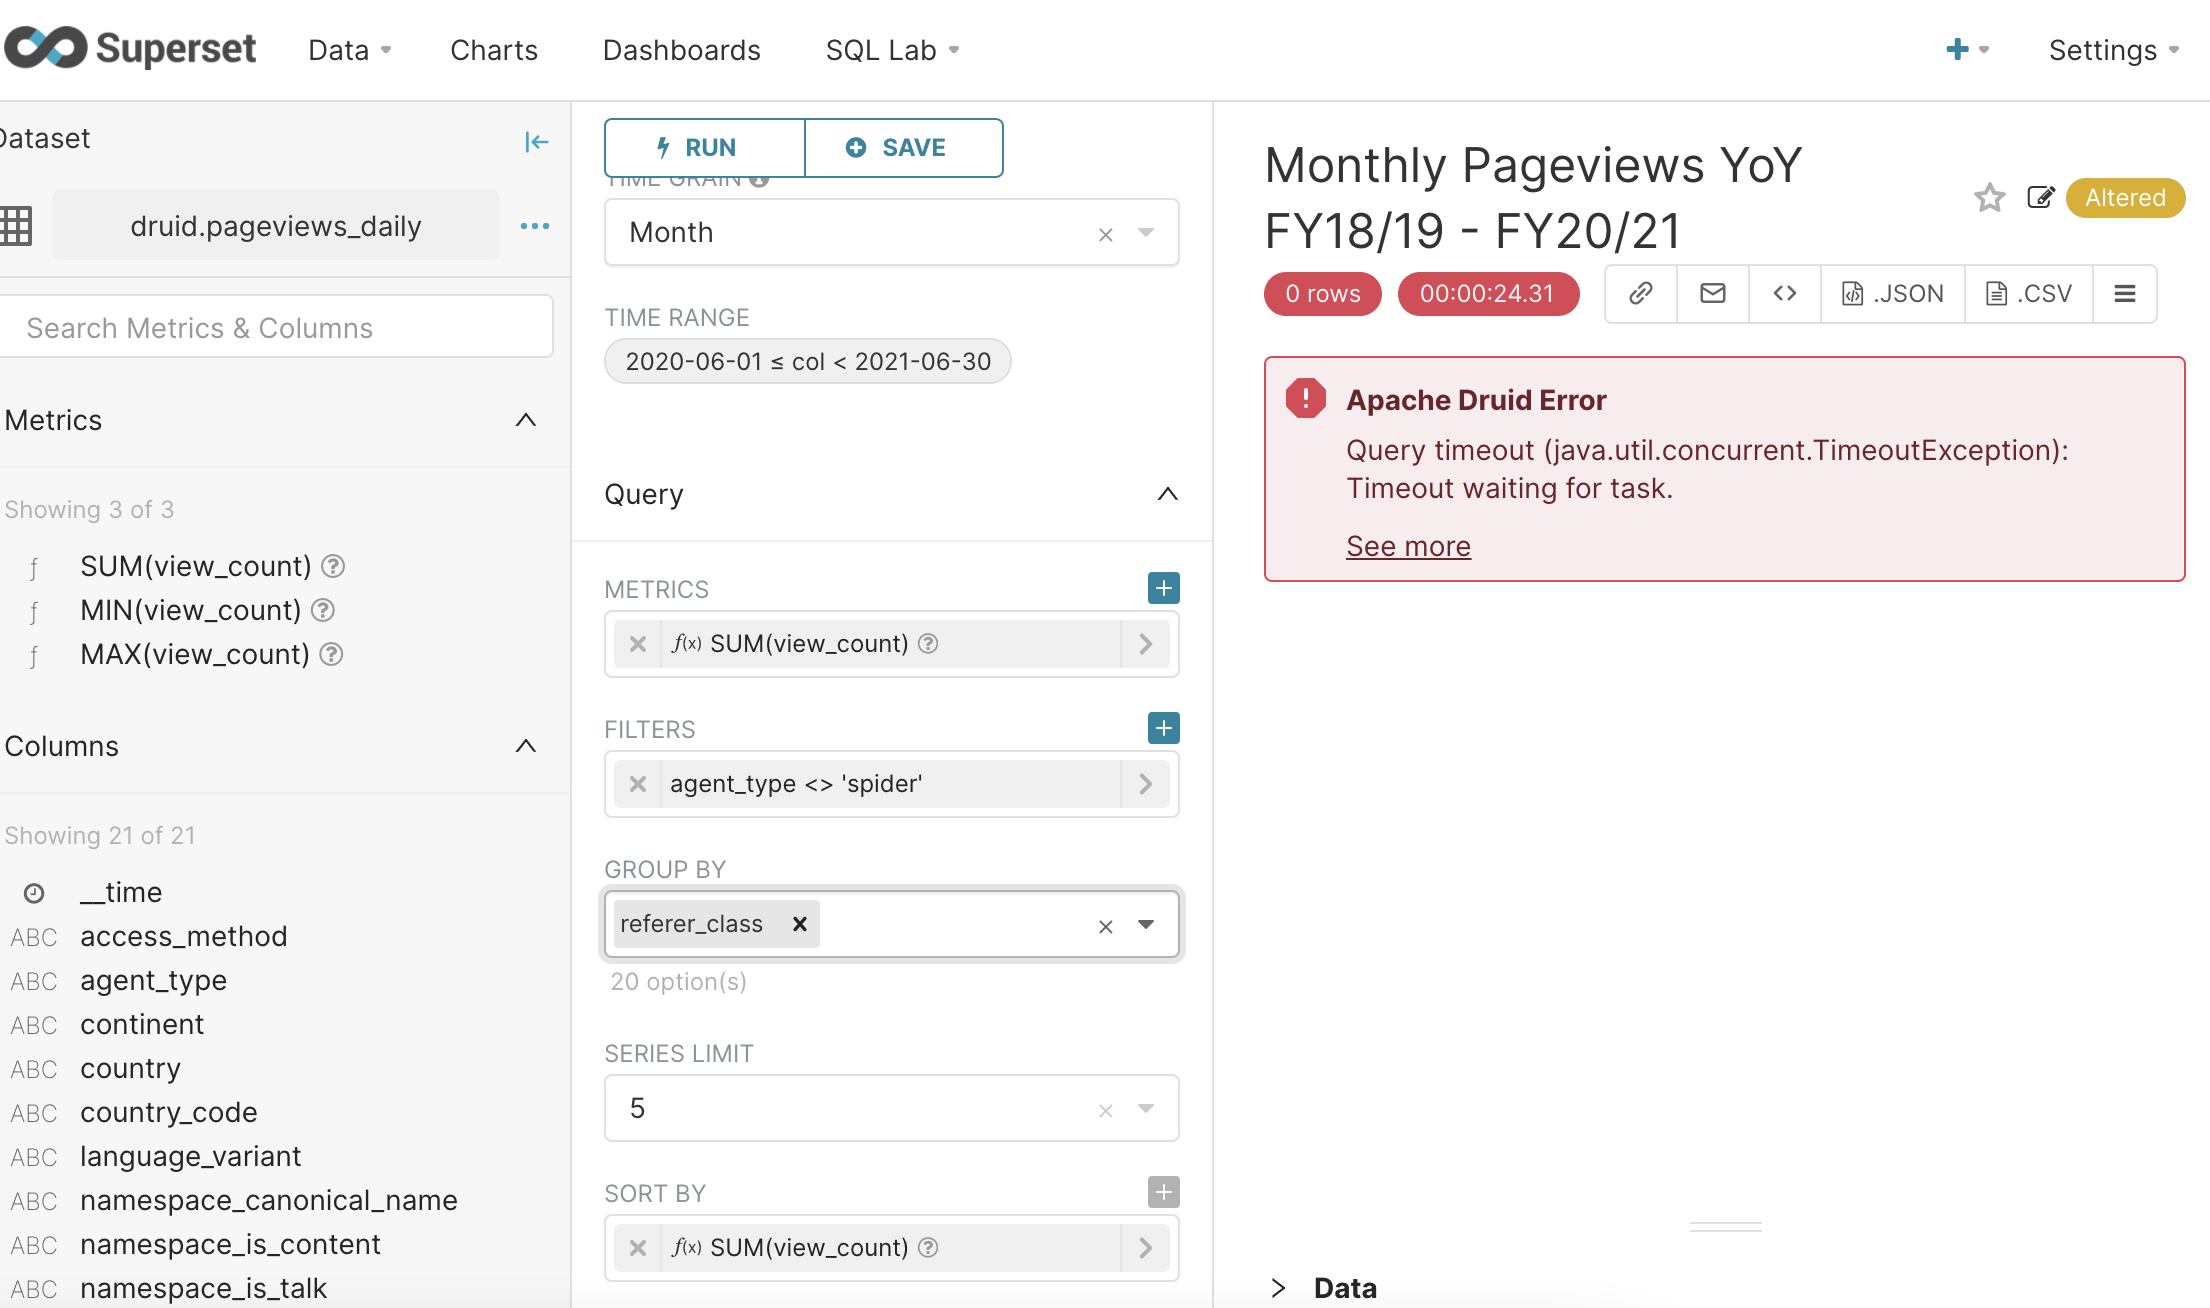
Example: This pageviews monthly chart, after adding GROUP BY, I got the following error.

Screen Shot 2021-05-11 at 5.31.04 PM.png (1×2 px, 334 KB)

Sometimes if I force refresh a chart, it will show, but that happens rarely.

Event Timeline

Interestingly, the GROUP BY splits work with (deprecated) Druid Datasources (e.g. this chart created using pageviews_daily )

Screen Shot 2021-05-11 at 3.57.01 PM.png (1×2 px, 446 KB)

cc-ing @JAllemandou, who said wanted to look at it, we'll triage with him Monday when he's back from vacation

TL;DR: This problem comes from how queries are translated from SQL to druid-query-plan. I don't have a solution for this :(

The query that times-out is (available using 'view query' in the chart top-right menu):

SELECT FLOOR("__time" TO MONTH) AS "__timestamp",
       "referer_class" AS "referer_class",
       SUM(view_count) AS "sum_view_count"
FROM "druid"."pageviews_daily"
WHERE "__time" >= '2020-06-01 00:00:00.000000'
  AND "__time" < '2021-06-30 00:00:00.000000'
  AND "agent_type" != 'spider'
GROUP BY "referer_class",
         FLOOR("__time" TO MONTH)
LIMIT 50000;

In superset SQL-lab I asked druid to shopw me its query-plan using the following syntax: EXPLAIN PLAN FOR <QUERY>, and got the following result for the query at stake:

DruidQueryRel(query=[{"queryType":"groupBy","dataSource":{"type":"table","name":"pageviews_daily"},"....

The query that doesn't time-out is:

{
  "queryType": "topN",
  "dataSource": "pageviews_daily",
 .....

The TopN queries in druid are a lot faster than GroupBy, and this is why the older chart gives result while the new one doesn't.

Things to keep in mind: The TopN queries are approximative, so results can be a little off (they usually are fairly correct when looking at first rows of top).
It is possible to make druid-sql generate topN queries, but I have not managed to have it working using a time-aggregation (see https://druid.apache.org/docs/latest/querying/sql.html#query-types for details).

odimitrijevic moved this task from Incoming to Smart Tools for Better Data on the Analytics board.
odimitrijevic subscribed.

@JAllemandou to file an upstream bug

Also: One way to get results is to set the time-grain to the value: original value. This makes calcite use the topN query (single field in group-by instead of two). You'll get daily values instead of monthly but at least you'll have values :)

Since this has been reported, and we don't have much work we can do on our side, I'm going to close this and add it to a reference document I'm building that would allow us to follow up if we wish. In my opinion, the Druid project isn't likely to implement optimizations like this and we should probably look for work-arounds in the meantime.