Page MenuHomePhabricator

Update readers, editors, and content dashboards in Superset to reflect proper dates
Closed, ResolvedPublic

Description

Update readers, editors, and content dashboards in Superset to reflect proper dates

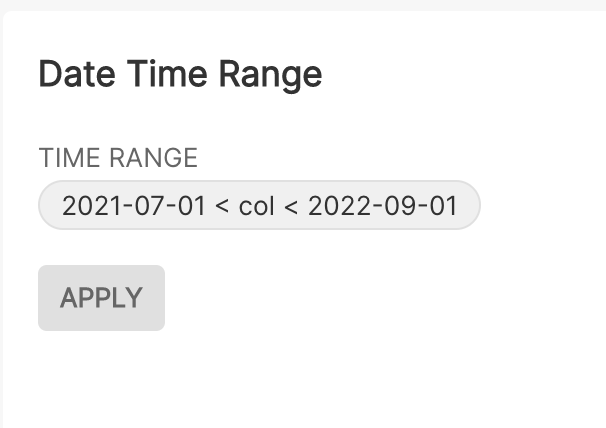
The readers, editors, and content dashboards in Superset use relative dates as below:

Screen Shot 2022-01-04 at 4.21.06 PM.png (358×538 px, 29 KB)

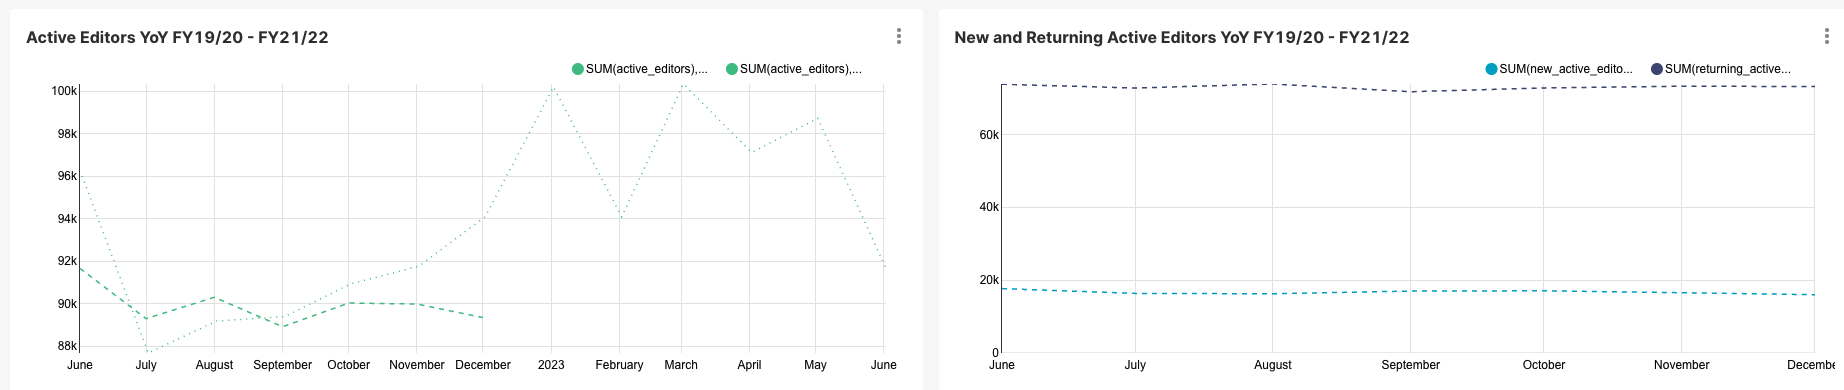
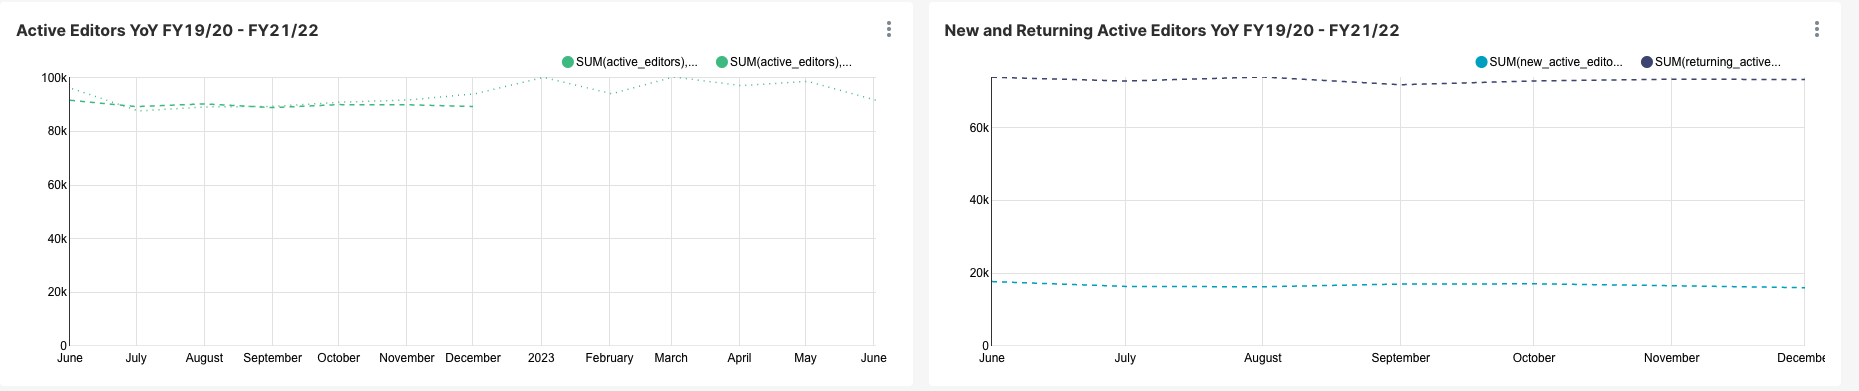
Now that a new year has started, Superset no longer interprets these dates as 2021-06-01 to 2022-07-01; now the dates are 2022-06-01 to 2023-07-01.

This means that the charts are showing less data, since we don't have data from June 2022 yet.

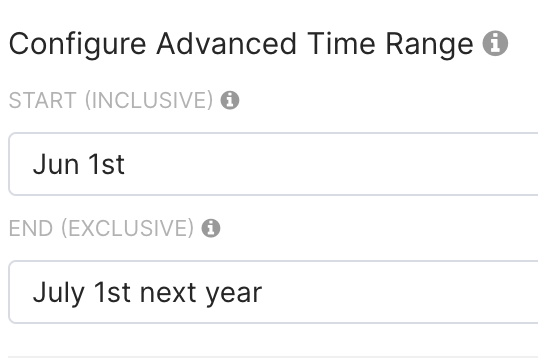
I think this issue could be solved by using the following wording:

Screen Shot 2022-01-04 at 4.25.51 PM.png (510×606 px, 44 KB)

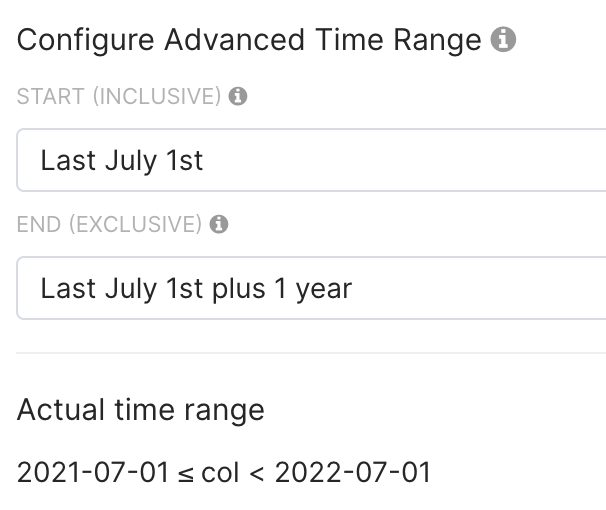
(However, this means that we won't be able to see trend changes from June to July, but I think that is ok)

It also would be good to check whether the dates could be set at the dashboard level with a single filter, to avoid needing to update all the individual charts (and perhaps update the chart titles to remove "FY19/20 - FY21/22")

Event Timeline

kzimmerman triaged this task as High priority.
kzimmerman created this task.

@kzimmerman : I created copies of the 3 dashboards with the time range applied at the dashboard level using a single filter. They seem to be working as expected now.
Can you please review and provide your comments below? I will apply these changes to the actual dashboards once I get an Okay from you.

@Mayakp.wiki The filter is working for me (and looks to be working for all the charts), thank you!

A couple of adjustments:

For all dashboards:

  • Change the default start to "Last July 1st"
  • Remove any titles in charts that specify fiscal years

Readers copy:
The time range filter is confusing, because it's part of the "Interactions Filter" panel, but applies to all the charts. Can the time range be put in its own panel (and above all the other charts), so it's clearer that it applies to the full dashboard?

Editors copy:
Same note - the time range filter is part of "project family" but applies to all the charts, so should be in its own panel

Content copy:
Same as above; move the time range filter to its own panel

@kzimmerman Here are the changes Ive done after the last update:

  • Have a standalone filter for the time range
  • Section on the top with an Overview of the dashboard. With a statement that the dashboard filter and that it applies to all the charts in the dashboard
  • Update “This dashboard is maintained by Maya Kampurath, Product Analytics. If you have questions or feedback please email @wikimedia.org or product-analytics@wikimedia.org”
  • Change the default start to "Last July 1st"
  • Remove any titles in charts that specify fiscal years

From T298926

  • Currently the "Big Number" charts are filtered to the first month of the fiscal year (see example below). These charts on the readers, editors, and content dashboards in Superset should show data from the last calendar month available.
  • Consider adding a subheader that specifies the metric and time period shown (e.g. "Interactions in the last calendar month")

Couple notes:

  • Overview section was added only for readers. I felt like there was a bit of information overload happening with that overview so I didnt do it for Editors and Content. lmk what you feel and we can discuss.
  • Feel free to do any minor changes, like adjusting chart size or moving them around for a better look and feel. I have made you and @Iflorez co-owners of this draft.
  • I don't think there is an easy way to replace one dashboard with the other. Which possibly means re-doing these changes in the original dashboards.

Readers copy
Editors Copy
Content Copy

Thanks and please lmk if there’s any other feedback.

Update: we will be adding URL slugs and deprecating(deleting) the existing metrics dashboards. An email will be sent out to Product-Analytics Announcements distribution list.

@Mayakp.wiki thank you so much for your excellent work on this, I think they are ready to go live!

Thank you so much Kate! :)

Next Steps

  • Switch out the dashboards and send email to users on Tuesday morning Feb 1st, 2022.

Go Live !
New Dashboards are published and the announcement has been sent out via email and on Slack channels.

Note : Content Interactions and Total Edits - Big Number chart changed to previous calendar year due to “No Data” being displayed for the previous calendar month, as of Feb 1st.
Need to change the metric back to "previous calendar month" by the end of the week and think about a workaround for this issue.

Feedback from Mike Pham :
Is there a reason that the y axes don’t start at 0? I was in a discussion where it makes some of the movement look more dramatic than it might otherwise be. I guess relatedly, it’s hard for me personally to understand what is normal noise, and what is a notable trend.

Screen Shot 2022-02-01 at 1.21.14 PM.png (390×1 px, 59 KB)

Screen Shot 2022-02-01 at 1.21.59 PM.png (391×1 px, 52 KB)

I guess he has a point ! but we need to understand the implications of doing this.

This was done and reviewed, dashboards are working. The point about the y axes would be another project that we may consider in the future; I think we will need to do a usability review at some point

Every new calendar year and every new fiscal year we may need to adjust dates in the short-term while the previous set-up works again. Here are the two short-term quick fixed we've used:

Fiscal year, July, quick-fix set-up:
Last July 1st 1 year ago
Last July 1st —> Last August 1st

Calendar year, January, quick-fix set-up:
Last July 1st
Last July 1st plus 1 year

@Mayakp.wiki
None of the solutions noted on this ticket are working on the editors dashboard at this time. Maybe you have a suggestion?
Below is the solution that is allowing me to see August data.
Note: I'm challenged to save it and overwrite on the full dashboard

Screen Shot 2022-09-21 at 2.14.25 PM.png (428×606 px, 25 KB)

@Iflorez ,
Can you let me know a little more about the issue you are facing?

The date filter -

  • Last July 1st
  • Last July 1st plus 1 year

works correctly and seems fine on the Line Charts but it looks weird on the Time Series Line Chart, since it doesn't display future months.

image.png (690×960 px, 66 KB)