Page MenuHomePhabricator

Include performance bucketing in Growth analytics schemas
Open, Needs TriagePublic

Description

In analyzing Add Link / Add Image funnel data, we talked about how the load times for Special:Homepage, the article, and loading VisualEditor and its plugins (AddLink/AddImage plus data) might affect user actions.

We already instrument the following:

  • server-side render time (although this does not tell the full story, because it doesn't include the start of the request nor the final delivery of the page, it just says how long it took SpecialHomepage::execute to run)
  • client-side time-to-interactive for Special:Homepage's suggested edits module
  • time to show guidance for unstructured tasks
  • time to show editor for structured tasks

We could think about bucketing users based on the the times for these metrics, and including that in analytics data.

So for example, we might have server-side render time buckets like:

  • under_200ms
  • 200ms_500ms
  • 500ms_1000ms
  • over_1000ms

if the user's server-side render time was 800ms, then for events logged on Special:Homepage:

{
	"$schema": "/analytics/legacy/homepagemodule/1.3.0",
	"client_dt": "2022-02-11T08:47:22.972Z",
	"event": {
                "performance_bucket": "500ms_1000ms",
		"action": "se-task-impression",
		"action_data": "taskTypes=copyedit,references;taskCount=60694;topics=architecture,earth-and-environment,europe;newcomerTaskToken=u6spfr8h854c587ipkpg2f1mva5geetn",
		"homepage_pageview_token": "eiuk7i0i3ejthefek0ejussftmrk3ib2",
		"user_variant": "control"
	}
       // etc
}

That way, when analyzing funnel data, we might be able to better understand if users are dropping off at a certain point due to long load times.

@nettrom_WMF would be great to hear your thoughts on whether this is useful to include before we do anything.
Event Timeline

If Performance-Team has any thoughts on this idea, please comment here on this task. Thanks!

Hi @kostajh cool let us talk about this in our weekly meeting on Tuesday and get back to you.

I also have a couple of questions about how the measurements are done:

  • client-side time-to-interactive for Special:Homepage's suggested edits module - today we do not have any time to interactive metrics in the navigation timing extension or in the synthetic tools, mostly because I think its kind of hard to get this right, are the metric useful today?
  • time to show guidance for unstructured tasks/time to show editor for structured tasks - do we use the Element timing API or report the time using the User Timing API (=estimate when things is painted when everything is ready to paint in our side)? The reason I ask is that I want to make sure we pickup the same in our real user measurements and potentially in our synthetic tools and also I want to check how accurate it is.

Hi @kostajh cool let us talk about this in our weekly meeting on Tuesday and get back to you.

ok, thanks!

I also have a couple of questions about how the measurements are done:

  • client-side time-to-interactive for Special:Homepage's suggested edits module - today we do not have any time to interactive metrics in the navigation timing extension or in the synthetic tools, mostly because I think its kind of hard to get this right, are the metric useful today?

As a relative indicator of potential regressions, it's useful, but I don't treat the numbers there as absolutes.

The client-side dashboards we made in https://grafana.wikimedia.org/d/vGq7hbnMz/special-homepage-and-suggested-edits?orgId=1 were created at a time when the Suggested Edits feature was rendered entirely on the client-side: the server-side render outputted a div, then you had to wait for JS to load, and that JS had to do an API call to get data, then finally the feature was interactive.

Since then, our code evolved such that we server-side render a complete view of the feature. We also reduced the amount of data we fetch in the API call needed for the feature to be interactive (clicking forwards and backwards through a queue of suggested edits).

  • time to show guidance for unstructured tasks/time to show editor for structured tasks - do we use the Element timing API or report the time using the User Timing API (=estimate when things is painted when everything is ready to paint in our side)? The reason I ask is that I want to make sure we pickup the same in our real user measurements and potentially in our synthetic tools and also I want to check how accurate it is.

The patch for both of those things is in https://gerrit.wikimedia.org/r/c/mediawiki/extensions/GrowthExperiments/+/757537 I am not sure that we actually created panels in Grafana yet for the data, I'll post back here if/when I find them.

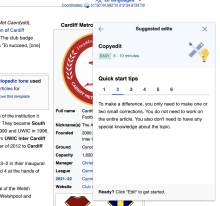
To clarify what that the "time to show guidance for unstructured tasks" feature is: when a user clicks on an unstructured task in the Suggested Edits module (things like "Copyedit" or "Update"), they're taken to an article page. On the article page, the "help panel" then appears, showing some guidance to the user.

image.png (1×1 px, 314 KB)

There are two things that can be slow here: 1) loading the JS needed to display the help panel (OOUI + friends and the custom code for the help panel) and 2) an API call to get the text/image contents to display in the panel. It looks like our instrumentation code fires before (2) happens.

time to show editor for structured tasks

When a user clicks on a "link recommendation" or "image recommendation" task from Suggested Edits, we take them to the article page and open visual editor for them with a custom plugin. Anecdotally, that can be slow depending on a variety of factors. When the VE surface is ready, we call mw.track.

Hi @kostajh we had short discussion yesterday, First thanks for including us, I think this is really exciting! Buckets will be great, hard to know though what the different spans should be. For server-side render time we wondered if we maybe could split under_200ms to a couple of more buckets, just to find those who have really fast render time? If we measure it server side I think many will be in that bucket?

For the visual metrics (when something is showed) I wonder if it could be ok to add an attribute to that element (elementtiming="METRIC_NAME")? That way browser that supports it will report the actual time that element is painted on the screen (compared to when our JavaScript think it ready to paint, there are usually some lag between when JS think things can be painted and when it actually is). However I see your point of using the metrics as an indicator of when things are slower/faster but I thing that attribute can add a value because we can than actually say for sure when it's painted. We did a test some years ago when Element Timings was evaluated in Chrome (https://techblog.wikimedia.org/2019/04/10/evaluating-element-timing-for-images/) and it turned out it was pretty accurate. We also have implemented that our synthetic tools automatically pickup all elements that have that attribute and calculate (from a video recording) when it is painted and sometime in the future I hope we can do that also for real user measurements using the navigation timing extension. We don't have a synthetic test running for Special:Homepage today but maybe that's something we could add an capture the full user journey if its desirable.

Let me know if there's something I or someone in our team can do to help!