Name for main point of contact and contact preference
Kate Zimmerman; Phab for notes on the request but Slack for questions needing a quicker response
What teams or departments is this for?
Product & Fundraising
What are your goals? How will you use this data or analysis?
- clarify data/charts in https://docs.google.com/presentation/d/1EFg6oa5WNbrLVHWkQqI5vHLs4HRNMtHvBxoF2_8QULA/edit#slide=id.gd9eb809c66_0_201
- provide data that more clearly maps on to Fundraising's analysis so we can better compare numbers
What are the details of your request? Include relevant timelines or deadlines
- update the traffic_timeline_data with estimated pageviews for mobile_vs_desktop traffic at a global level (similar to what we provided on mobile_vs_desktop_US)
- work with @aminalhazwani to update the mobile vs desktop global graph in deck - https://docs.google.com/presentation/d/1EFg6oa5WNbrLVHWkQqI5vHLs4HRNMtHvBxoF2_8QULA/edit#slide=id.g119fc0c04b3_5_59
- verify en6c Fundraising days (launch day through day 7)
- provide estimates for traffic data on en6c Fundraising days, include YoY calculations comparing to the fundraising days in 2020 and 2019
- for each country in the enc6 group, Germany, and Japan: provide YoY calculations comparing to December 2020 and 2019 (this can be done using data already calculated in https://docs.google.com/spreadsheets/d/1J45El5yOq5EP4v_ae7qbZDhnDq-dqQ1JmcPawWKWMRk/edit)
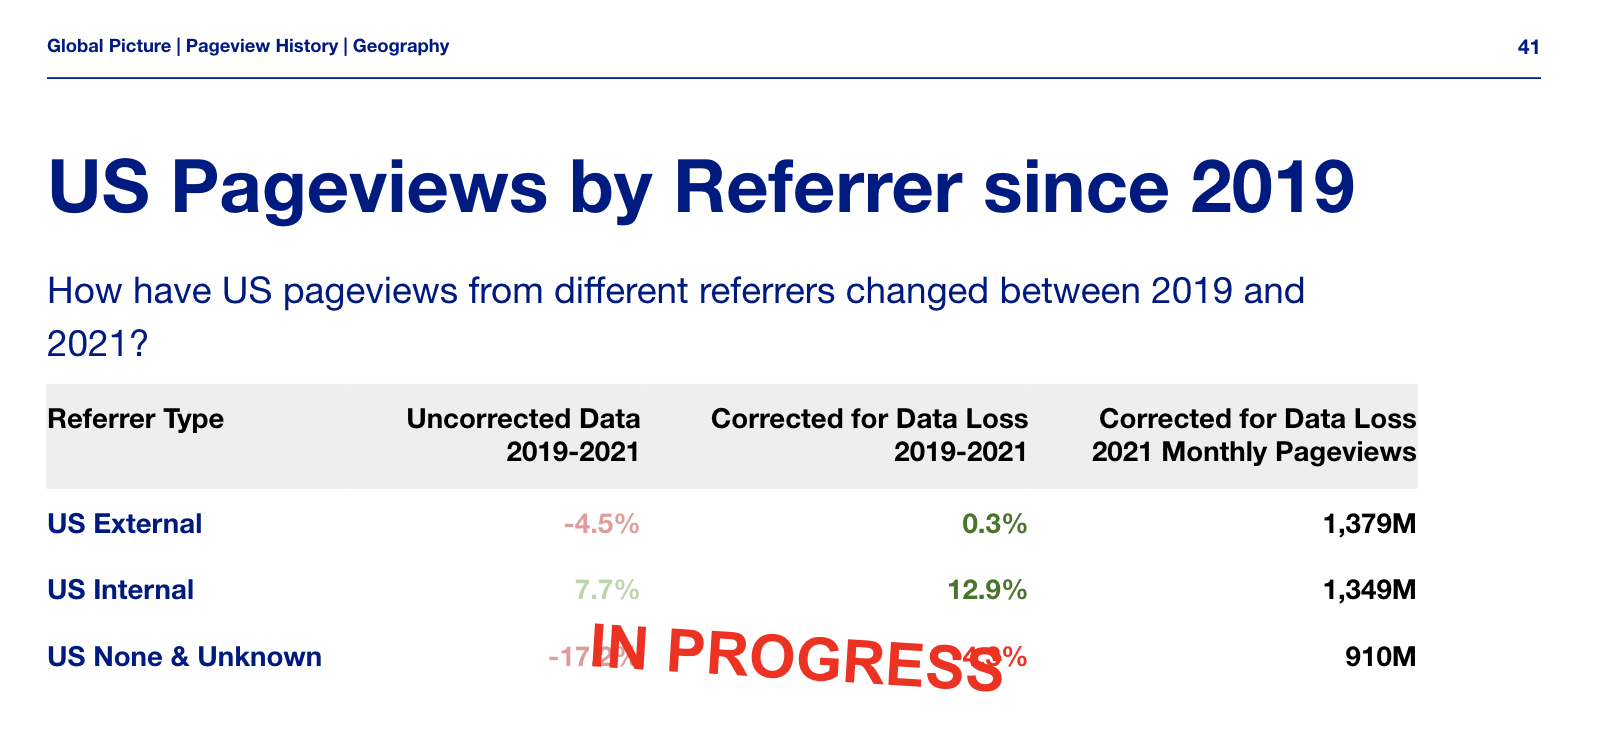
- segment US Data into external referrers (already done) vs. internal vs. Direct/unknown
- provide additional segment for US mobile vs desktop divided by external vs. internal vs. direct/unknown (direct is null, empty or '-'; unknown is used where domain extraction failed)
Is this request urgent or time sensitive?
yes