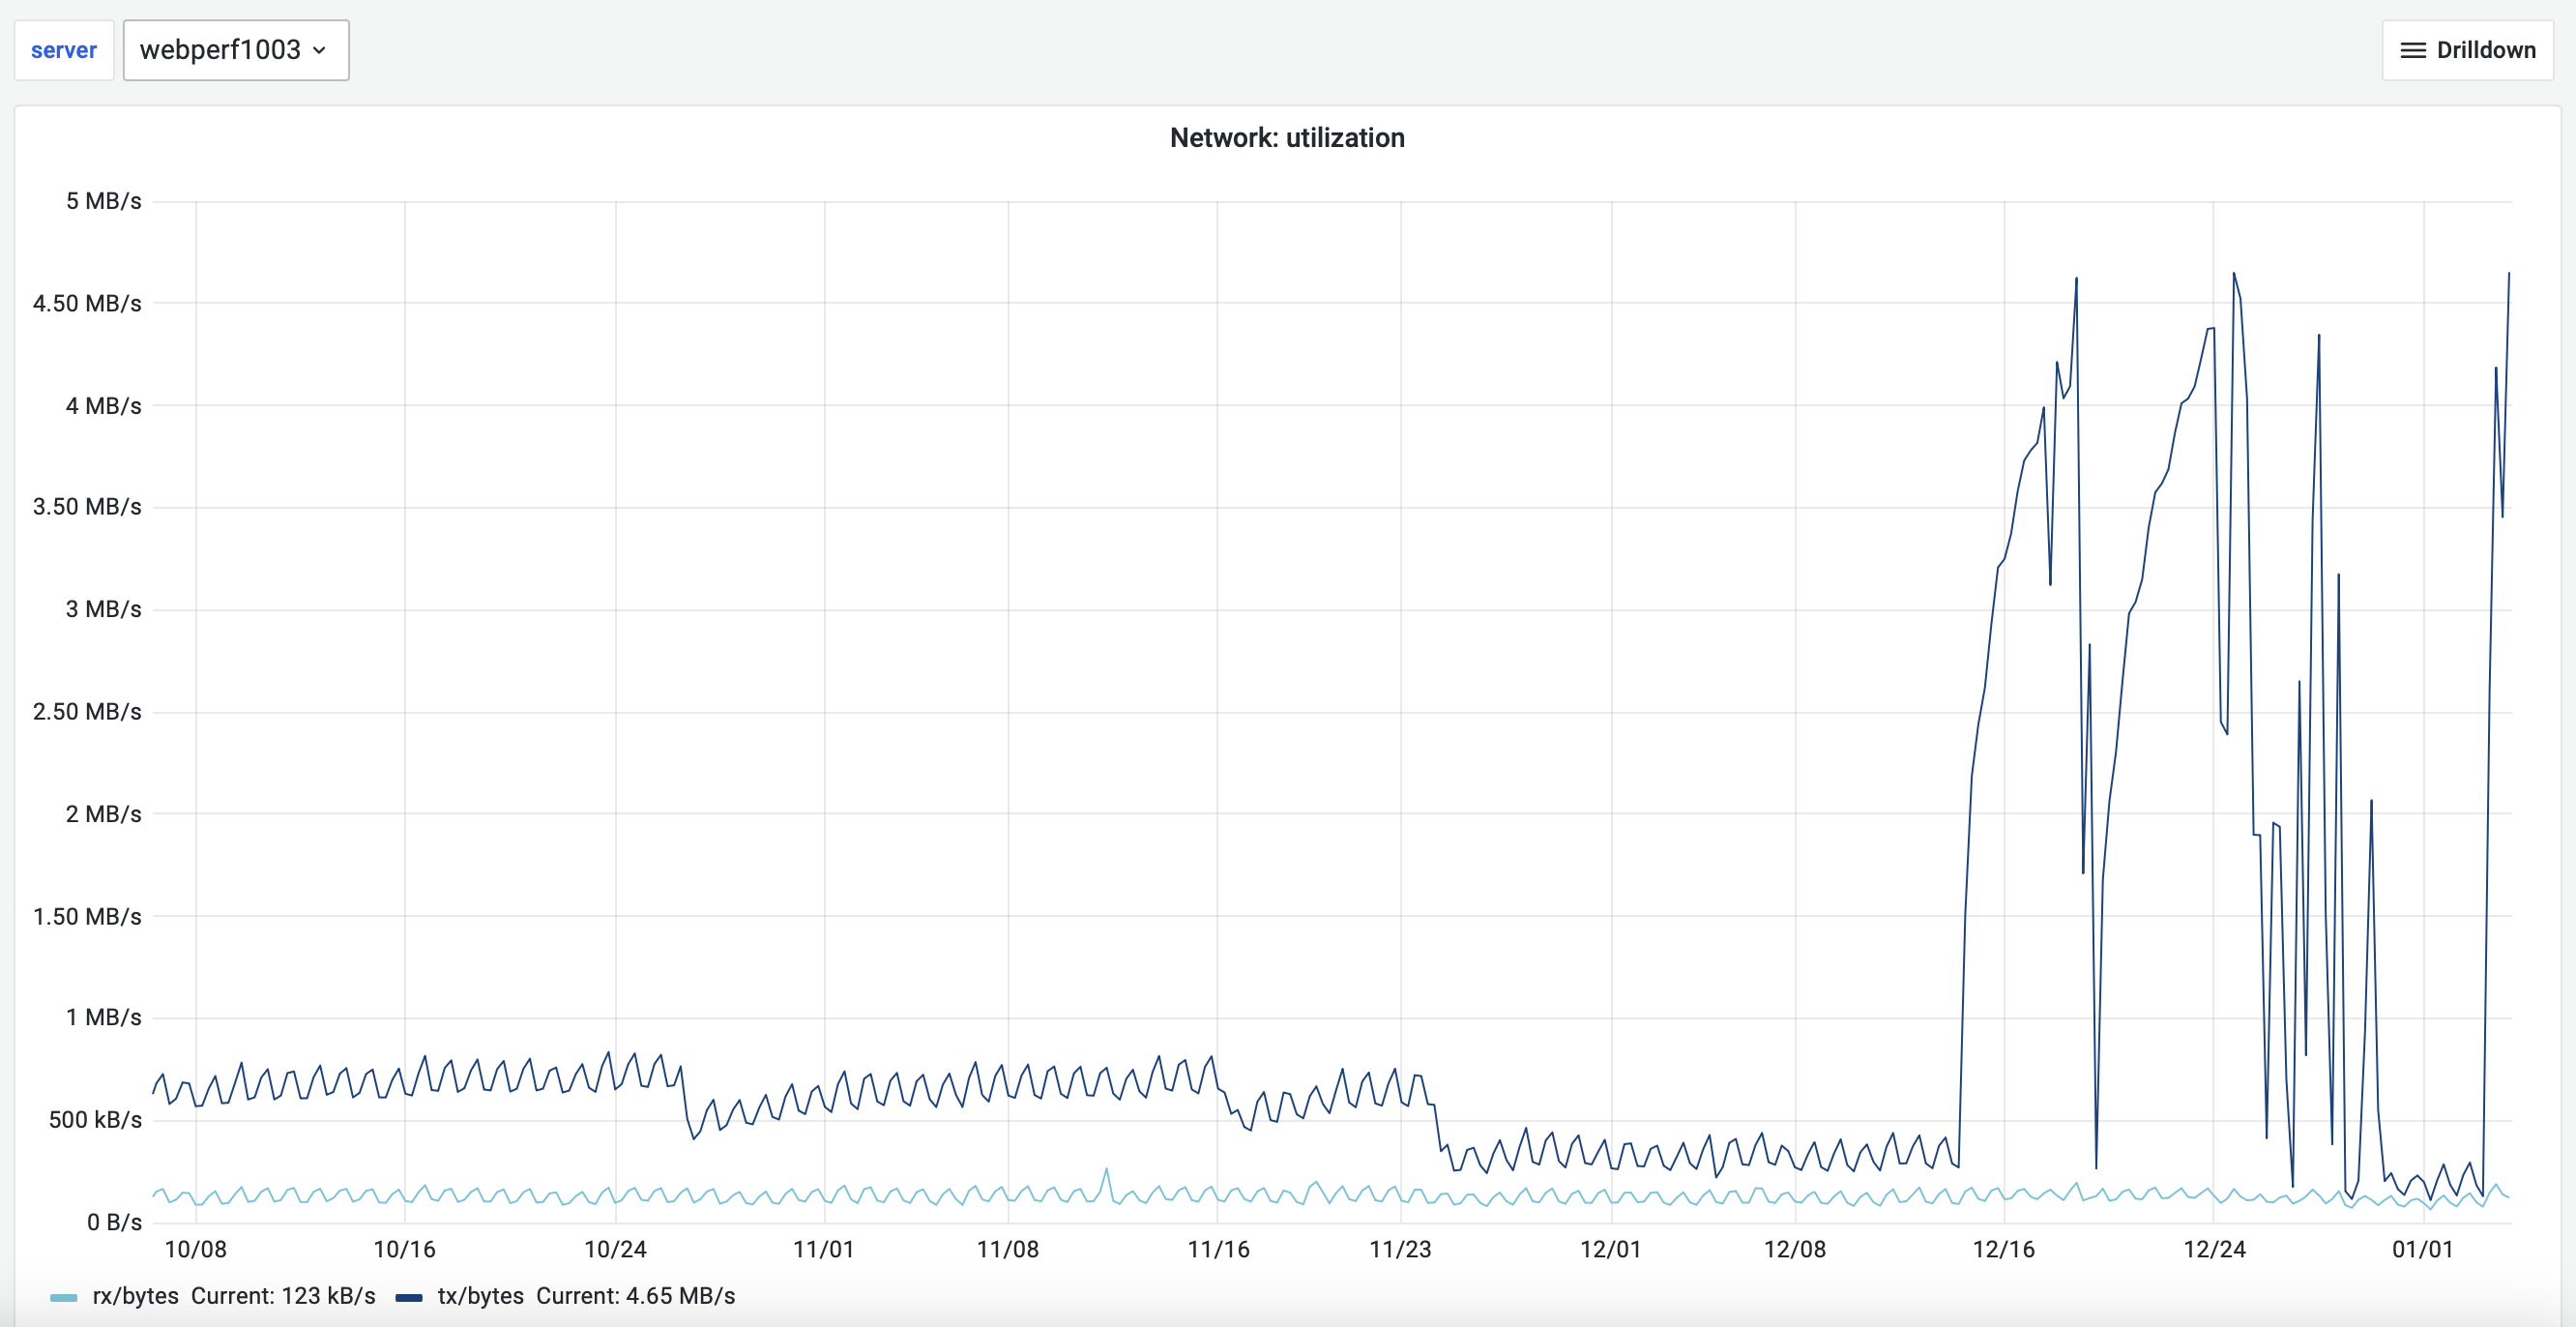
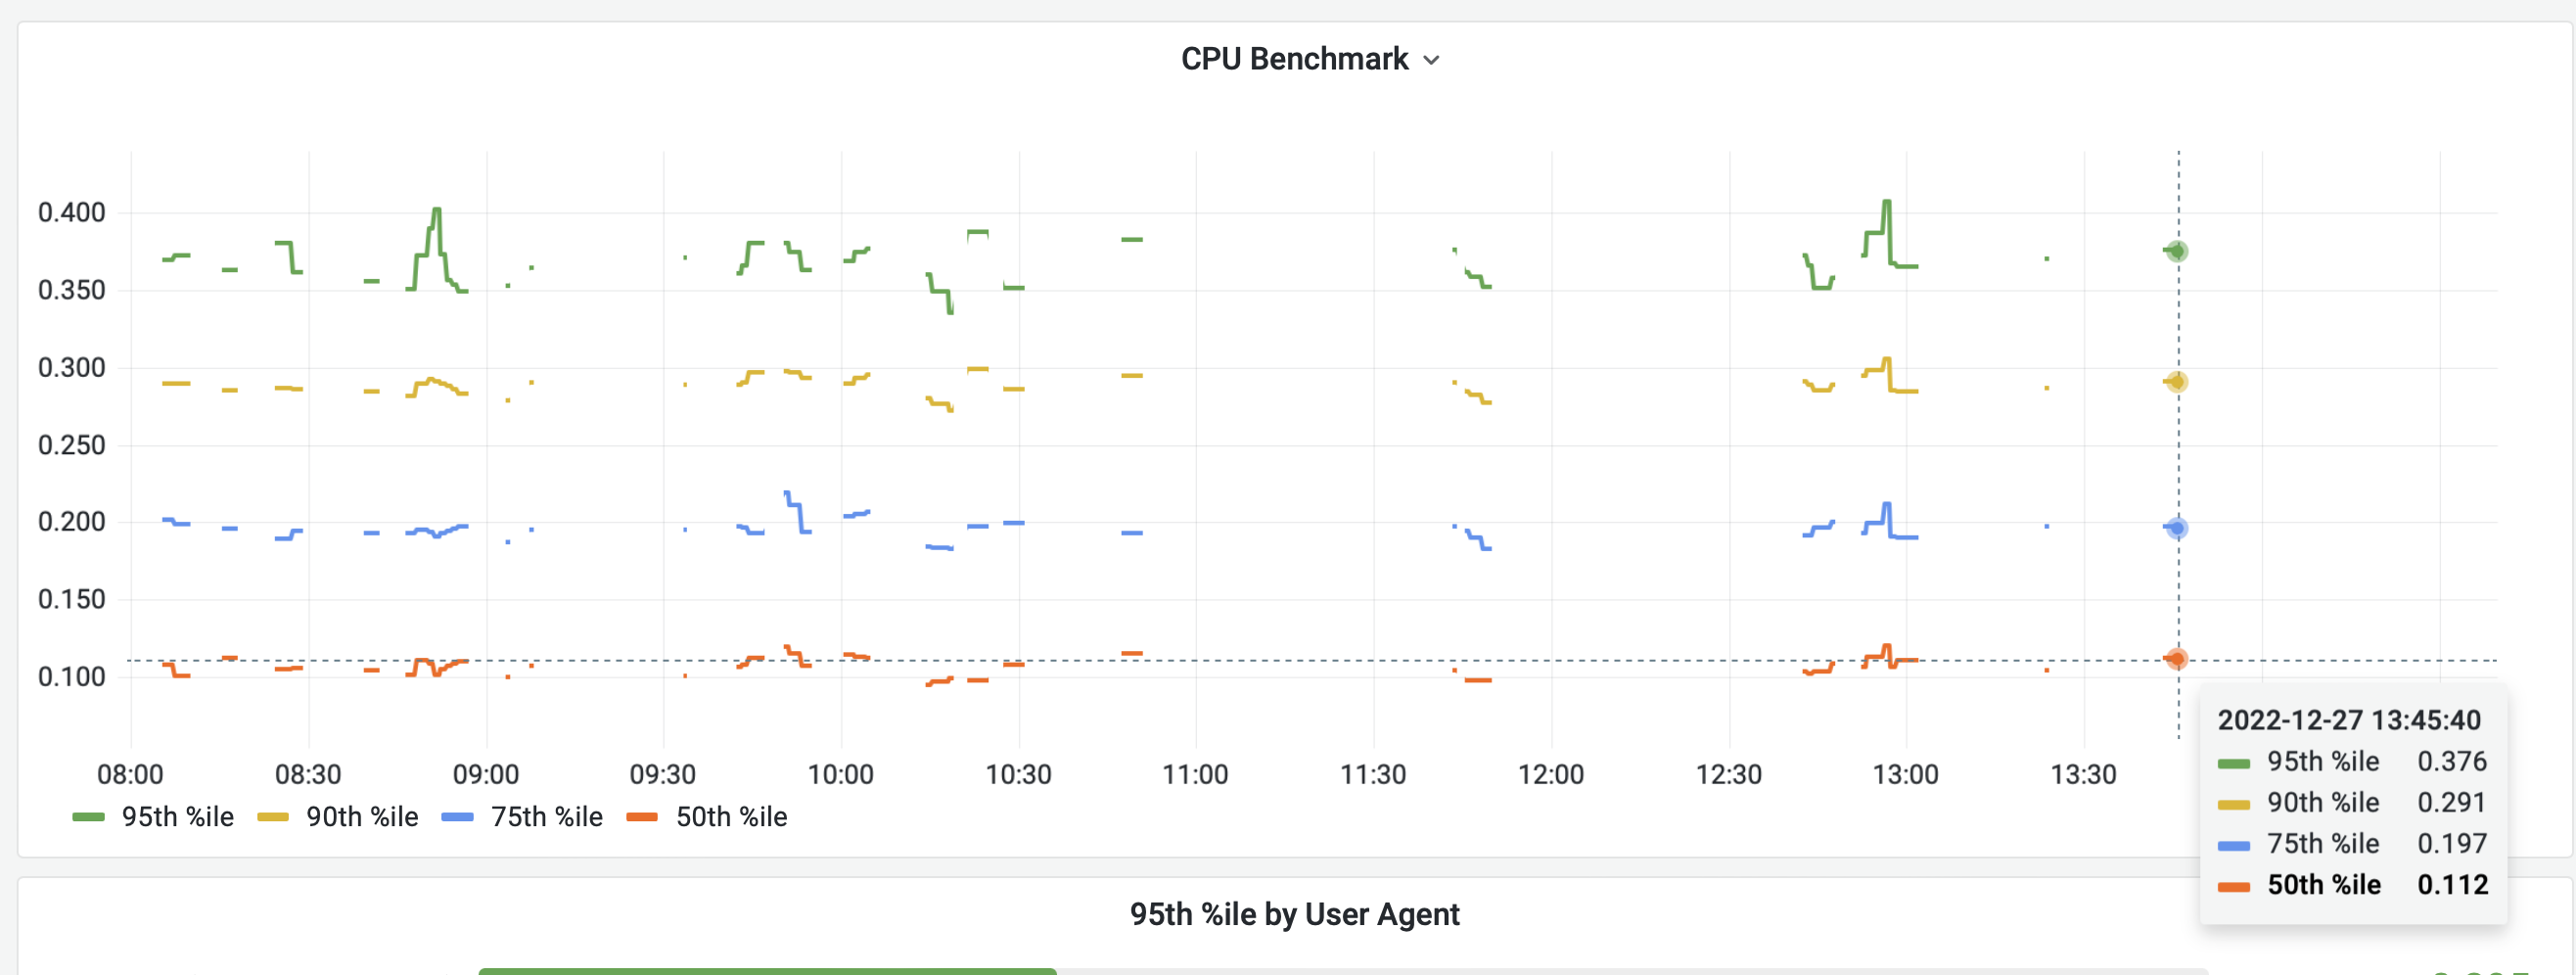
It seems like we stopped reporting metrics to Prometheus. Checking the dashboard I created before the holidays stopped working and in the CPU dashboard I can see the last reported metrics happened the 27.
| Peter | |
| Jan 3 2023, 8:02 AM |
| F35998203: Screenshot 2023-01-05 at 16.04.15.png | |
| Jan 5 2023, 4:29 PM |
| F35990448: Screenshot 2023-01-05 at 08.08.21.png | |
| Jan 5 2023, 8:03 AM |
| F35968500: Screenshot 2023-01-04 at 09.43.27.png | |
| Jan 4 2023, 8:45 AM |
| F35959394: Screenshot 2023-01-03 at 09.02.04.png | |
| Jan 3 2023, 8:02 AM |
It seems like we stopped reporting metrics to Prometheus. Checking the dashboard I created before the holidays stopped working and in the CPU dashboard I can see the last reported metrics happened the 27.
I deployed the changes that was merged before Christmas and the ones @Krinkle fixed and now it works again. Lets keep a close watch and see what happens.
Where been missing metrics back and forth and when I check the time it takes to get the metrics on localhost (curl -o /dev/null -s -w 'Total: %{time_total}s\n' localhost:9230/metric) it takes more than 40 seconds to get them,
Change 875264 had a related patch set uploaded (by Filippo Giunchedi; author: Filippo Giunchedi):
[operations/puppet@production] prometheus: bump scrape timeout for webperf
Change 875264 merged by Filippo Giunchedi:
[operations/puppet@production] prometheus: bump scrape timeout for webperf
Change 875462 had a related patch set uploaded (by Phedenskog; author: Phedenskog):
[performance/navtiming@master] Disable loadEventEnd and ttfb.
Change 875462 merged by jenkins-bot:
[performance/navtiming@master] Disable loadEventEnd and ttfb.
Change 875955 had a related patch set uploaded (by Krinkle; author: Krinkle):
[performance/navtiming@master] Add support for --kafka-fixture to stub out live Kafka
On latest master with this patch checked out, navtiming --kafka-fixture events.json takes:
If I revert bb2bf6f976 on top of this and run it again, I get:
After the navtiming process finished processing the fixture and enters its idle mode, I started https://github.com/benfred/py-spy in one tab, and ran curl in to scrape in an infinite loop in a second tab:
$ .tox/py3/bin/navtiming  --kafka-fixture ./events.json
[…]
Reached end of kafka fixture file, going to sleep for 1 hour...
$ sudo py-spy record -o profile.svg --pid 52597$ watch -n0 'curl -o /dev/null -s localhost:9230/metric --compressed'Result after 15 minutes and 95K stack samples at 100/s: https://people.wikimedia.org/~krinkle/T326118-profile.svg
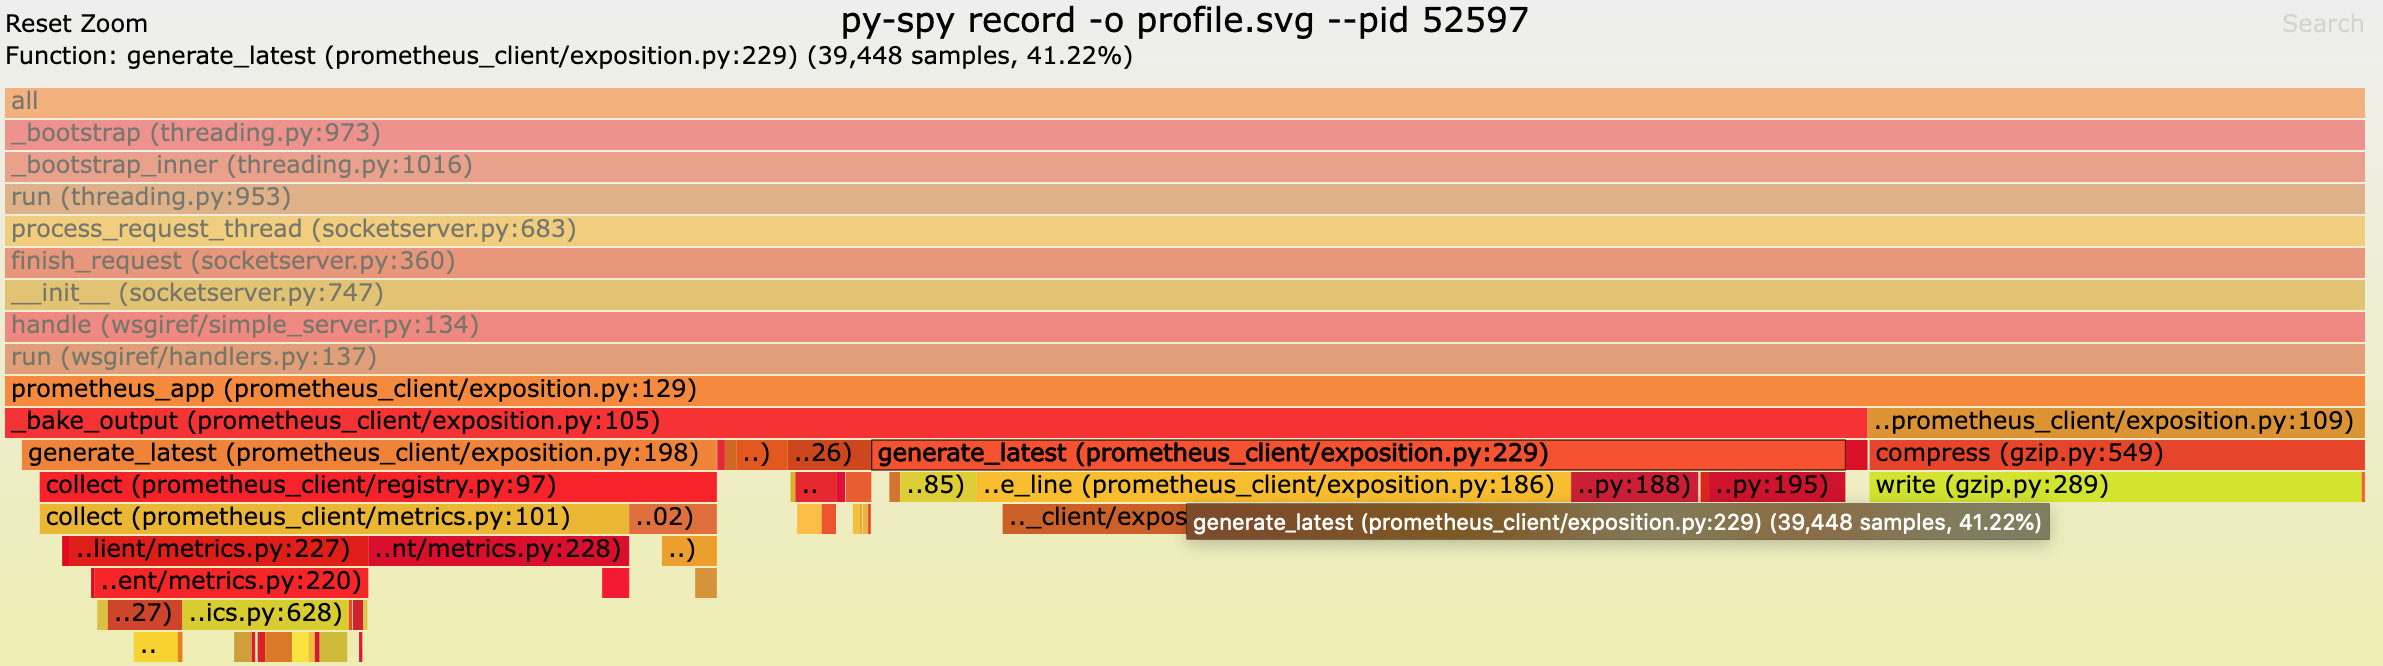
It looks like the method responsible in python-prometheus-client for responding to scrape requests is _bake_output (prometheus/client_python@v0.15.0:/exposition.py), which spends its time as follow:
A useful guide for me was https://prometheus.io/docs/instrumenting/writing_clientlibs/ which describes the terminology used in prometheus client codebases.
I found no major inefficiencies in the low-level logic. I could squeeze maybe 2-5% with micro optims but on the whole its code is quite minimal. It remains odd of course that it'd take a dozen seconds to translate its memory data into a few 100K lines of plain text. But, fixing that might require a larger overhaul upstream. This may be worthwhile, but, is involves more non-trivial code review from upstream. Proably worth asking first.
The two things that stand out the most:
Change 876001 had a related patch set uploaded (by Krinkle; author: Krinkle):
[performance/navtiming@master] Apply new buckets to navtiming_responsestart_by_cache_host also
Change 876002 had a related patch set uploaded (by Krinkle; author: Krinkle):
[performance/navtiming@master] Reduce cardinality of 'namespace' label in navtiming metrics
Change 876001 merged by jenkins-bot:
[performance/navtiming@master] Apply new buckets to navtiming_responsestart_by_cache_host also
Change 876002 merged by jenkins-bot:
[performance/navtiming@master] Reduce cardinality of 'namespace' label in navtiming metrics
Change 881407 had a related patch set uploaded (by Krinkle; author: Phedenskog):
[performance/navtiming@master] Reduce ua/browser cardinality for Prometheus.
I counted the number of lines that is returned and at the moment it is 748785. Earlier today I could see that getting the metrics from Prometheus takes 40+ seconds sometimes.
Change 882763 had a related patch set uploaded (by Krinkle; author: Krinkle):
[performance/navtiming@master] Reduce cardinality of 'namespace' label in navtiming metrics
Change 881407 had a related patch set uploaded (by Krinkle; author: Phedenskog):
[performance/navtiming@master] Reduce ua/browser cardinality for Prometheus.
Change 881407 merged by jenkins-bot:
[performance/navtiming@master] Reduce ua/browser cardinality for Prometheus.
Change 882763 merged by jenkins-bot:
[performance/navtiming@master] Consolidate mw_context labels to reduce cardinality further