Page MenuHomePhabricator

[BUG] NewImpact: Charts should be consistent LTR direction even in RTL languages
Closed, ResolvedPublicBUG REPORT

Description

Steps:
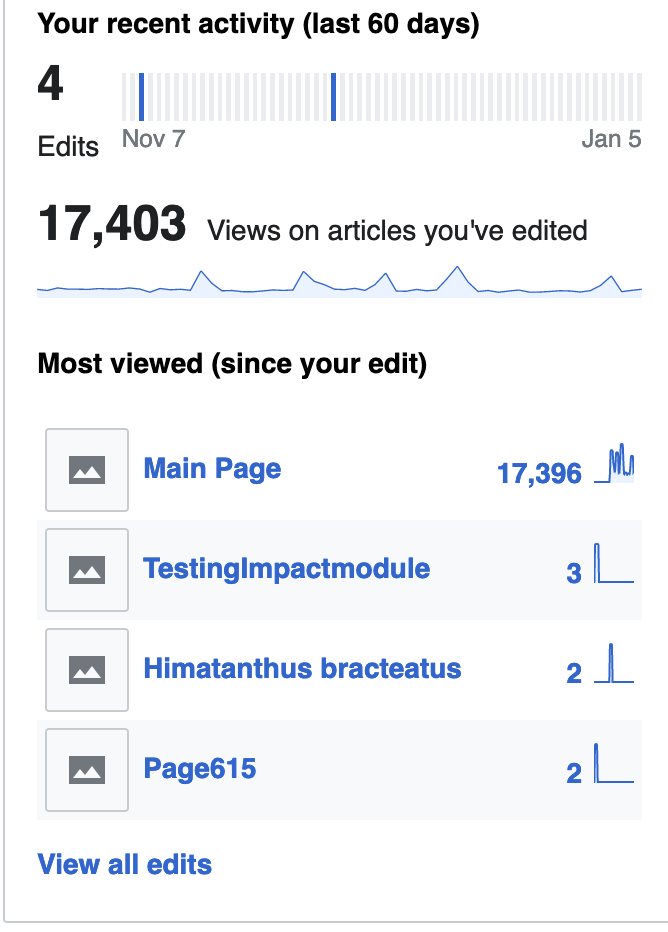
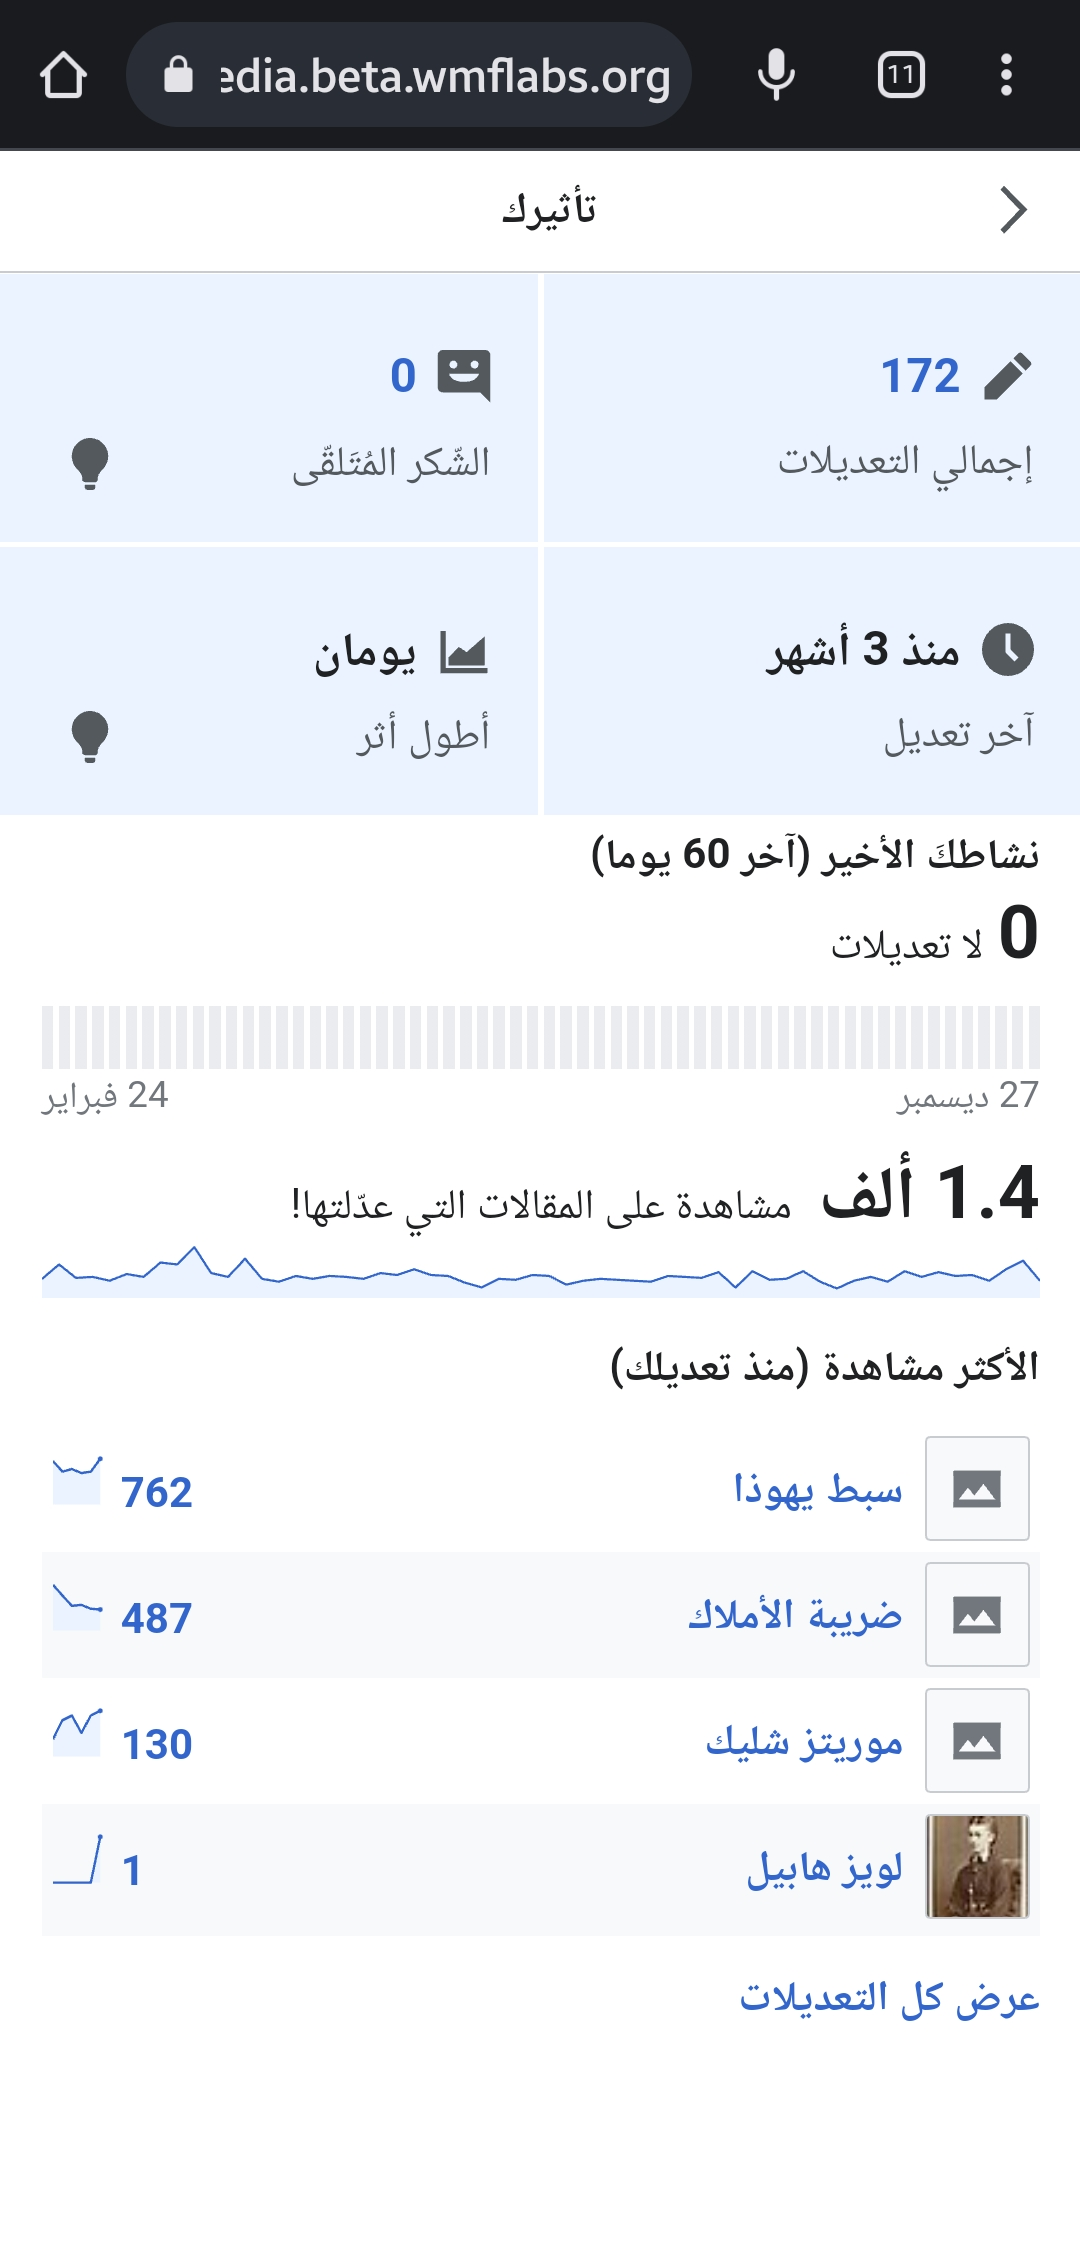
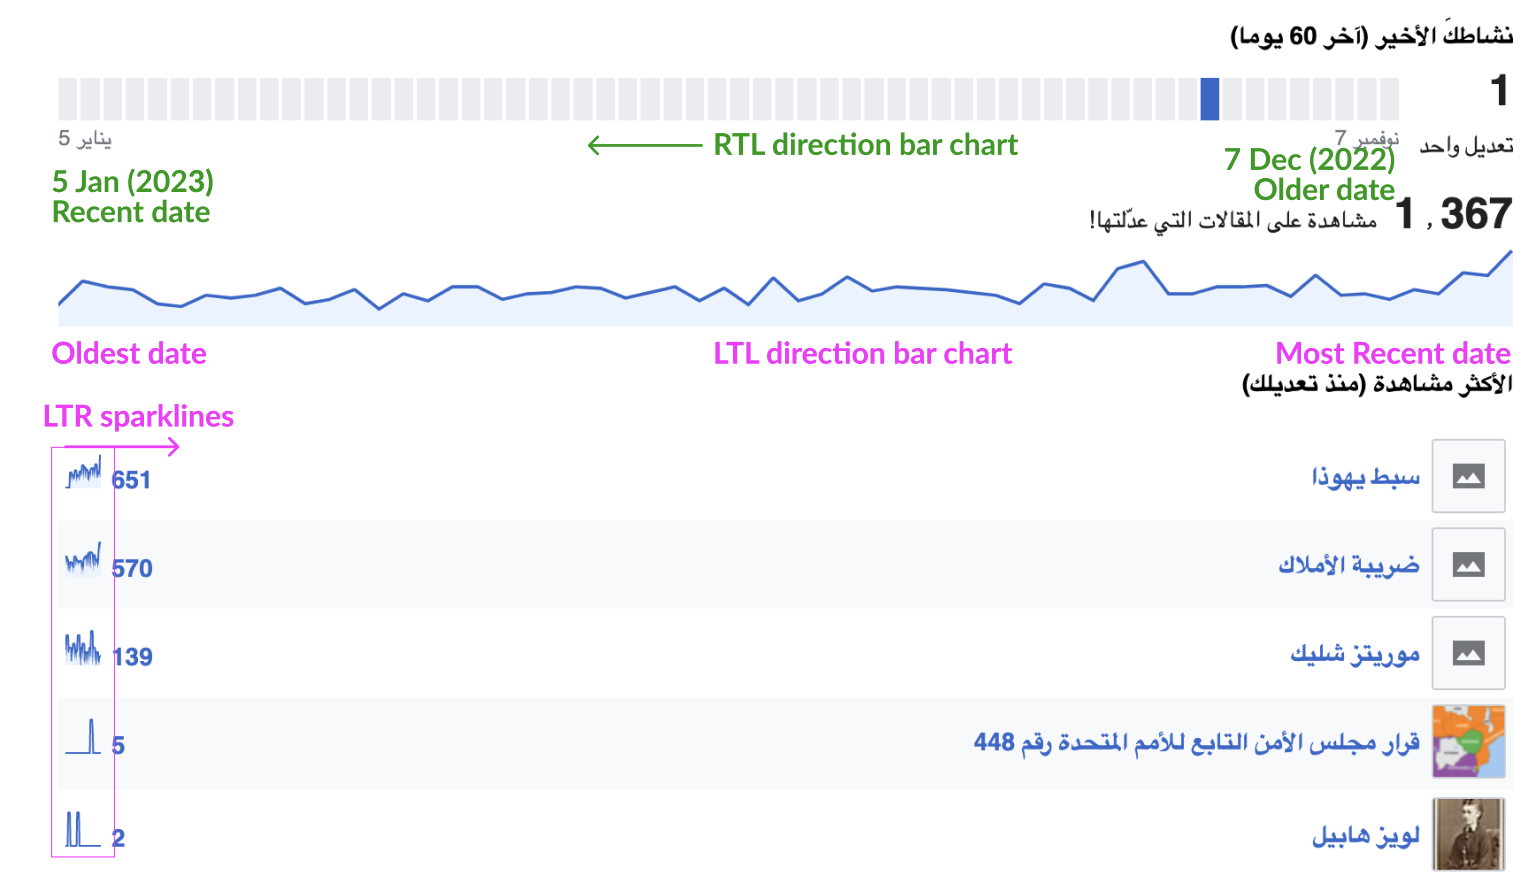
Go to the new impact module on an RTL language.

Actual:
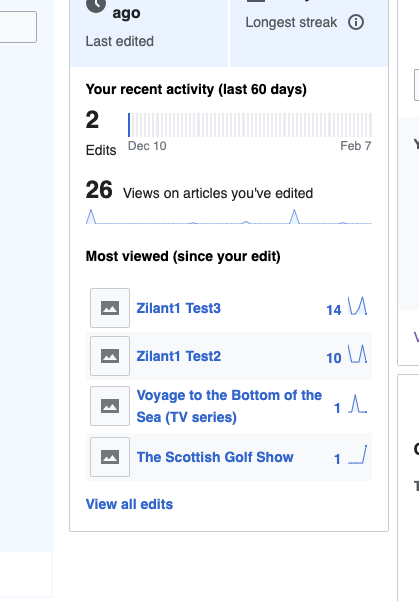
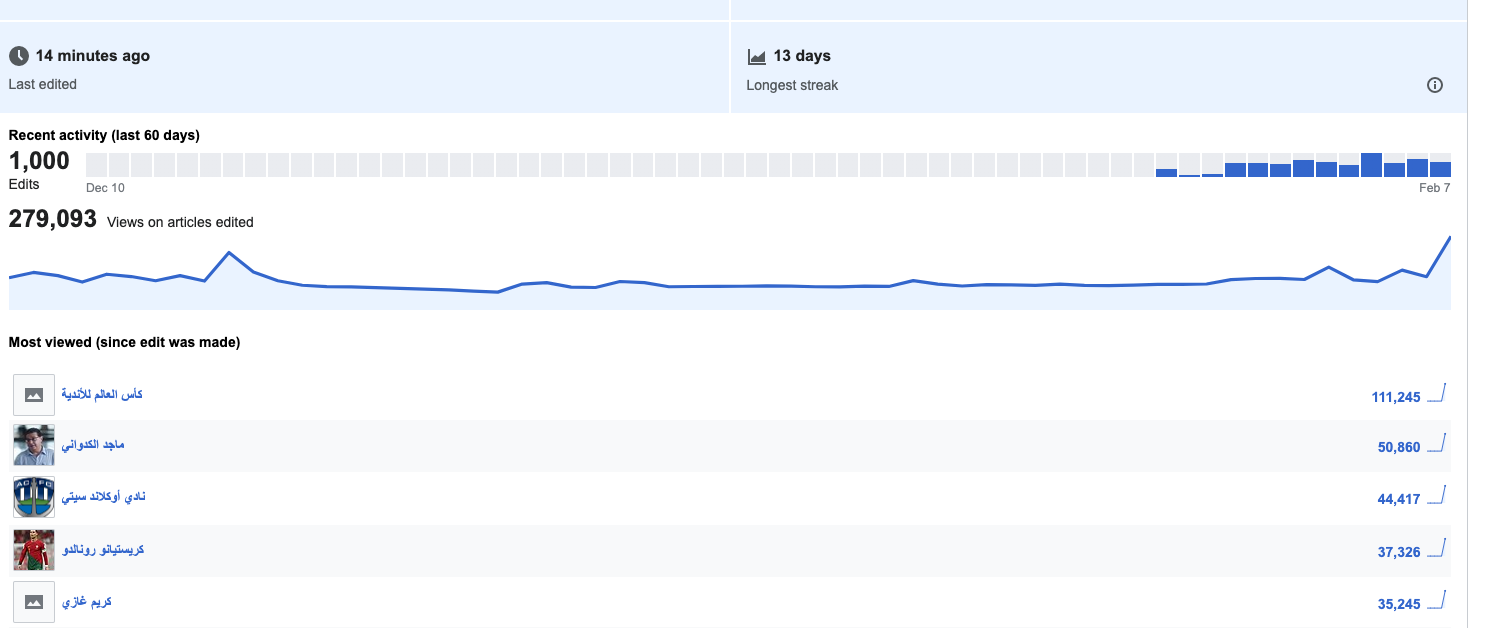
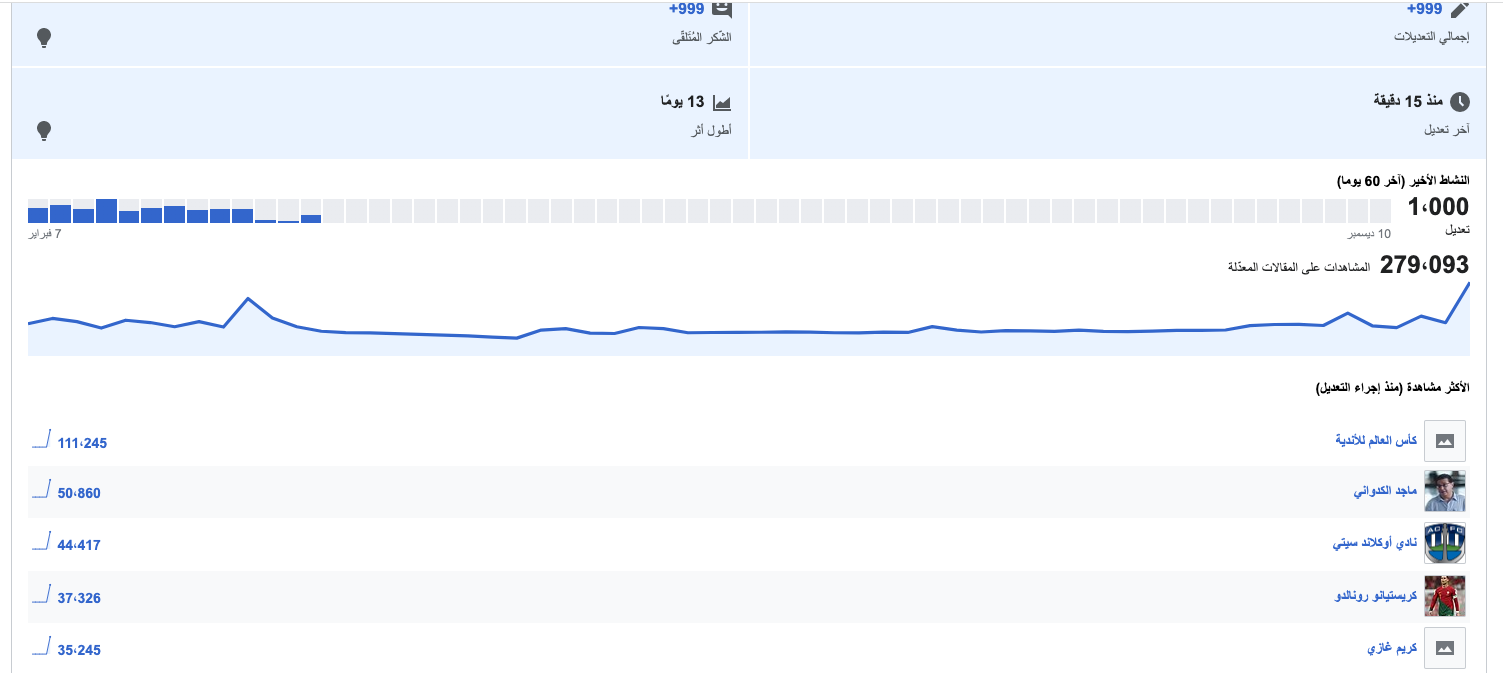
The sparkline for the total view count and individual sparklines each most viewed article in the list are showing charts from LTR (oldest date left, most recent date right), whilst the bar chart for the number of edits daily correctly shows oldest date on the right and most recent date label on the left).

image.png (890×1 px, 201 KB)

Expected:
All charts should be the same LTR direction, so the bar chart should be flipped back to show the most recent date on the right.

  • This is per reasons outlined in this ticket's thread and captured more fully in T300053:
    • Generally the expectation from Persian, Hebrew, and Arabic speakers is that graphs are shown LTR.
    • Having the labelled horizontal axis makes this clear in the case of the bar chart
    • Sparklines open to the Pageviews which also shows the chart in LTR, so it is consistent with expectations.

First commented by @Dyolf77_WMF via @KStoller-WMF within T279439#8487721:

Event Timeline

Restricted Application changed the subtype of this task from "Task" to "Bug Report". · View Herald TranscriptJan 5 2023, 1:05 PM
Restricted Application added a subscriber: Aklapper. · View Herald Transcript

Sorry, I should have mentioned that @Dyolf77_WMF mentioned that (at least in Arabic) that LTR was actually preferable for data visualizations like this. So I think the current LTR functionality is actually preferred... the problem was simply that he wasn't sure if it was LTR or RTL since it's a sparkline with no axis and there was no info clarifying. That being said, I was able to quickly determine it was LTR when clicking through to the https://pageviews.wmcloud.org pageview graph, so maybe it's not a big deal?

@RHo do you think we should decline this, or do you think we need to consider other improvements?

Oh hmm I did some light reading on this about the lack of support for RTL data-visualisations as the reason it seems for Arabic readers being comfortable either way. I do think that within the impact module it is confusing that the bar chart is correctly showing dates (Left:most recent -- Right:Oldest) but the spark lines are not, so would prefer to fix it so that it is consistent one way or another.
That the Pageview graph is not supporting LTR is perhaps a factor in keeping it LTR, but at the same time I wonder if we should perpetuate a not-ideal reading experience. Interested to hear opinion from @Dyolf77_WMF and other RTL readers?

I recall that @Sgs and I did some research into this back in October/November (I don't know if we documented our readings anywhere, unfortunately) and it seemed like best practice is to keep sparklines and charts more generally LTR. Maybe adding start/end dates below the sparkline, like we do for "Your recent activity", would be sufficient to inform the user:

image.png (932×668 px, 75 KB)

That doesn't help with the mini sparklines next to each article, but if the user figures out that the big one is LTR, then they would assume the small ones are also LTR?

RHo renamed this task from [BUG] NewImpact: Sparklines charts should read right-to-left for RTL languages to [BUG] NewImpact: Sparklines charts should be consistent direction RTL languages .Jan 6 2023, 12:20 PM
RHo updated the task description. (Show Details)

At least for Persian, it seems graphs are LTR. Here are two examples from two different books on different topics:

image.png (4×3 px, 2 MB)

image.png (4×3 px, 3 MB)

Intuitively if I need to make time range graph on a paper, I start from left as well.

It might be different in different RTL languages though

I remember from math and stock charts that graphs are continuing to be LTR in RTL environment.

Graphs in schools of Tunisia (in Arabic) are LTR
{F36059632}

photo_2023-01-08_19-06-44.jpg (960×1 px, 117 KB)
,
however, in the Impact module reading experience, my thoughts are to keep graphics RTL because we don't have a displayed captions/names/labels for axes. So it's more natural to read graphs as to read text.

RHo renamed this task from [BUG] NewImpact: Sparklines charts should be consistent direction RTL languages to [BUG] NewImpact: Charts should be consistent LTR direction even in RTL languages .Jan 9 2023, 12:36 PM
RHo updated the task description. (Show Details)

Graphs in schools of Tunisia (in Arabic) are LTR
{F36059632}

photo_2023-01-08_19-06-44.jpg (960×1 px, 117 KB)
,
however, in the Impact module reading experience, my thoughts are to keep graphics RTL because we don't have a displayed captions/names/labels for axes. So it's more natural to read graphs as to read text.

hi @Dyolf77_WMF - I initially thought so as well, but since it seems like it is expected to be LTR, and the pageviews page that the sparklines open to also shows the charts in LTR, I think the thing to do here is to actually fix the bar chart to be LTR for consistency with how charts are read in RTL languages. This seems better as well as the bar chart has the dates on there to emphasize this expectation for the sparkline charts. Thanks for raising this issue in the first place, as it is a good use case to cite for guidelines being developed on T300053 and T280847

Change 877200 had a related patch set uploaded (by Sergio Gimeno; author: Sergio Gimeno):

[mediawiki/extensions/GrowthExperiments@master] User impact: always display the streak graph LTR

https://gerrit.wikimedia.org/r/877200

Change 877200 merged by jenkins-bot:

[mediawiki/extensions/GrowthExperiments@master] User impact: always display the streak graph LTR

https://gerrit.wikimedia.org/r/877200

Etonkovidova subscribed.

Checked in testwiki wmf.22 and arwiki wmf.21 .

  • the sparklines are displayed LTR
Screen Shot 2023-02-07 at 3.41.27 PM.png (601×419 px, 47 KB)
Screen Shot 2023-02-07 at 3.42.10 PM.png (599×347 px, 39 KB)
  • the bar chart displays dates in RTL (I used Special/Impact/[user_name])
Screen Shot 2023-02-07 at 3.51.40 PM.png (628×1 px, 88 KB)
Screen Shot 2023-02-07 at 3.52.05 PM.png (673×1 px, 90 KB)

@Dyolf77_WMF - it'd be great if you can review it.

Screen Shot 2023-02-07 at 3.42.10 PM.png (599×347 px, 39 KB)

Happened upon this, and I note that while the sparklines are correctly oriented, it seems that the numbers next to them are cut off.. That might be a separate or even known issue, but I figured I'd point that out in case it is not...

Screen Shot 2023-02-07 at 3.42.10 PM.png (599×347 px, 39 KB)

Happened upon this, and I note that while the sparklines are correctly oriented, it seems that the numbers next to them are cut off.. That might be a separate or even known issue, but I figured I'd point that out in case it is not...

Thank you, @TheDJ for confirming the sparkline direction. I'm marking this task as Resolved.

Re the issue of the numbers displayed cut off - it'd be great if you could file a task since I won't be able to provide enough context on how Eastern Arabic numerals should be displayed. Thx, again!

@Dyolf77_WMF - it'd be great if you can review it.

Screenshot_20230224_185243_Chrome.png (2×1 px, 280 KB)

Hi @Etonkovidova, the looking is correct as I see in the screenshot.

@Dyolf77_WMF - it'd be great if you can review it.

Screenshot_20230224_185243_Chrome.png (2×1 px, 280 KB)

Hi @Etonkovidova, the looking is correct as I see in the screenshot.

Thanks @Dyolf77_WMF!