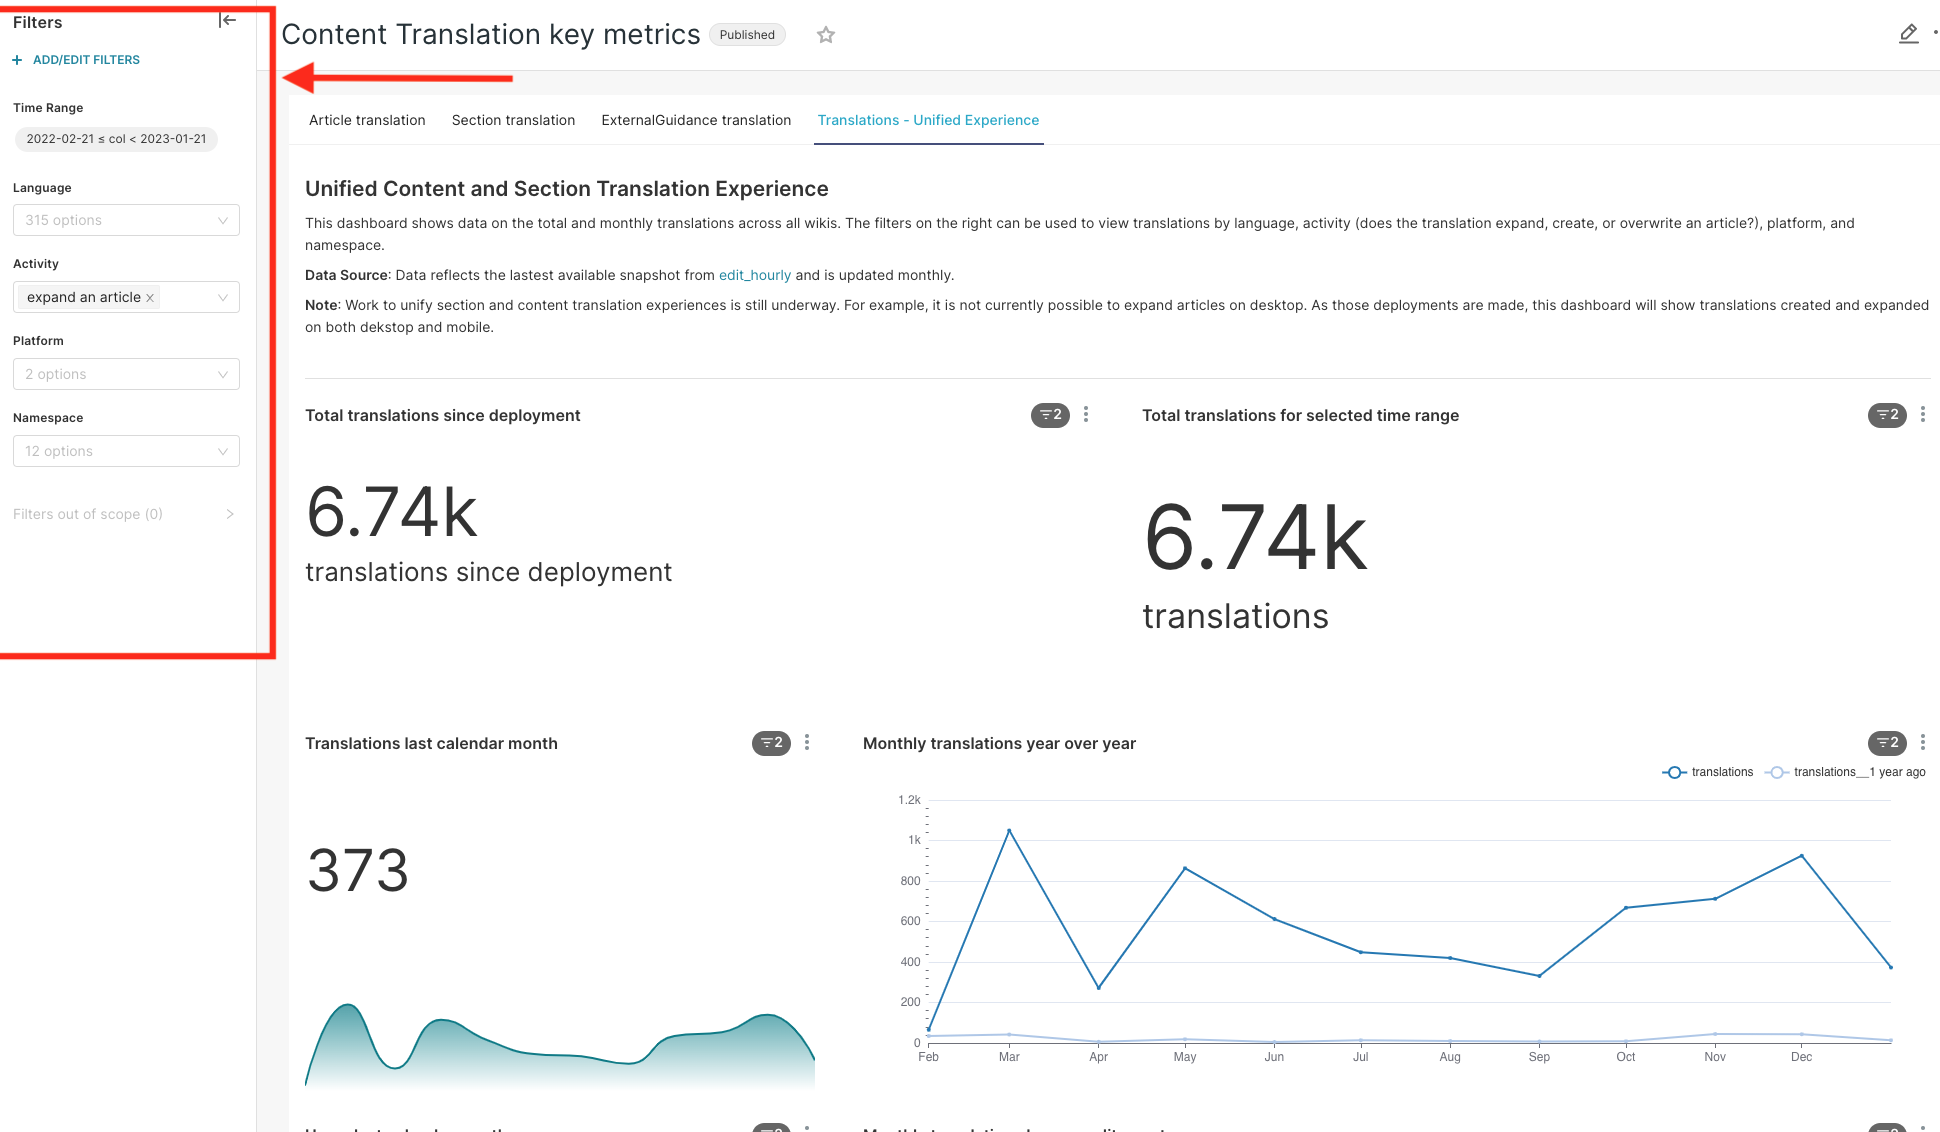
An initial version of the unified translation activity stats dashboard was complete din T310774. It provides a great overview of the basic translation metrics that can be filtered to focus on the different type of translations supported.
Currently, the dashboard shows the number of translations split by user expertise. However, there is no overview of the current number of users that have participated in translaiton activities. This ticket proposes to create an overview graph on the number of users. The graph for users can use the style of the "Translation last calendar month" and be placed next to "Monthly translations by user edit count". The table below shows the current and proposed change for the dashboard.
| Current | Proposed |
|---|---|
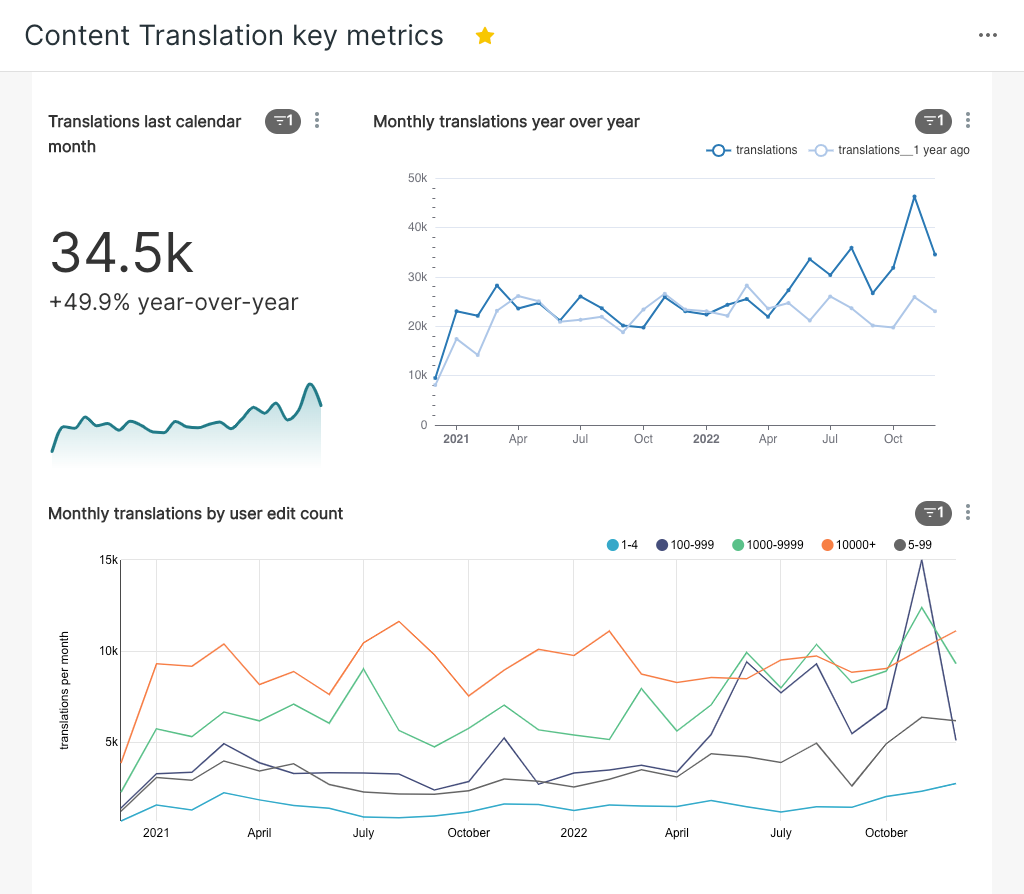 | 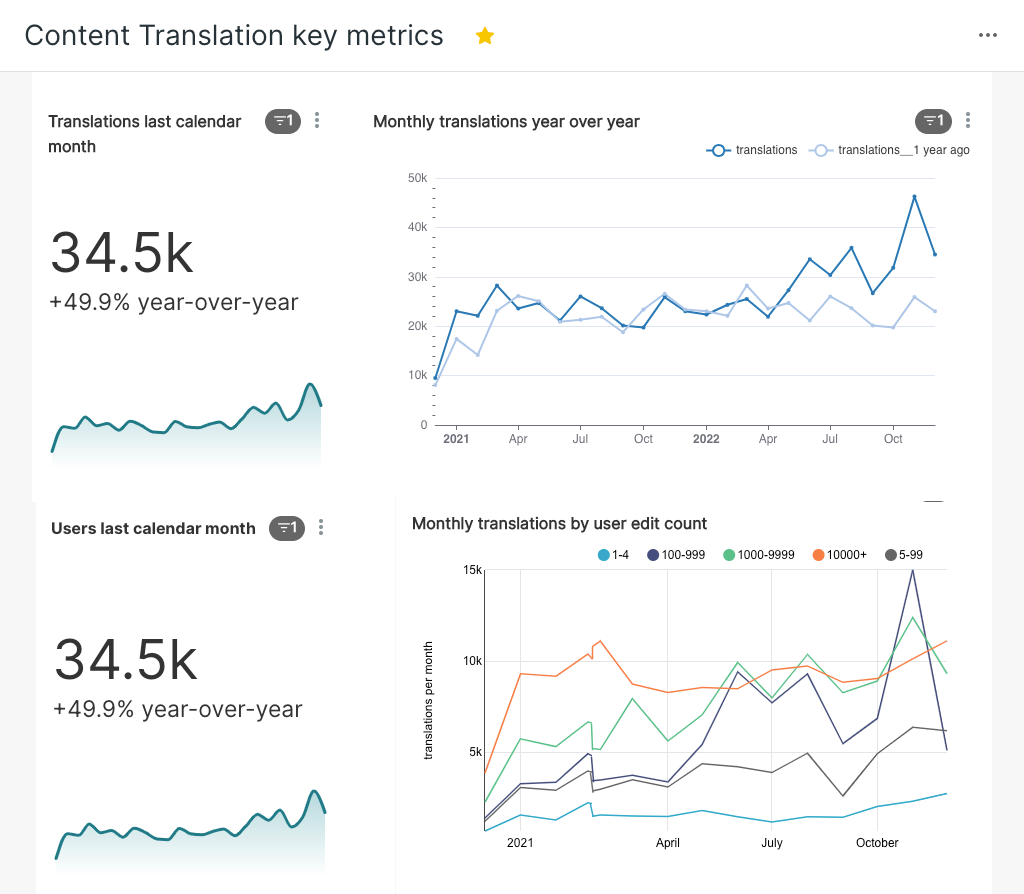 |