Page MenuHomePhabricator

Thanos rule evaluation alerts for service_slis
Closed, ResolvedPublic8 Estimated Story Points

Description

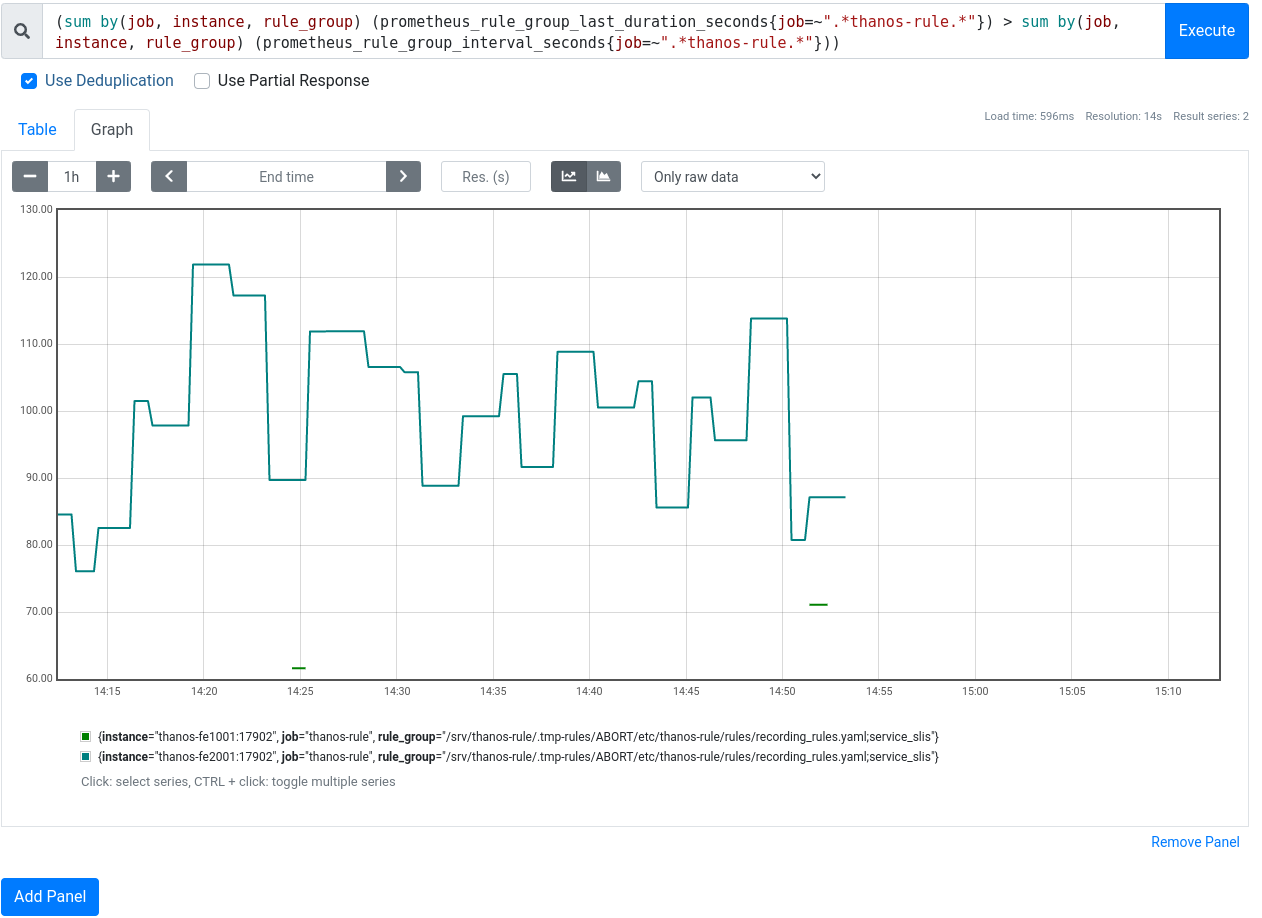
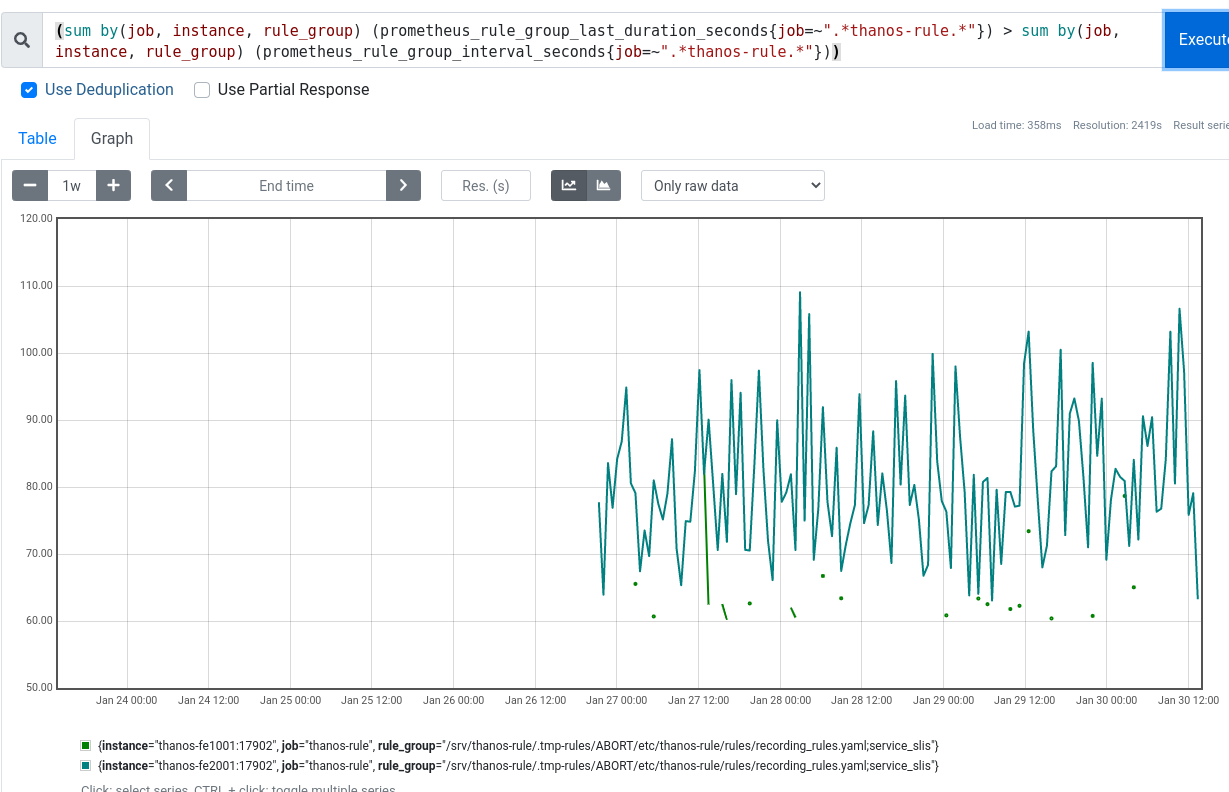
With the sli recording rules added as part of T323064: Create WDQS Uptime SLO dashboard in Grizzly we're pushing the threshold were evaluating a rule (group) takes longer than the evaluation interval (60s) leading to alerts:

2023-01-30-145501_1229x792_scrot.png (792×1 px, 104 KB)

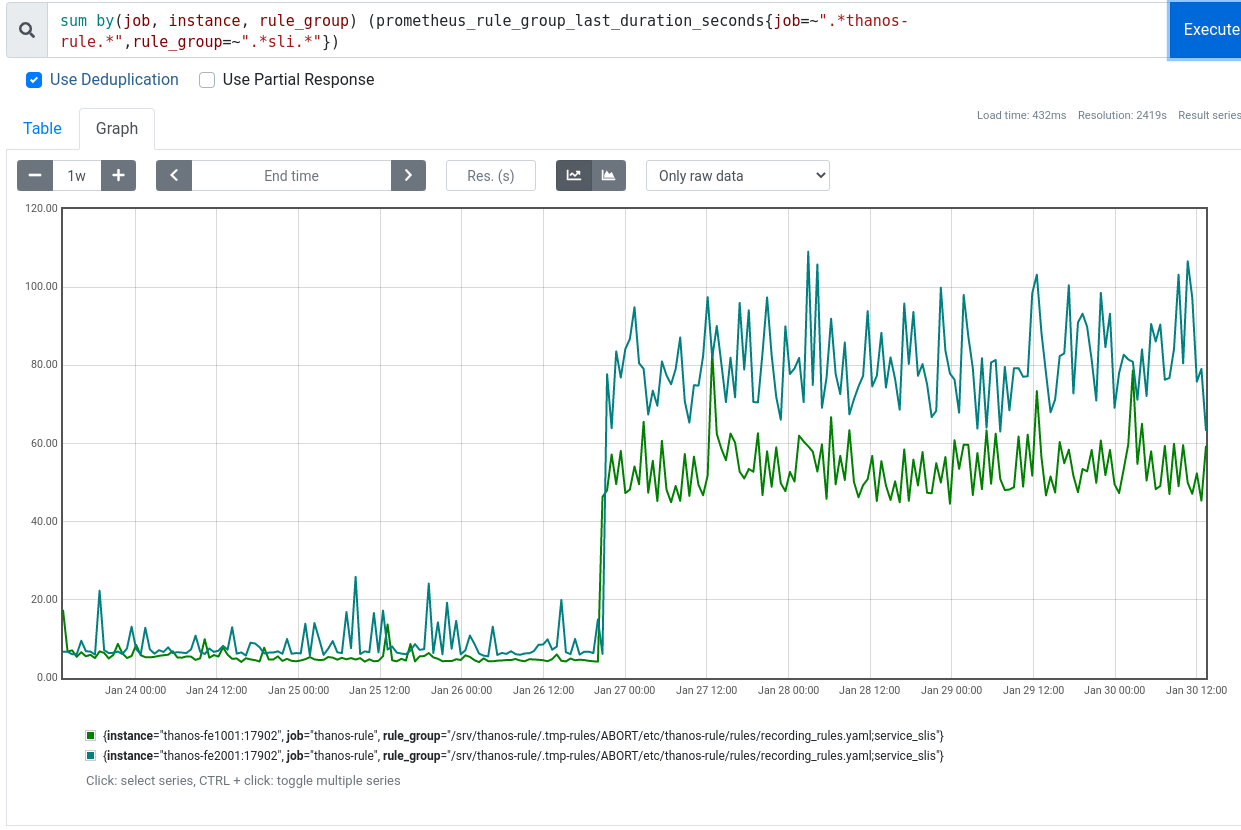
AFAICT this is due to the fact that trafficserver_backend_requests_seconds_count is a "big" metric (broken down by single cache host for example) and thus takes a while to query across the infra, even more so when asking 90/91/92 days of history.

In total rule evaluation for service_slis group jumped from <10s to >60s (i.e. not being able to keep up with evaluation interval)

2023-01-30-150232_1241x830_scrot.png (830×1 px, 119 KB)

In terms of solutions/mitigations we can:

  • in the short term isolate the wdqs sli into their own rule group
  • also in the short term increase the evaluation interval of said group to evaluate every 3-4 minutes
  • medium term, evaluate (hah!) if we can reformulate these rules in terms of lower-cardinality and pre-aggregated rules for example in modules/profile/files/prometheus/rules_ops.yml for per-backend ATS availability we have:
- record: job_backend:trafficserver_backend_requests:avail5m
  expr: sum by(backend, job) (job_method_status_backend_layer:trafficserver_backend_requests_seconds_count:rate5m{status=~"5.."})
    / sum by(backend, job) (job_method_status_backend_layer:trafficserver_backend_requests_seconds_count:rate5m{status=~"[12345].."})

Event Timeline

Change 884906 had a related patch set uploaded (by Filippo Giunchedi; author: Filippo Giunchedi):

[operations/puppet@production] thanos: split wdqs SLIs in a new group

https://gerrit.wikimedia.org/r/884906

Change 884906 merged by Filippo Giunchedi:

[operations/puppet@production] thanos: split wdqs SLIs in a new group

https://gerrit.wikimedia.org/r/884906

ok the short term bandaid did help:

(sum by(job, instance, rule_group) (prometheus_rule_group_last_duration_seconds{job=~".*thanos-rule.*"}) > sum by(job, instance, rule_group) (prometheus_rule_group_interval_seconds{job=~".*thanos-rule.*"}))

2023-01-30-161307_1262x918_scrot.png (918×1 px, 94 KB)

Going through lower cardinality metrics is still to be discussed, happy to assist in the discussion but unfortunately I can't directly follow the implementation/task. What do you think @RKemper @herron ?

Thanks @fgiunchedi. I'll pop by observbility IRC channel tomorrow (weds america daytime) and see if there's any ideas on lowering the cardinality

Change 900430 had a related patch set uploaded (by Ryan Kemper; author: Ryan Kemper):

[operations/grafana-grizzly@master] [WIP] wdqs: test new metric option

https://gerrit.wikimedia.org/r/900430

Gehel set the point value for this task to 8.Mar 20 2023, 7:39 PM

Change 900430 merged by Ryan Kemper:

[operations/grafana-grizzly@master] wdqs: make sli uptime use pre-existing metric

https://gerrit.wikimedia.org/r/900430

Change 911936 had a related patch set uploaded (by Ryan Kemper; author: Ryan Kemper):

[operations/grafana-grizzly@master] wdqs: try alternative slo query approach

https://gerrit.wikimedia.org/r/911936

Change 911936 merged by Ryan Kemper:

[operations/grafana-grizzly@master] wdqs: try alternative slo query approach

https://gerrit.wikimedia.org/r/911936

Change 912382 had a related patch set uploaded (by Ryan Kemper; author: Ryan Kemper):

[operations/puppet@production] wdqs: no longer need recording rule

https://gerrit.wikimedia.org/r/912382

Change 912382 merged by Ryan Kemper:

[operations/puppet@production] wdqs: no longer need recording rule

https://gerrit.wikimedia.org/r/912382

@Gehel With the recording rule removed in https://gerrit.wikimedia.org/r/912382, there shouldn't be any performance issues since we're not recording anything. The latest query settings in https://gerrit.wikimedia.org/r/c/operations/grafana-grizzly/+/917938 and previous patches are sufficient for acceptable performance on the query, i.e. we don't get timeouts when viewing the graph.

So this should be ready to be marked resolved.