Related Objects
Event Timeline
Looking into this is probably twofold:
- Boot time is slow (i.e. the node is not even up yet)
- Recovery is slow (i.e. the node re-joins the cluster)
These might or might not be related.
Writing down some observations from scaling up production:
Boot Time
Right after the pod for an ES node gets created, it "boots", meaning the container process is running, but the node is not ready / able to join the ElasticSearch cluster yet. For unknown reasons, this stalls for ~30 minutes (less in staging) on loading the WMF provided extra plugin (this plugin is required by WikibaseCirrrusSearch and WikibaseLexemeCirrusSearch):
[2023-02-06T17:54:14,586][INFO ][o.e.e.NodeEnvironment    ] [elasticsearch-master-0] using [1] data paths, mounts [[/usr/share/elasticsearch/data (/dev/sde)]], net usable_space [7.8gb], net total_space [9.7gb], types [ext4]
[2023-02-06T17:54:14,588][INFO ][o.e.e.NodeEnvironment    ] [elasticsearch-master-0] heap size [32gb], compressed ordinary object pointers [false]
[2023-02-06T17:54:14,853][INFO ][o.e.n.Node               ] [elasticsearch-master-0] node name [elasticsearch-master-0], node ID [Gaovzl9tSUKnb9vrT9q-7w]
[2023-02-06T17:54:14,853][INFO ][o.e.n.Node               ] [elasticsearch-master-0] version[6.8.23], pid[1], build[default/docker/4f67856/2022-01-06T21:30:50.087716Z], OS[Linux/5.10.147+/amd64], JVM[AdoptOpenJDK/OpenJDK 64-Bit Server VM/15.0.1/15.0.1+9]
[2023-02-06T17:54:14,853][INFO ][o.e.n.Node               ] [elasticsearch-master-0] JVM arguments [-Xms1g, -Xmx1g, -XX:+UseG1GC, -XX:G1ReservePercent=25, -XX:InitiatingHeapOccupancyPercent=30, -Des.networkaddress.cache.ttl=60, -Des.networkaddress.cache.negative.ttl=10, -XX:+AlwaysPreTouch, -Xss1m, -Djava.awt.headless=true, -Dfile.encoding=UTF-8, -Djna.nosys=true, -XX:-OmitStackTraceInFastThrow, -XX:+ShowCodeDetailsInExceptionMessages, -Dio.netty.noUnsafe=true, -Dio.netty.noKeySetOptimization=true, -Dio.netty.recycler.maxCapacityPerThread=0, -Dlog4j.shutdownHookEnabled=false, -Dlog4j2.disable.jmx=true, -Dlog4j2.formatMsgNoLookups=true, -Djava.io.tmpdir=/tmp/elasticsearch-324425827662520165, -XX:+HeapDumpOnOutOfMemoryError, -XX:HeapDumpPath=data, -XX:ErrorFile=logs/hs_err_pid%p.log, -Xlog:gc*,gc+age=trace,safepoint:file=logs/gc.log:utctime,pid,tags:filecount=32,filesize=64m, -Djava.locale.providers=COMPAT, -XX:UseAVX=2, -Dlog4j2.formatMsgNoLookups=true, -Des.cgroups.hierarchy.override=/, -Xms32g, -Xmx32g, -Des.path.home=/usr/share/elasticsearch, -Des.path.conf=/usr/share/elasticsearch/config, -Des.distribution.flavor=default, -Des.distribution.type=docker]
[2023-02-06T17:54:15,995][INFO ][o.e.p.PluginsService     ] [elasticsearch-master-0] loaded module [aggs-matrix-stats]
[2023-02-06T17:54:15,995][INFO ][o.e.p.PluginsService     ] [elasticsearch-master-0] loaded module [analysis-common]
[2023-02-06T17:54:15,995][INFO ][o.e.p.PluginsService     ] [elasticsearch-master-0] loaded module [ingest-common]
[2023-02-06T17:54:15,996][INFO ][o.e.p.PluginsService     ] [elasticsearch-master-0] loaded module [ingest-geoip]
[2023-02-06T17:54:15,996][INFO ][o.e.p.PluginsService     ] [elasticsearch-master-0] loaded module [ingest-user-agent]
[2023-02-06T17:54:15,996][INFO ][o.e.p.PluginsService     ] [elasticsearch-master-0] loaded module [lang-expression]
[2023-02-06T17:54:15,996][INFO ][o.e.p.PluginsService     ] [elasticsearch-master-0] loaded module [lang-mustache]
[2023-02-06T17:54:15,996][INFO ][o.e.p.PluginsService     ] [elasticsearch-master-0] loaded module [lang-painless]
[2023-02-06T17:54:15,996][INFO ][o.e.p.PluginsService     ] [elasticsearch-master-0] loaded module [mapper-extras]
[2023-02-06T17:54:15,996][INFO ][o.e.p.PluginsService     ] [elasticsearch-master-0] loaded module [parent-join]
[2023-02-06T17:54:15,996][INFO ][o.e.p.PluginsService     ] [elasticsearch-master-0] loaded module [percolator]
[2023-02-06T17:54:15,996][INFO ][o.e.p.PluginsService     ] [elasticsearch-master-0] loaded module [rank-eval]
[2023-02-06T17:54:15,996][INFO ][o.e.p.PluginsService     ] [elasticsearch-master-0] loaded module [reindex]
[2023-02-06T17:54:15,996][INFO ][o.e.p.PluginsService     ] [elasticsearch-master-0] loaded module [repository-url]
[2023-02-06T17:54:15,996][INFO ][o.e.p.PluginsService     ] [elasticsearch-master-0] loaded module [transport-netty4]
[2023-02-06T17:54:15,996][INFO ][o.e.p.PluginsService     ] [elasticsearch-master-0] loaded module [tribe]
[2023-02-06T17:54:15,996][INFO ][o.e.p.PluginsService     ] [elasticsearch-master-0] loaded module [x-pack-ccr]
[2023-02-06T17:54:15,996][INFO ][o.e.p.PluginsService     ] [elasticsearch-master-0] loaded module [x-pack-core]
[2023-02-06T17:54:15,997][INFO ][o.e.p.PluginsService     ] [elasticsearch-master-0] loaded module [x-pack-deprecation]
[2023-02-06T17:54:15,997][INFO ][o.e.p.PluginsService     ] [elasticsearch-master-0] loaded module [x-pack-graph]
[2023-02-06T17:54:15,997][INFO ][o.e.p.PluginsService     ] [elasticsearch-master-0] loaded module [x-pack-ilm]
[2023-02-06T17:54:15,997][INFO ][o.e.p.PluginsService     ] [elasticsearch-master-0] loaded module [x-pack-logstash]
[2023-02-06T17:54:15,997][INFO ][o.e.p.PluginsService     ] [elasticsearch-master-0] loaded module [x-pack-ml]
[2023-02-06T17:54:15,997][INFO ][o.e.p.PluginsService     ] [elasticsearch-master-0] loaded module [x-pack-monitoring]
[2023-02-06T17:54:15,997][INFO ][o.e.p.PluginsService     ] [elasticsearch-master-0] loaded module [x-pack-rollup]
[2023-02-06T17:54:15,997][INFO ][o.e.p.PluginsService     ] [elasticsearch-master-0] loaded module [x-pack-security]
[2023-02-06T17:54:15,997][INFO ][o.e.p.PluginsService     ] [elasticsearch-master-0] loaded module [x-pack-sql]
[2023-02-06T17:54:15,997][INFO ][o.e.p.PluginsService     ] [elasticsearch-master-0] loaded module [x-pack-upgrade]
[2023-02-06T17:54:15,997][INFO ][o.e.p.PluginsService     ] [elasticsearch-master-0] loaded module [x-pack-watcher]
[2023-02-06T17:54:15,998][INFO ][o.e.p.PluginsService     ] [elasticsearch-master-0] loaded plugin [experimental-highlighter]
[2023-02-06T17:54:15,998][INFO ][o.e.p.PluginsService     ] [elasticsearch-master-0] loaded plugin [extra]
[2023-02-06T18:20:28,274][INFO ][o.e.d.DiscoveryModule    ] [elasticsearch-master-0] using discovery type [zen] and host providers [settings]
[2023-02-06T18:20:28,663][INFO ][o.e.n.Node               ] [elasticsearch-master-0] initialized
[2023-02-06T18:20:28,663][INFO ][o.e.n.Node               ] [elasticsearch-master-0] starting ...
[2023-02-06T18:20:28,776][INFO ][o.e.t.TransportService   ] [elasticsearch-master-0] publish_address {10.108.8.84:9300}, bound_addresses {0.0.0.0:9300}
[2023-02-06T18:20:31,983][INFO ][o.e.b.BootstrapChecks    ] [elasticsearch-master-0] bound or publishing to a non-loopback address, enforcing bootstrap checks
N.B.: The fact that it hangs on extra might be a red herring (note that it states "loaded" in past tense), and this is caused by something else that follows, e.g. Node Discovery.
If we look at the CPU graph for the timeframe shown in the logs, it seems the boot procedure works on a single CPU only (when it could use 10):
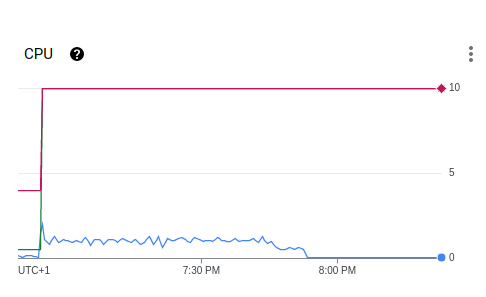
Full usage of a CPU seems to extend over the period when booting seemingly "stalls", but drops before node recovery has finished. Disk I/O seems mostly unchanged during that period, but will increase when the node starts to recover. Fluctuations in Network Traffic between nodes seem negligible.
Recovery time
Once the node has joined the cluster, it enters "recovery". This process is also very slow in production and can cause service degradation or even outage.
Looking at metrics, it seems this process is initially putting some light strain on CPU, but then has resources idling without any noticeable usage patterns.
According to some forum threads, e.g.:
- https://discuss.elastic.co/t/slow-cluster-startup-again/13870
- https://discuss.elastic.co/t/very-slow-cluster-restart/10556
this might be due to the fact that we are artificially throttled by the node_initial_primaries_recoveries settings (with a default of 4), when we could recover many more indices in parallel.
Hypothesis
Judiging from the above, we might surmise:
- Slow Boot time is CPU bound
- Slow Recovery time is configuration bound
Next steps
- See if there is anything we can do that makes booting faster by using more than a single CPU at once?
- See what happens when experimenting with node_initial_primaries_recoveries in staging
This is the ouput of kill -3ing a process that is stuck booting in staging:
Full thread dump OpenJDK 64-Bit Server VM (15.0.1+9 mixed mode, sharing):

Threads class SMR info:
_java_thread_list=0x00007faee0000d40, length=13, elements={
0x00007faf5002a7c0, 0x00007faf5061bcb0, 0x00007faf5061d4d0, 0x00007faf506222d0,
0x00007faf50623ac0, 0x00007faf50625840, 0x00007faf50627190, 0x00007faf506289b0,
0x00007faf50655d70, 0x00007faf50659920, 0x00007faf50dcbd10, 0x00007faf51a9d3d0,
0x00007faf52621230
}

"main" #1 prio=5 os_prio=0 cpu=300231.40ms elapsed=303.17s tid=0x00007faf5002a7c0 nid=0x4d runnable  [0x00007faf5a130000]
   java.lang.Thread.State: RUNNABLE
        at org.elasticsearch.common.settings.Settings$FilteredMap$1$1.hasNext(Settings.java:1276)
        at java.util.AbstractMap.putAll(java.base@15.0.1/AbstractMap.java:280)
        at java.util.TreeMap.putAll(java.base@15.0.1/TreeMap.java:326)
        at java.util.TreeMap.<init>(java.base@15.0.1/TreeMap.java:187)
        at org.elasticsearch.common.settings.Settings.<init>(Settings.java:103)
        at org.elasticsearch.common.settings.Settings.getByPrefix(Settings.java:209)
        at org.elasticsearch.common.settings.Setting$GroupSetting.get(Setting.java:890)
        at org.elasticsearch.common.settings.Setting$GroupSetting.get(Setting.java:859)
        at org.elasticsearch.common.settings.AbstractScopedSettings.archiveUnknownOrInvalidSettings(AbstractScopedSettings.java:885)
        at org.elasticsearch.cluster.metadata.MetaDataIndexUpgradeService.archiveBrokenIndexSettings(MetaDataIndexUpgradeService.java:220)
        at org.elasticsearch.cluster.metadata.MetaDataIndexUpgradeService.upgradeIndexMetaData(MetaDataIndexUpgradeService.java:95)
        at org.elasticsearch.gateway.GatewayMetaState.upgradeMetaData(GatewayMetaState.java:246)
        at org.elasticsearch.gateway.GatewayMetaState.<init>(GatewayMetaState.java:89)
        at org.elasticsearch.node.Node.<init>(Node.java:499)
        at org.elasticsearch.node.Node.<init>(Node.java:266)
        at org.elasticsearch.bootstrap.Bootstrap$5.<init>(Bootstrap.java:212)
        at org.elasticsearch.bootstrap.Bootstrap.setup(Bootstrap.java:212)
        at org.elasticsearch.bootstrap.Bootstrap.init(Bootstrap.java:333)
        at org.elasticsearch.bootstrap.Elasticsearch.init(Elasticsearch.java:159)
        at org.elasticsearch.bootstrap.Elasticsearch.execute(Elasticsearch.java:150)
        at org.elasticsearch.cli.EnvironmentAwareCommand.execute(EnvironmentAwareCommand.java:86)
        at org.elasticsearch.cli.Command.mainWithoutErrorHandling(Command.java:124)
        at org.elasticsearch.cli.Command.main(Command.java:90)
        at org.elasticsearch.bootstrap.Elasticsearch.main(Elasticsearch.java:116)
        at org.elasticsearch.bootstrap.Elasticsearch.main(Elasticsearch.java:93)

"Reference Handler" #2 daemon prio=10 os_prio=0 cpu=2.88ms elapsed=302.57s tid=0x00007faf5061bcb0 nid=0x55 waiting on condition  [0x00007faf27373000]
   java.lang.Thread.State: RUNNABLE
        at java.lang.ref.Reference.waitForReferencePendingList(java.base@15.0.1/Native Method)
        at java.lang.ref.Reference.processPendingReferences(java.base@15.0.1/Reference.java:241)
        at java.lang.ref.Reference$ReferenceHandler.run(java.base@15.0.1/Reference.java:213)

"Finalizer" #3 daemon prio=8 os_prio=0 cpu=6.54ms elapsed=302.57s tid=0x00007faf5061d4d0 nid=0x56 in Object.wait()  [0x00007faf27272000]
   java.lang.Thread.State: WAITING (on object monitor)
        at java.lang.Object.wait(java.base@15.0.1/Native Method)
        - waiting on <0x00000000801bf9d8> (a java.lang.ref.ReferenceQueue$Lock)
        at java.lang.ref.ReferenceQueue.remove(java.base@15.0.1/ReferenceQueue.java:155)
        - locked <0x00000000801bf9d8> (a java.lang.ref.ReferenceQueue$Lock)
        at java.lang.ref.ReferenceQueue.remove(java.base@15.0.1/ReferenceQueue.java:176)
        at java.lang.ref.Finalizer$FinalizerThread.run(java.base@15.0.1/Finalizer.java:170)

"Signal Dispatcher" #4 daemon prio=9 os_prio=0 cpu=0.17ms elapsed=302.56s tid=0x00007faf506222d0 nid=0x57 waiting on condition  [0x0000000000000000]
   java.lang.Thread.State: RUNNABLE

"Service Thread" #5 daemon prio=9 os_prio=0 cpu=24.77ms elapsed=302.56s tid=0x00007faf50623ac0 nid=0x58 runnable  [0x0000000000000000]
   java.lang.Thread.State: RUNNABLE

"C2 CompilerThread0" #6 daemon prio=9 os_prio=0 cpu=8034.13ms elapsed=302.56s tid=0x00007faf50625840 nid=0x59 waiting on condition  [0x0000000000000000]
   java.lang.Thread.State: RUNNABLE
   No compile task

"C1 CompilerThread0" #7 daemon prio=9 os_prio=0 cpu=2019.73ms elapsed=302.56s tid=0x00007faf50627190 nid=0x5a waiting on condition  [0x0000000000000000]
   java.lang.Thread.State: RUNNABLE
   No compile task

"Sweeper thread" #8 daemon prio=9 os_prio=0 cpu=6.17ms elapsed=302.56s tid=0x00007faf506289b0 nid=0x5b runnable  [0x0000000000000000]
   java.lang.Thread.State: RUNNABLE

"Notification Thread" #9 daemon prio=9 os_prio=0 cpu=0.09ms elapsed=302.54s tid=0x00007faf50655d70 nid=0x5c runnable  [0x0000000000000000]
   java.lang.Thread.State: RUNNABLE


"elasticsearch[elasticsearch-master-0][[timer]]" #19 daemon prio=5 os_prio=0 cpu=68.06ms elapsed=299.08s tid=0x00007faf51a9d3d0 nid=0x65 waiting on condition  [0x00007faf25ae6000]
   java.lang.Thread.State: TIMED_WAITING (sleeping)
        at java.lang.Thread.sleep(java.base@15.0.1/Native Method)
        at org.elasticsearch.threadpool.ThreadPool$CachedTimeThread.run(ThreadPool.java:589)

"elasticsearch[elasticsearch-master-0][scheduler][T#1]" #20 daemon prio=5 os_prio=0 cpu=18.52ms elapsed=296.15s tid=0x00007faf52621230 nid=0x66 waiting on condition  [0x00007faf241c2000]
   java.lang.Thread.State: TIMED_WAITING (parking)
        at jdk.internal.misc.Unsafe.park(java.base@15.0.1/Native Method)
        - parking to wait for  <0x000000008065ae80> (a java.util.concurrent.locks.AbstractQueuedSynchronizer$ConditionObject)
        at java.util.concurrent.locks.LockSupport.parkNanos(java.base@15.0.1/LockSupport.java:252)
        at java.util.concurrent.locks.AbstractQueuedSynchronizer$ConditionObject.awaitNanos(java.base@15.0.1/AbstractQueuedSynchronizer.java:1661)
        at java.util.concurrent.ScheduledThreadPoolExecutor$DelayedWorkQueue.take(java.base@15.0.1/ScheduledThreadPoolExecutor.java:1182)
        at java.util.concurrent.ScheduledThreadPoolExecutor$DelayedWorkQueue.take(java.base@15.0.1/ScheduledThreadPoolExecutor.java:899)
        at java.util.concurrent.ThreadPoolExecutor.getTask(java.base@15.0.1/ThreadPoolExecutor.java:1056)
        at java.util.concurrent.ThreadPoolExecutor.runWorker(java.base@15.0.1/ThreadPoolExecutor.java:1116)
        at java.util.concurrent.ThreadPoolExecutor$Worker.run(java.base@15.0.1/ThreadPoolExecutor.java:630)
        at java.lang.Thread.run(java.base@15.0.1/Thread.java:832)

"VM Thread" os_prio=0 cpu=160.30ms elapsed=302.57s tid=0x00007faf50618f70 nid=0x54 runnable

"GC Thread#0" os_prio=0 cpu=1314.80ms elapsed=303.17s tid=0x00007faf50068610 nid=0x4e runnable

"GC Thread#1" os_prio=0 cpu=1285.38ms elapsed=303.17s tid=0x00007faf50085030 nid=0x51 runnable

"G1 Main Marker" os_prio=0 cpu=1.51ms elapsed=303.17s tid=0x00007faf5007a080 nid=0x4f runnable

"G1 Conc#0" os_prio=0 cpu=78.76ms elapsed=303.17s tid=0x00007faf5007b430 nid=0x50 runnable

"G1 Refine#0" os_prio=0 cpu=4.68ms elapsed=302.58s tid=0x00007faf505e6330 nid=0x52 runnable

"G1 Refine#1" os_prio=0 cpu=0.05ms elapsed=295.11s tid=0x00007faf18003eb0 nid=0x67 runnable

"G1 Young RemSet Sampling" os_prio=0 cpu=206.02ms elapsed=302.58s tid=0x00007faf505e7660 nid=0x53 runnable

"VM Periodic Task Thread" os_prio=0 cpu=187.68ms elapsed=302.54s tid=0x00007faf50657a50 nid=0x5d waiting on condition

JNI global refs: 30, weak refs: 45

Heap
 garbage-first heap   total 2097152K, used 387150K [0x0000000080000000, 0x0000000100000000)
  region size 1024K, 248 young (253952K), 1 survivors (1024K)
 Metaspace       used 49064K, capacity 51016K, committed 51280K, reserved 1093632K
class space used 6474K, capacity 7107K, committed 7168K, reserved 1048576KTesting the effects of the node_initial_primaries_recoveries setting in staging:
node_initial_primaries_recoveries: 20
Boot: 7min19s
Recovery: 7min23s
node_initial_primaries_recoveries: default
Boot: 7min53s
Recovery: 8min48s
node_initial_primaries_recoveries: 1000
Boot: 7min3s
Recovery: 7min5s
Here's a log file of randomly taking Thread Dumps while the node is stuck in booting
What is interesting to me: it seems both threads labeled elasticsearch are always waiting / sleeping. All work that is done seems to be JVM internals.
This is the log output of booting with all loggers set to DEBUG level, relevant things happen at around line 2100
Yesterday we tried a number of attempts to get a feeling for what was going on with the slow elasticsearch start up by making a number of changes on staging.
We tried to get debug logging to see what was happening during this slow start up. What appeared to be successful for actually getting log was explicitly setting all loggers to DEBUG (see: https://github.com/wmde/wbaas-deploy/commit/5943f60f5536ecff028988d3dbb741362a386bb4)
However this still didn't reveal anything more. From this snippet of debug.log (above):
[2023-02-09T10:45:38,693][DEBUG][o.e.i.IndicesQueryCache  ] [elasticsearch-master-2] using [node] query cache with size [204.7mb] max filter count [10000]
[2023-02-09T10:45:38,696][DEBUG][o.e.i.IndexingMemoryController] [elasticsearch-master-2] using indexing buffer size [204.7mb] with indices.memory.shard_inactive_time [5m], indices.memory.interval [5s]
[2023-02-09T10:53:40,540][DEBUG][o.e.g.GatewayMetaState   ] [elasticsearch-master-2] took 1.2s to load state
[2023-02-09T10:53:40,571][DEBUG][o.e.h.n.Netty4HttpServerTransport] [elasticsearch-master-2] using max_chunk_size[8kb], max_header_size[8kb], max_initial_line_length[4kb], max_content_length[100mb], receive_predictor[64kb->64kb], max_composite_buffer_components[69905], pipelining[true], pipelining_max_events[10000]
We still see almost nothing happening for more than 5 minutes.
Finally we tried (without a huge amount of planning) increasing the memory allowed for indexing https://github.com/wmde/wbaas-deploy/pull/726/files. This also seemed to have no appreciable effect
At this point we lost our optimism for finding a solution and thought we would put this on the back burner and perhaps try to seek some outside help. Staging is now back to being configured very similarly to production
A few notes:
- https://fastthread.io/ helps you parse the thread dumps and make sense of them. You'll need to upload each dump in it's own file so that the tool can parse them properly.
- Looking at the thread dumps, it looks like this instance is stuck in bootstrap, mostly in GatewayMetaState and below that in AbstractScopedSettings.archiveUnknownOrInvalidSettings(). Without digging deeper into the code, I'm not entirely sure if this is only about loading metadata from disk, or also from the current master. It points to either a way to large metadata, or corrupted metadata.
One more detail I noticed when setting up monitoring for our ES setup and encountering scraping timeouts is that we seem to have a very large "cluster state". At the time of writing the JSON doc returned from calling /_cluster/state is 378MB of size.
We just found out ES was down (as in not available at all) again tonight for ~10h because of a node upgrade.