Page MenuHomePhabricator

Overhaul reqstats
Closed, ResolvedPublic

Description

Graphite currently has a couple of reqstat. metrics, that are generated via the udp2log stream via a Perl script under puppet:./files/udp2log/sqstat.pl. Despite the crudeness, the metrics are extremely useful, especially the error ones; we plot them under http://gdash.wikimedia.org/dashboards/reqerror/ but, more recently, we also have a check_graphite alert that alerts us to spikes in errors.

Unfortunately, while we get alerted for errors, investigating them is hard. The process usually is to login to oxygen and check 5xx and try to find patterns there, such as "all esams servers". Additionally, because the udp2log stream contains the stream from frontends and because frontends retry on backend failure, there's the possibility for hidden 5xx responses that we never see, but which increase latency.

The whole mechanism should be rewritten and remade from scratch. We should have separate metrics under the graphite hierarchy, e.g. reqstats.eqiad.cp1062.backend.5xx and then show aggregated graphs in gdash using wildcards but which we can zoom in to, when there's a problem. The metrics can be collected either centrally, using a udp2log (or kafka) consumer, or they can be collected locally on the box, using a varnishncsa/VSL collectors. The former currently lacks backend logs, but maybe we should eventually start collecting these as well as they can be useful for finding hotspots.
Event Timeline

There are a very large number of changes, so older changes are hidden. Show Older Changes

Cc fgiunchedi added by fgiunchedi

faidon added a subscriber: Joe.

Some thoughts:

The desired metrics: 5xx's per frontend & backend, doesn't sound like it would fit well with the way the frontend webrequest varnishkafkas currently log. Filtering out only 5xxes from the existant webrequest kafka topics is possible, but would require consuming the full webrequest firehose, and then parsing out the hostnames and varnish instance names (frontend/backend) and sending something off to statsd.

We could set up new varnishkafka instances that logged only on 5xx status codes (I think we can do this, right?) to kafka, and then use kafkatee to consume and parse and send to statsd. I think that the volume of 5xx events should be low enough that this wouldn't affect Kafka much, and likely a single kafkatee instance could handle the data.

We could consider fancier things (realtime streaming frameworks :D :D) to do this, but I think for now, those are experimental for us, and we shouldn't go down that road. Maybe next year... :)

We've already got a growing number of varnishkafka instances on bits, but there's only one per frontend on other cache types. So far, adding more varnishkafka instances to cache servers haven't been a problem, but if anyone has any hesitation about this, we should talk about it.

Counting 5xxes locally via local varnishncsa (or varnishkafka even, it can do JSON to a local file!) on each cache server is not a bad idea either, but it would require running a log parser of some kinda on each cache server. Not sure which is better.

faidon changed the visibility from "WMF-NDA (Project)" to "Public (No Login Required)".
faidon changed the edit policy from "WMF-NDA (Project)" to "All Users".
faidon added a subscriber: BBlack.

FWIW I think we should log/collect metrics locally on the machines, reason being that we're fine with per-machine stats and then aggregate at the graphite layer, no external dependencies and easy to inspect by other means (e.g. write to local file and graphite) and to test locally.

I think a good set of metrics from individual requests to start with could be: (per layer)

  • TxStatus and RxStatus grouped by hundreds
  • RxRequest per-verb
  • ReqEnd timings

Nice to have:

  • per-RxHost success/failure
  • cluster (bits/upload/etc) though we can group it differently with graphite too

I'm not very fond of a pipeline of:
varnish -> varnishkafka -> kafka brokers -> kafkatee -> statsd -> carbon
to collect metrics. It sounds fragile and relying unnecessarily on multiple pieces of centralized infrastructure. Using Spark as I'm guessing you suggest sounds even worse than that as it adds another 2-3 components into the mix.

I was essentially about to say what Filippo said above… Moreover, logging to a file and log-parsing sounds unnecessary, too, though; this is all streaming data. We could easily create a pipeline of "varnishncsa | parse-and-send-stats" or even create a thin varnishstats daemon specially built for this.

Another alternative is logging to statsd directly from within Varnish/VCL — I think it'd be best to avoid running more code in the "hot" request/response path, however this may give us options for metrics that may be invisible from outside VCL (like specific VCL code paths).

@BBlack, what's your opinion?

varnish -> varnishkafka -> kafka brokers -> kafkatee -> statsd -> carbon

I think it's worse than that actually. Locally on the machine, there's also a chain of varnish -> varnishkafka -> /var/cache/varnishkafka/webrequest.stats.json -> logster cron job reads that once a minute to forward to local statsd port -> (was local statsd daemon, now statsite?)

I'm not fond of putting any of this in VCL at this time. If nothing else, we just don't need more complexity to manage there right now.

We could easily create a pipeline of "varnishncsa | parse-and-send-stats" or even create a thin varnishstats daemon specially built for this.

+1

Locally on the machine, there's also a chain of varnish -> varnishkafka -> /var/cache/varnishkafka/webrequest.stats.json -> logster cron job reads that once a minute to forward to local statsd port

Yes true, but that is specifically for metrics about varnishkafka, not for metrics about the http requests themselves.

We could easily create a pipeline of "varnishncsa | parse-and-send-stats" or even create a thin varnishstats daemon specially built for this.

+1

+1, also note there will be sampling involved, I don't think it'll work sending each request metric sample (over the network or locally) to statsd

Suggestion from IRC: it'd be good to have a log-scale composite graph of 5XXs and MediaWiki exceptions/fatals somewhere prominent, so that error spikes can be quickly isolated to a particular layer.

What if we just abstract out something like this:

varnishncsa -n frontend -m TxStatus:^4..   | pv --numeric -l --interval 60 > /dev/null

That right there is a count of 4xxes per minute. Gotta run soon, but there's got to be a fancy way to wrap that command in statsd format and | netcat -u stats.eqiad.wmnet 8125.

Then we can just make a puppet define systemd.service for this type of thing, and count whatever -m matches we want.

Thoughts? Would this cover all of the use cases? Is running multiple varnishncsas to read and count matches in shmlogs a good way to do this?

that'd work for counting things but what to do with timings?

also we'd calculate individually I guess, that'd one for each txstatus/rxstatus hundreds * frontend/backend, plus verbs (4?) * frontend/backend, so 5*2 + 5*2 + 4*2 = 28 services excluding timings

Do you need all timings, or do you want just want average time to first byte sent to client? I know that at least is available in varnishncsa, maybe the other ReqEnd timings are as well? In that case we could collect and average them somehow as a separate service too.

I'm not sure that 28+ services is the best way to do this, but it is pretty KISS. Less to affect if you want to add, change, or remove a metric.

the more timings we have the better, but we can add that later and get something in place now to replace reqstats

re: pipe let's see how it'd look like but yeah I see what you mean they'd be all independent

Change 208192 had a related patch set uploaded (by Ottomata):
[WIP] Proof of concept for reqstats overhaul using varnishncsa instances per metric

https://gerrit.wikimedia.org/r/208192

WIP proof of concept at: https://gerrit.wikimedia.org/r/#/c/208192/1

I haven't tested this puppetization at all, but I have limitedly tested the statsd_sender.sh script along with the shell command in the systemd service file.

All class naming and placement will likely move, but I wasn't sure exactly where to put it yet, so I put it in the manifests/misc/monitoring.pp :/ for the WIP.

for anything that's countable as lines that'll help getting us off udp2log so I think it'll work. For anything more complex than that (e.g. timings) I think we'll have to roll something up ourselves that reads varnishncsa/varnishlog

Ja, agreed. One nice thing about this approach, is the statsd_sender thing reads whatever from stdin, so as long as whatever we come up with can do the same pipe thing, e.g.

varnishncsa -n frontend | calc_timings.sh | send_statsd.sh -m varnish.time_firstbyte.whatever

and it should work.

oxygen has a stream of all 5xx responses (but I guess it also includes 404 from commons, counted as 503s, so beware) in a json format. Maybe we could use whatever produces that stream to also produce counters?

Totally could, but that would be the

varnish -> varnishkafka -> kafka brokers -> kafkatee -> statsd -> carbon

option that Faidon doesn't like so much.

doh, I completely forgot about the beta varnishtop collector! It'll need to be adjusted to e.g. consider different varnish instances and (later on) timings but otherwise fine

Change 212041 had a related patch set uploaded (by Ottomata):
Slight refactor for varnishstatus.py

https://gerrit.wikimedia.org/r/212041

Question:

How should invalid statuses or methods be counted? I have seen very rare bad data printed out by varnishncsa for %m and %s.

If any of %m or %s look bad, e.g. %m is not one of the predefined HTTP methods, or %s does not start with 1-5, should I count this line in the total requests? I think I should, as it is a real request, but it will look like the counts don't all add up. Say %m for a request is 'amobee-1:' (I have seen something like this[1]). Then, that request will not be counted towards any of the HTTP method counts, but it could still be counted towards the total # of requests seen. If we do that, then sum(get, post, delete, ...) != total. This seems ok to me, but might not be fully obvious.

I suppose we could not limit the keys that get reported in graphite, but then graphite will look ugly. It would then have 'amobee-1:' as in an http method metric name, like: servers.cp1052.eqiad.varnish.text.frontend.request.method.amobee-1:

Or, we could choose not to count invalid methods or statuses in anything at all. That is probably not the right thing to do, as it would be more dishonest.

Eh?

[1] cp1052.eqiad.wmnet 41175 2015-05-20T20:29:28 0.000056744 223.183.176.143 -/403 2465 amobee-1: http://-C217E9AF1FA10A71CC103BBE1601A6A3 - - - - -

Also, please opine as to your favorite metric name hierarchy now. As this is diamond, I think the default prefix will be servers.hostname, so:

servers.cp1052.eqiad.varnish.text.frontend.request.method.get
servers.cp1052.eqiad.varnish.text.frontend.request.status.5xx
...

Or, something else?

re: what do to with errors I think we should:

  • be strict about what keys get created in graphite, to avoid an explosion of metrics
  • not lose information

If any of %m or %s look bad, e.g. %m is not one of the predefined HTTP methods, or %s does not start with 1-5, should I count this line in the total requests? I think I should, as it is a real request, but it will look like the counts don't all add up. Say %m for a request is 'amobee-1:' (I have seen something like this[1]). Then, that request will not be counted towards any of the HTTP method counts, but it could still be counted towards the total # of requests seen. If we do that, then sum(get, post, delete, ...) != total. This seems ok to me, but might not be fully obvious.

if the input isn't what we are expecting or we don't know what to do with it for sure, then we should be incrementing sth like requests.invalid_input or similar to track this fact and not count it towards the total (though we can still sum them together)

I suppose we could not limit the keys that get reported in graphite, but then graphite will look ugly. It would then have 'amobee-1:' as in an http method metric name, like: servers.cp1052.eqiad.varnish.text.frontend.request.method.amobee-1:

I think we should limit it to a list of known methods, similarly status should be 100<=x<600, if validation doesn't pass that should be tracked like the above

Also, please opine as to your favorite metric name hierarchy now. As this is diamond, I think the default prefix will be servers.hostname, so:

servers.cp1052.eqiad.varnish.text.frontend.request.method.get
servers.cp1052.eqiad.varnish.text.frontend.request.status.5xx
...

looks ok to me but put varnish first like other collectors are doing:

servers.cp1052.varnish.eqiad.text.frontend.request.method.get
servers.cp1052.varnish.eqiad.text.frontend.request.status.5xx

some of these we might need to aggregate while receiving the metrics to avoid fetching all metrics every time (e.g. to get total 5xx)

some of these we might need to aggregate while receiving the metrics to avoid fetching all metrics every time (e.g. to get total 5xx)

Not sure what you mean by this, can you elaborate? Do you mean just in graphite UI?

we should be incrementing sth like requests.invalid_input or similar to track this fact and not count it towards the total

So, would that also mean that a request with an invalid method should not have its status counted? In the amobee request, the status is 403. Do both method and status have to be valid in order for either to be counted?

looks ok to me but put varnish first like other collectors are doing

K, will do.

some of these we might need to aggregate while receiving the metrics to avoid fetching all metrics every time (e.g. to get total 5xx)

Not sure what you mean by this, can you elaborate? Do you mean just in graphite UI?

I mean we might end up aggregating (e.g. sum) some of these metrics into new ones graphite-side when they are received as opposed to fetch and sum all of them every time, but anyways that's something we should evaluate later

we should be incrementing sth like requests.invalid_input or similar to track this fact and not count it towards the total

So, would that also mean that a request with an invalid method should not have its status counted? In the amobee request, the status is 403. Do both method and status have to be valid in order for either to be counted?

IMO it is more straightforward to count the whole line as invalid and skip it, on the basis that the number of invalid lines should be low

Comments addressed in latest patchset: https://gerrit.wikimedia.org/r/#/c/212041/

I added purge as a vaild method. Does varnish have any other special methods we should count? ban?

Ori has made a python module to interact with varnish shared logs via the C API:

https://gerrit.wikimedia.org/r/#/c/213293/

I should probably use this rather than varnishncsa. Thoughts?

I'd like that a lot, yes, as long as we can make it perform well enough. Ori's initial version was too time-consuming; he's reworked it since to perform better but the tradeoff was (AIUI) to filter quite a lot of the data and I'm not sure how many of those we'd want for reqstats. I don't think this is in Gerrit yet. @ori can provide more information about this.

Change 214053 had a related patch set uploaded (by Ottomata):
Add diamond collector_module class

https://gerrit.wikimedia.org/r/214053

Change 214053 merged by Ottomata:
Add diamond collector_module class

https://gerrit.wikimedia.org/r/214053

varnishlog python module here:

https://gerrit.wikimedia.org/r/#/c/214261/9

diamond collector refactored to work using this.

fgiunchedi added a subscriber: mark.

Oo, ok, another question.

Do we want client / backend metrics for a given varnish instance reported? Or just client? If I was doing just client, i would pass -c to varnishlog api and only count RxRequest and TxStatus. If both, then I would add client or backend to the key prefix sent off to statsd, e.g. servers.cp1052.varnish.eqiad.text.frontend.request.client.method.get and servers.cp1052.varnish.eqiad.text.frontend.request.backend.method.get

I patched to do both backend and client, waiting for review: https://gerrit.wikimedia.org/r/#/c/212041/

Change 212041 merged by Ottomata:
Add varnish request stats diamond collector

https://gerrit.wikimedia.org/r/212041

Change 217009 had a related patch set uploaded (by Ottomata):
Install varnish reqstats diamond collector on just cp1052 for testing

https://gerrit.wikimedia.org/r/217009

Change 217009 merged by Ottomata:
Install varnish reqstats diamond collector on just cp1052 for testing

https://gerrit.wikimedia.org/r/217009

Ok, finally, something is working!

http://grafana.wikimedia.org/#/dashboard/db/client-requests

This is only deployed on cp1052. If yall are cool with this, we can deploy to all caches.

Well, poop scoops:

Jun 16 20:59:28 cp1052 kernel: [2427515.881913] python[3301]: segfault at 7f2d0e5ed3b4 ip 00007f2d0fee672e sp 00007ffd84ea5418 error 4 in libc-2.19.so[7f2d0fe56000+19f000]

I was also able to run in python3 and use faulthandler to get this trace:

Fatal Python error: Segmentation fault

Current thread 0x00007f9856e4e700 (most recent call first):
  File "/usr/lib/python3.4/ctypes/__init__.py", line 495 in string_at
  File "/tmp/varnishlog.py", line 102 in _vsl_handler
  File "/tmp/varnishlog.py", line 117 in varnishlog
  File "shared_dict_print_in_both_test3.py", line 19 in increment_shared
  File "/usr/lib/python3.4/multiprocessing/process.py", line 93 in run
  File "/usr/lib/python3.4/multiprocessing/process.py", line 254 in _bootstrap
  File "/usr/lib/python3.4/multiprocessing/popen_fork.py", line 77 in _launch
  File "/usr/lib/python3.4/multiprocessing/popen_fork.py", line 21 in __init__
  File "/usr/lib/python3.4/multiprocessing/context.py", line 267 in _Popen
  File "/usr/lib/python3.4/multiprocessing/context.py", line 212 in _Popen
  File "/usr/lib/python3.4/multiprocessing/process.py", line 105 in start
  File "shared_dict_print_in_both_test3.py", line 25 in <module>

So far, I have only reproduced this when doing the magic combination of varnishlog + multiprocesssing.Process + multiprocessing.Manager.dict(). I haven't seen this happen when only using 1 or 2 of those features.

Hm.

mhh curious, perhaps it is enough to ask varnishlog in a thread and natively share the dict?

Natively share the dict? Hm. Just quickly tried this, and I get an immediate segfault:

Aug 25 16:32:25 cp1052 kernel: [8455259.595360] python[7589]: segfault at 24000d40 ip 00007f672a5af726 sp 00007f672a3370d0 error 4 in libvarnishapi.so.1.0.0[7f672a5a7000+12000]

I'm assuming libvarnishapi doesn't like Python threading. :/

Perhaps I should return to my original method of running varnishncsa in a subprocess?

Natively share the dict? Hm. Just quickly tried this, and I get an immediate segfault:

err, what I meant is to keep a dict in a single thread, from varnishlog threads push results into a queue and read the queue from the thread owning the dict, does that help?

When you say 'queue' and 'dict' do you mean the same thing? I had thought you were suggesting just using a regular old dict shared between the child (varnishlog) and parent threads. Do you mean to use a Queue object too?

@Ottomata let's sync up on this on hangout/irc and report conclusions here, seems like it'll speed things up!

Change 246215 had a related patch set uploaded (by Ottomata):
Turn on varnish reqstats diamond collector on eqiad mobile caches

https://gerrit.wikimedia.org/r/246215

Change 246215 merged by Ottomata:
Turn on varnish reqstats diamond collector on eqiad mobile caches

https://gerrit.wikimedia.org/r/246215

Change 246229 had a related patch set uploaded (by Ottomata):
Enable diamond reqstats collector for all mobile varnishes

https://gerrit.wikimedia.org/r/246229

Change 246229 merged by Ottomata:
Enable diamond reqstats collector for all mobile varnishes

https://gerrit.wikimedia.org/r/246229

Change 247282 had a related patch set uploaded (by Ottomata):
Add Varnish reqstats diamond collector for upload caches

https://gerrit.wikimedia.org/r/247282

Change 247282 merged by Ottomata:
Add Varnish reqstats diamond collector for upload caches

https://gerrit.wikimedia.org/r/247282

Change 247564 had a related patch set uploaded (by Ottomata):
Deploy VarnishReqstats diamond collector on remaining cache hosts

https://gerrit.wikimedia.org/r/247564

Change 247564 merged by Ottomata:
Deploy VarnishReqstats diamond collector on remaining cache hosts

https://gerrit.wikimedia.org/r/247564

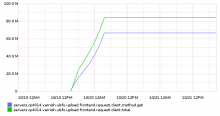
Rats, I see some segfaults:

Oct 20 03:40:14 cp4014 kernel: [13259932.218753] diamond[10119]: segfault at 7fc4953d4620 ip 00007fc4955de52d sp 00007fffc99561d0 error 4 in libvarnishapi.so.1.0.0[7fc4955d5000+12000]

graphite.wikimedia.png (311×588 px, 15 KB)

I'm considering going down the route Ori has for some python varnishlog things. I'd run this process as its own daemon and send stats directly to statsd, rather than relying on diamond. Thoughts? @fgiunchedi?

@Ottomata ping me tomorrow if you can, I'd like to give helping a whirl

Change 248067 had a related patch set uploaded (by Ottomata):
The varnish reqstats diamond collector does not work, emit to statsd directly instead

https://gerrit.wikimedia.org/r/248067

Change 248067 merged by Ottomata:
The varnish reqstats diamond collector does not work, emit to statsd directly instead

https://gerrit.wikimedia.org/r/248067

Change 249479 had a related patch set uploaded (by Ottomata):
Enable varnishreqstats on all misc and mobile hosts

https://gerrit.wikimedia.org/r/249479

Change 249479 merged by Ottomata:
Enable varnishreqstats on all misc and mobile hosts

https://gerrit.wikimedia.org/r/249479

Change 249746 had a related patch set uploaded (by Ottomata):
Deploy varnishreqstats on all text caches

https://gerrit.wikimedia.org/r/249746

Change 249746 merged by Ottomata:
Deploy varnishreqstats on all text caches

https://gerrit.wikimedia.org/r/249746

Change 208192 abandoned by Ottomata:
[WIP] Proof of concept for reqstats overhaul using varnishncsa instances per metric

Reason:
Not using

https://gerrit.wikimedia.org/r/208192