Page MenuHomePhabricator

Diamond collected metrics about memory usage inaccurate until third reboot
Closed, ResolvedPublic

Description

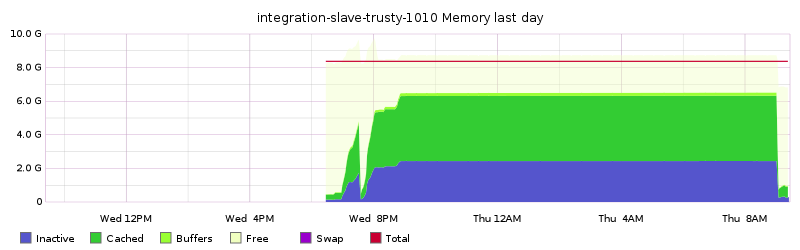
I thought the new instances were going crazy, but I couldn't find any process using a lot of memory.

Turns out it takes a couple reboots before the matrics are reliable.

For comparison:

integration-slave1401, 1402, and 1404 were rebooted once last week (for unrelated reasons):

screen.png (994×1 px, 300 KB)

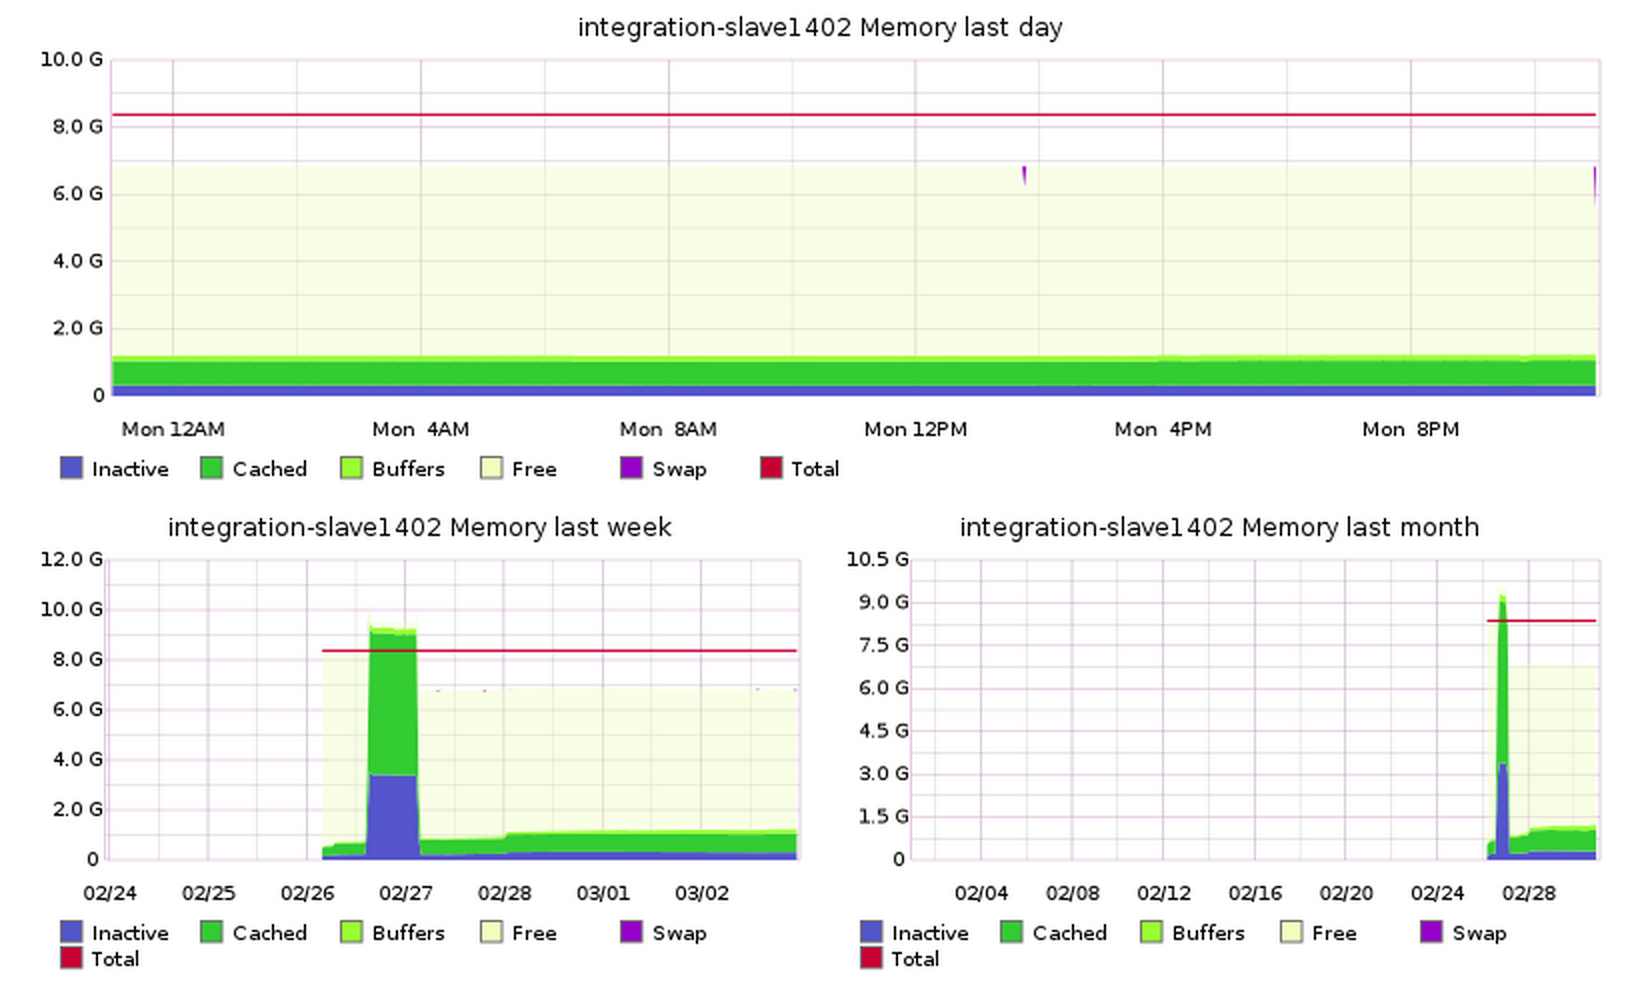
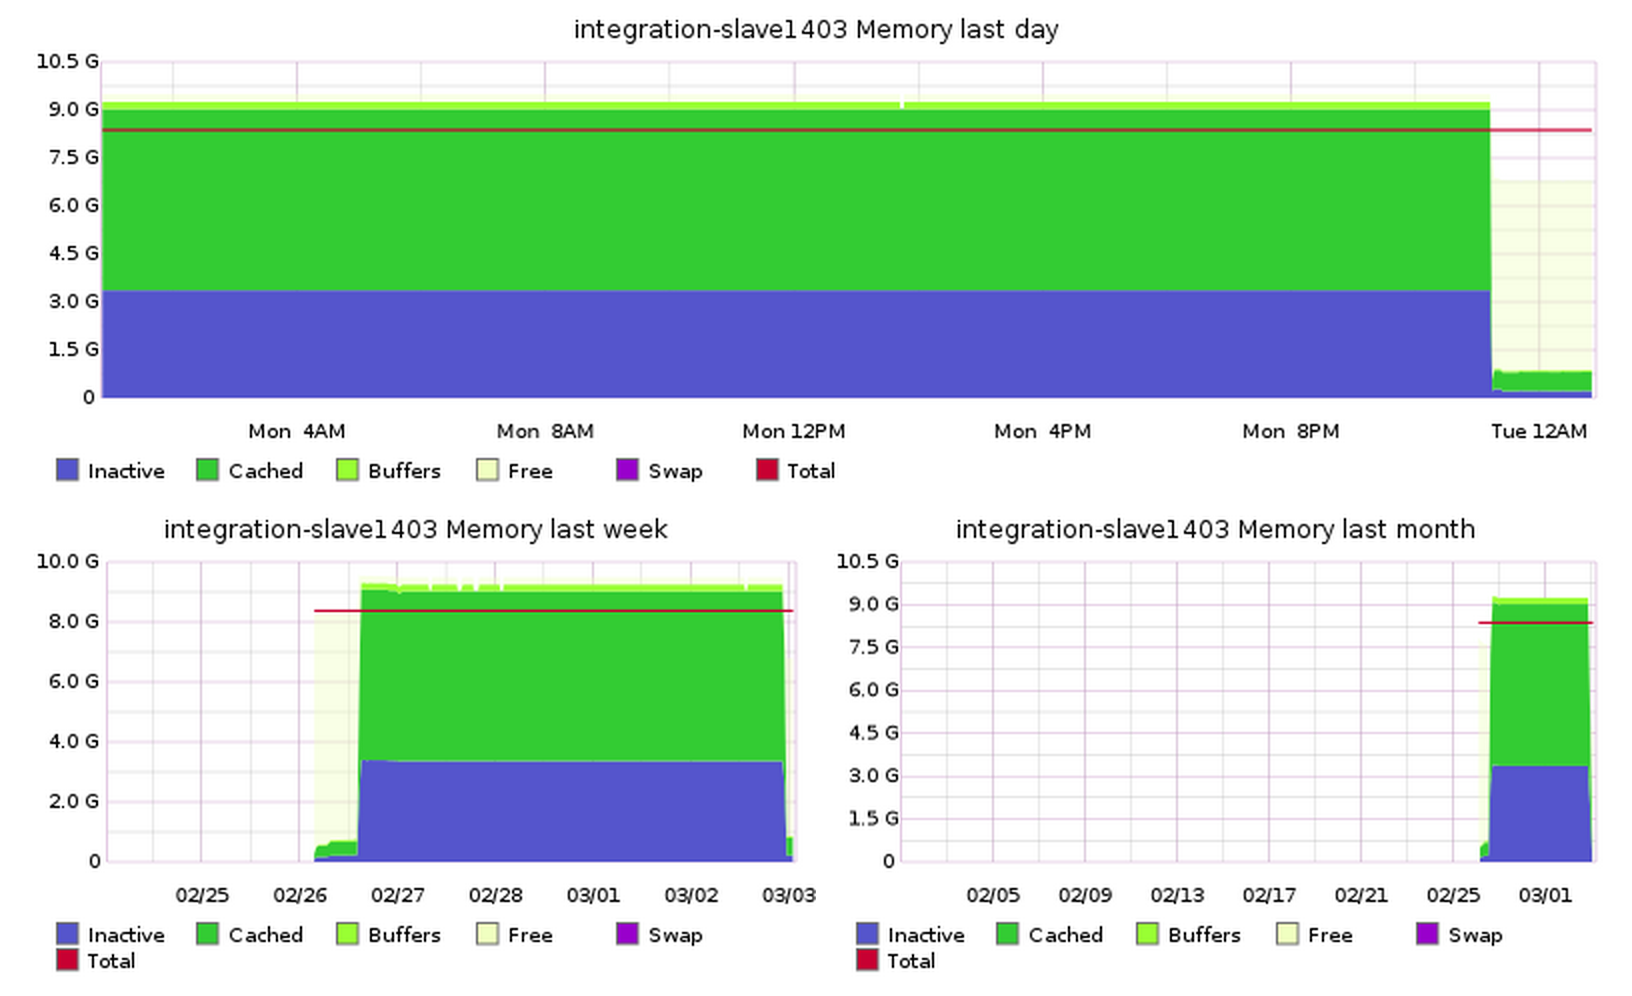
integration-slave1403 and slave1405, however, were already working fine and their free and top output are nearly identical to that of slave1402. Yet, their alleged memory usage was huge in graphite. I checked that the graph wasn't stuck or flat, it was still reacting lively to processes. It's reporting is just off by 8.5GB.

The total didn't even add up. It was reporting 9.5GB memory usage on an instance with only 8GB of total memory.

Screen_Shot_2015-03-03_at_01.50.48.png (996×1 px, 249 KB)

Event Timeline

Krinkle raised the priority of this task from to Needs Triage.
Krinkle updated the task description. (Show Details)
Krinkle added projects: Cloud-Services, Cloud-VPS.
Krinkle subscribed.
Krinkle renamed this task from Diamond collected metrics about memory inaccurate until second reboot to Diamond collected metrics about memory usage inaccurate until third reboot.Mar 3 2015, 12:52 AM
Krinkle set Security to None.
Krinkle updated the task description. (Show Details)

A better example from the new integration-slave-trusty-1010:

graphite.wmflabs.png (250×800 px, 18 KB)

The first boot is fine. Then after a necessary reboot, the usage goes up until it hits a flat high line (presumably it stops reporting and graphite/diamond just echoes the last known point). Then after the third reboot it goes to normal fluctuating levels.

Looking at atop history, there is nothing suspicious. I guess that is an oddity from diamond / graphite. I suspect that diamond has not been collecting / reporting metric for a while, then graphite would reuse the last known value instead of marking it NULL.

Looking at the raw metric by passing &format=json shows that the metric values are changing. Maybe it is statsd replaying the same data over and over.

I rebooted the slaves and all metrics look fine.

hashar claimed this task.