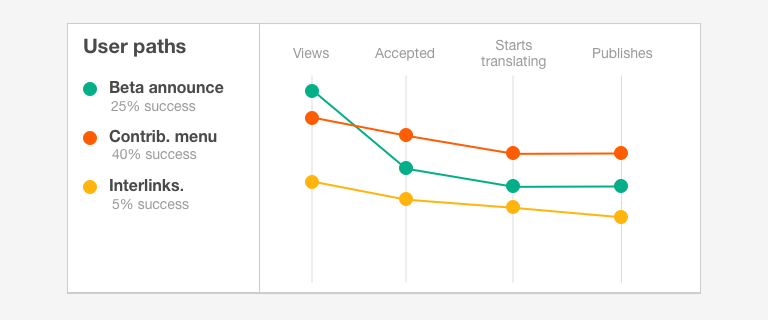
T90529 started measuring the usage of entry points to CX with the help of event logging. But to retrieve and analyse this data, we need some automated visualization, probably with the help of limn
| • santhosh | |
| Mar 24 2015, 6:02 AM |
| F167896: cx-stats 4.png | |
| May 22 2015, 5:38 PM |
T90529 started measuring the usage of entry points to CX with the help of event logging. But to retrieve and analyse this data, we need some automated visualization, probably with the help of limn
| Status | Subtype | Assigned | Task | ||
|---|---|---|---|---|---|
| Open | None | T76456 Language Engineering tracker of trackers (tracking) | |||
| Open | None | T76448 [Epic] ContentTranslation - Entry Points | |||
| Open | None | T87867 Experiment ways to get more users to translate articles (tracking) | |||
| Open | None | T96134 Entry Point: Show an entry point to ContentTranslation at an empty page in action=view | |||
| Duplicate | None | T90224 Allow anonymous users to translate | |||
| Duplicate | None | T90186 Entry point: change target language from gray links panel | |||
| Open | None | T90185 Entry point: Change source language from gray link panel | |||
| Resolved | Amire80 | T90172 Suggest interlanguage translation opportunity based on browser Accept-Language | |||
| Open | None | T90162 Entry point: New translation from Wikidata | |||
| Open | None | T76457 [Epic] ContentTranslation - Translation Dashboard | |||
| Open | None | T87439 [Tracking] Suggest articles to translate from the dashboard | |||
| Open | None | T99230 [Master] Improved analytics page for CX | |||
| Open | None | T93717 Analyse and visualize the entry point effectiveness data collected using eventlogging |