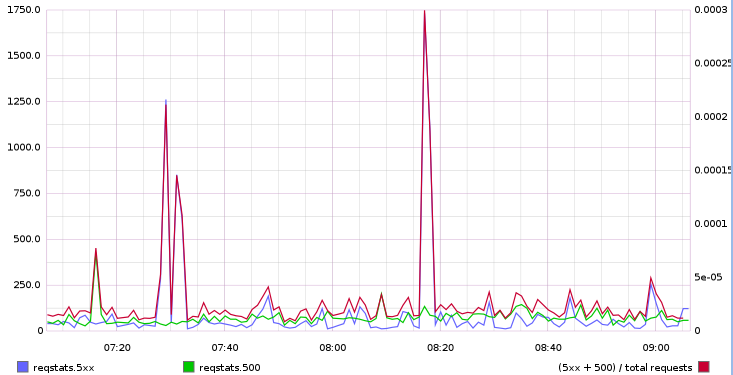
once reqstats is in a better/more reliable state than sqstats.pl (i.e. T83580) we should get more signal out of reqstats metrics by e.g. look at ratio between errors and requests and thus have a percentage to alarm on, e.g.
| fgiunchedi | |
| May 7 2015, 9:08 AM |
| F161467: Screen Shot 2015-05-07 at 11.07.07.png | |
| May 7 2015, 9:08 AM |
once reqstats is in a better/more reliable state than sqstats.pl (i.e. T83580) we should get more signal out of reqstats metrics by e.g. look at ratio between errors and requests and thus have a percentage to alarm on, e.g.
| Status | Subtype | Assigned | Task | ||
|---|---|---|---|---|---|
| Invalid | fgiunchedi | T98450 improve reqstats error alerts | |||
| Resolved | Ottomata | T83580 Overhaul reqstats |
No longer valid, nowadays we monitor nginx/varnish availability through Prometheus, have setup alerts on low availability and have dashboards such as https://grafana.wikimedia.org/dashboard/db/frontend-traffic