WikimediaDebug is a set of tools for debugging and profiling MediaWiki web requests in a production environment. WikimediaDebug can be used through the accompanying browser extension, or from the command-line.
This post highlights changes we made to WikimediaDebug over the past year, and explains more generally how its capabilities work.
- What's new?
- Features overview: Staging changes, Debug logging, and Performance profiling.
- How does it all work?
§ 1. What's new?
Redesigned
I've redesigned the popup using the style and components of the Wikimedia Design Style Guide.
| New design | Previous design |
|---|---|
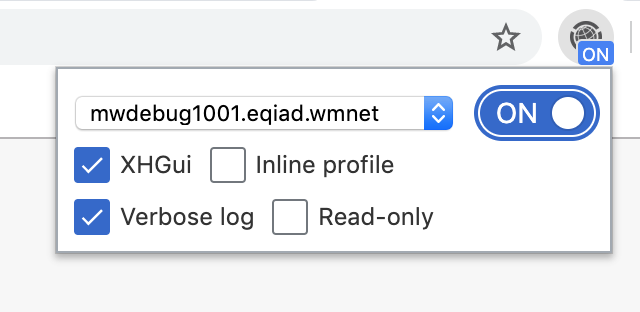 | 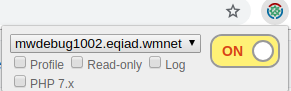 |
The images above also show improved labels for the various options. For example, "Log" is now known as "Verbose log". The footer links also have clearer labels now, and visually stand out more.
| New footer | Previous footer |
|---|---|
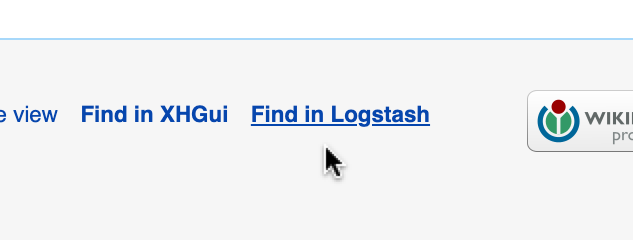 | 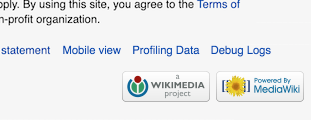 |
This release also brings dark mode support! (brighter icon, slightly muted color palette, and darker tones overall). The color scheme is automatically switched based on device settings.
| Dark mode |
|---|
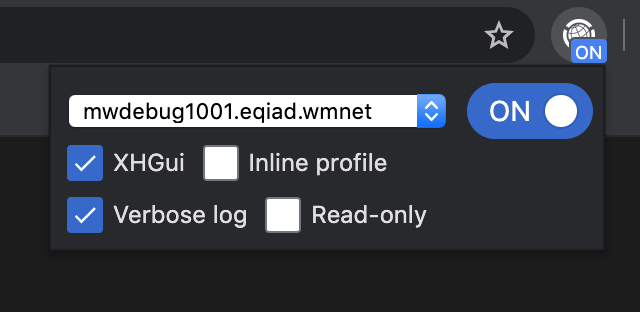 |
Inline profile
I've added a new "Inline profile" option. This is a quicker and more light-weight alternative to the "XHGui" profile option. It outputs the captured performance profile directly to your browser (as hidden comment at the end of the HTML or CSS/JS response).
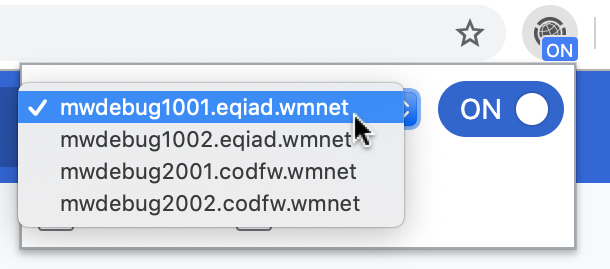
Beta Cluster support
This week, I've set up an XHGui server in the Beta Cluster. With this release, WikimediaDebug has reached feature parity between Beta Cluster and production.
It recognises whether the current tab is for the Beta Cluster or production, and adapts accordingly.
- The list of hostnames is omitted to avoid confusion (as there is no debug proxy in Beta).
- The "Find in Logstash" link points to logstash-beta.wmflabs.org.
- The "Find in XHGui" link points to performance-beta.wmflabs.org/xhgui/.
§ 2. Features overview
Staging changes
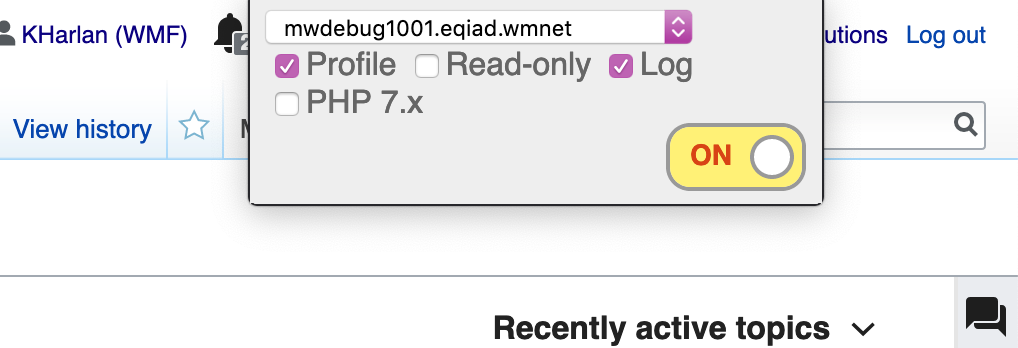
The most common use of WikimediaDebug is to verify software changes during deployments (e.g. SWAT). When deploying changes, the Scap deployment tool first syncs to an mw-debug host. The user then toggles on WikimediaDebug and selects the staging host.
WikimediaDebug is now active and routes browser activity for WMF wikis to the staging host. This bypasses the CDN caching layers and load balancers normally involved with such requests.
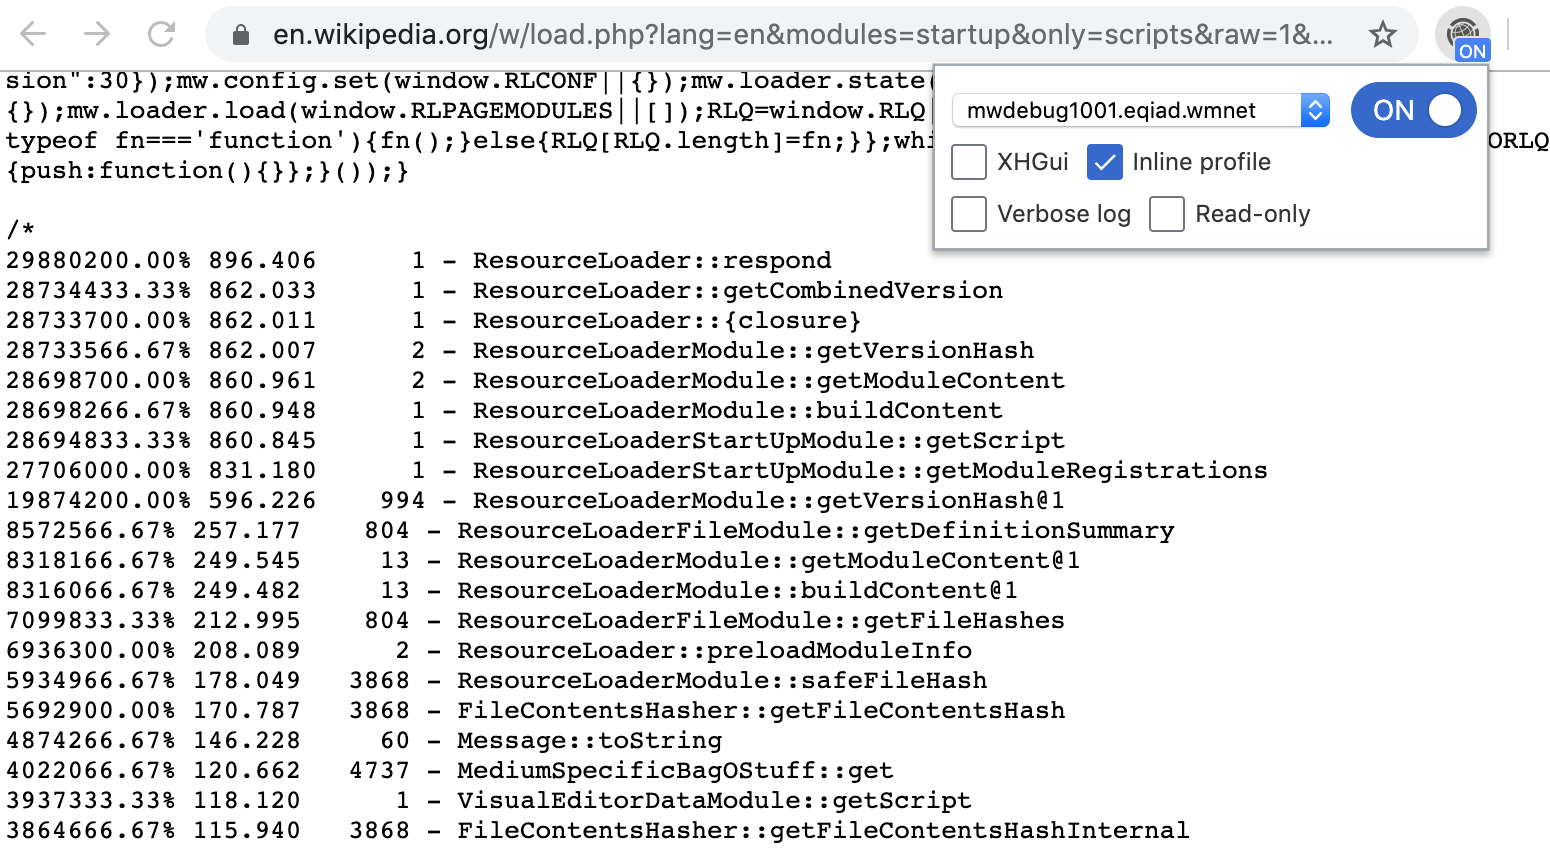
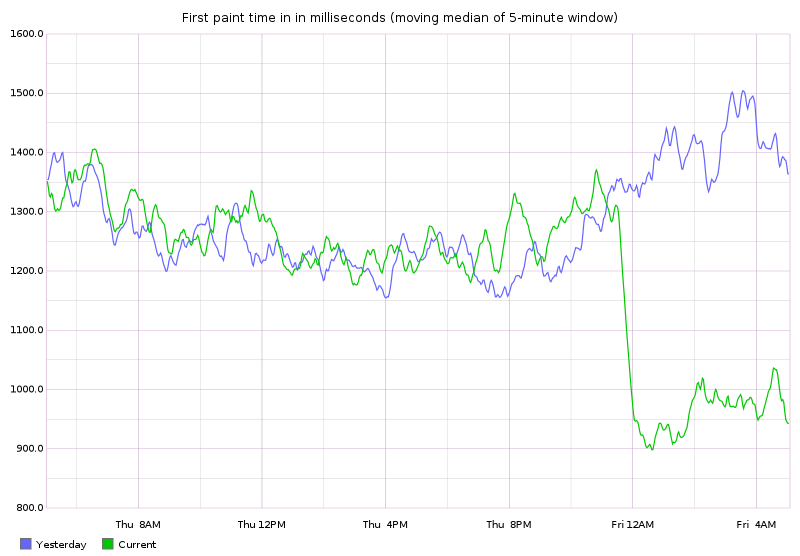
Debug logging
The MediaWiki software is instrumented with log messages throughout its source code. These indicate how the software behaves, which internal values it observes, and the decisions it makes along the way. In production we dispatch messages that carry the "error" severity to a central store for monitoring purposes.
When investigating a bug report, developers may try to reproduce the bug in their local environment with a verbose log. With WikimediaDebug, this can be done straight in production.
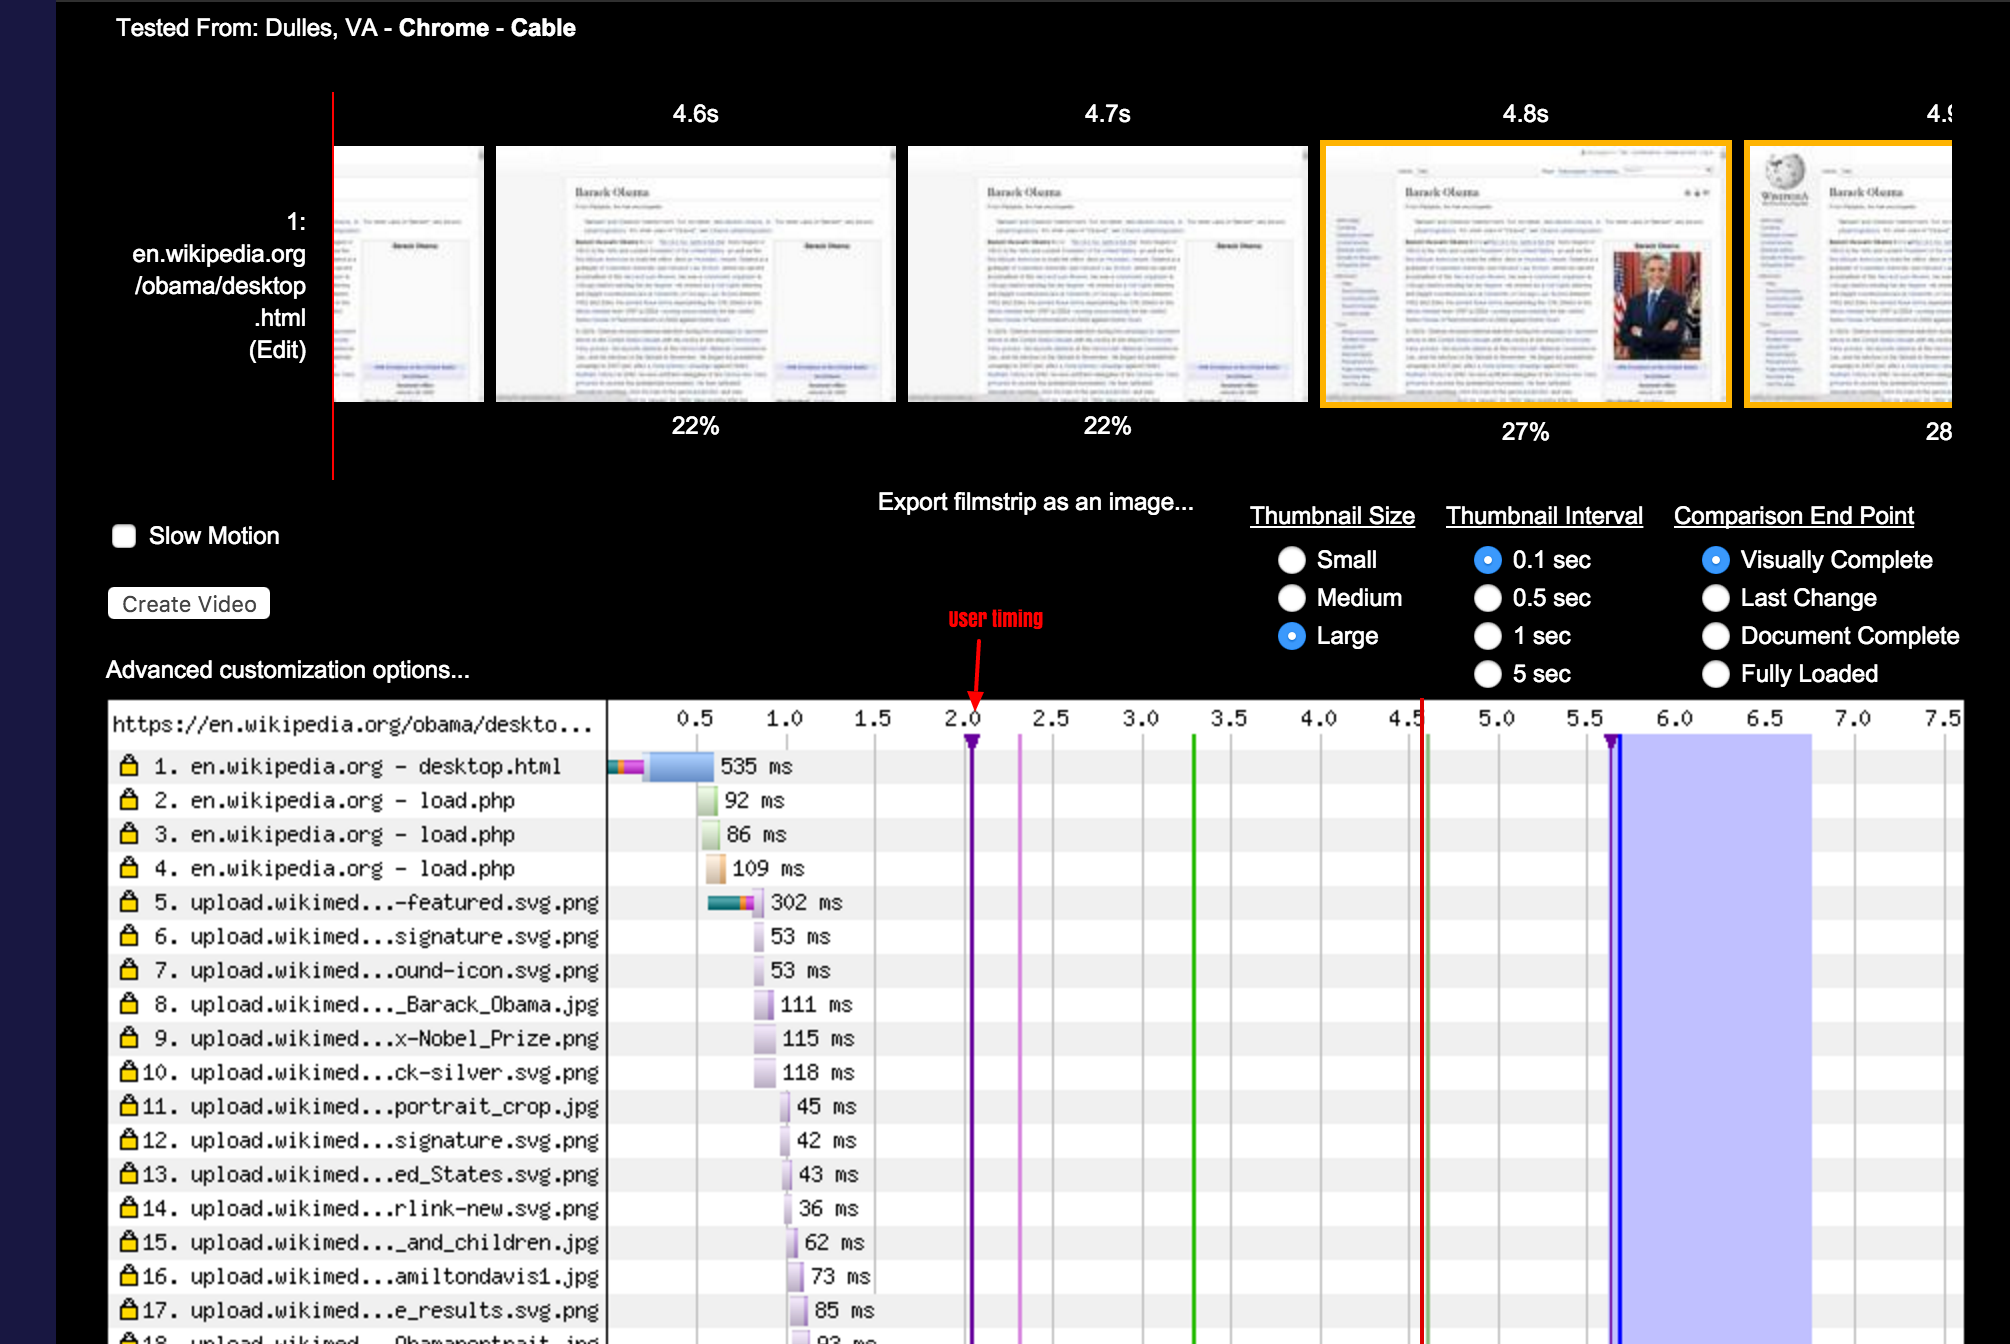
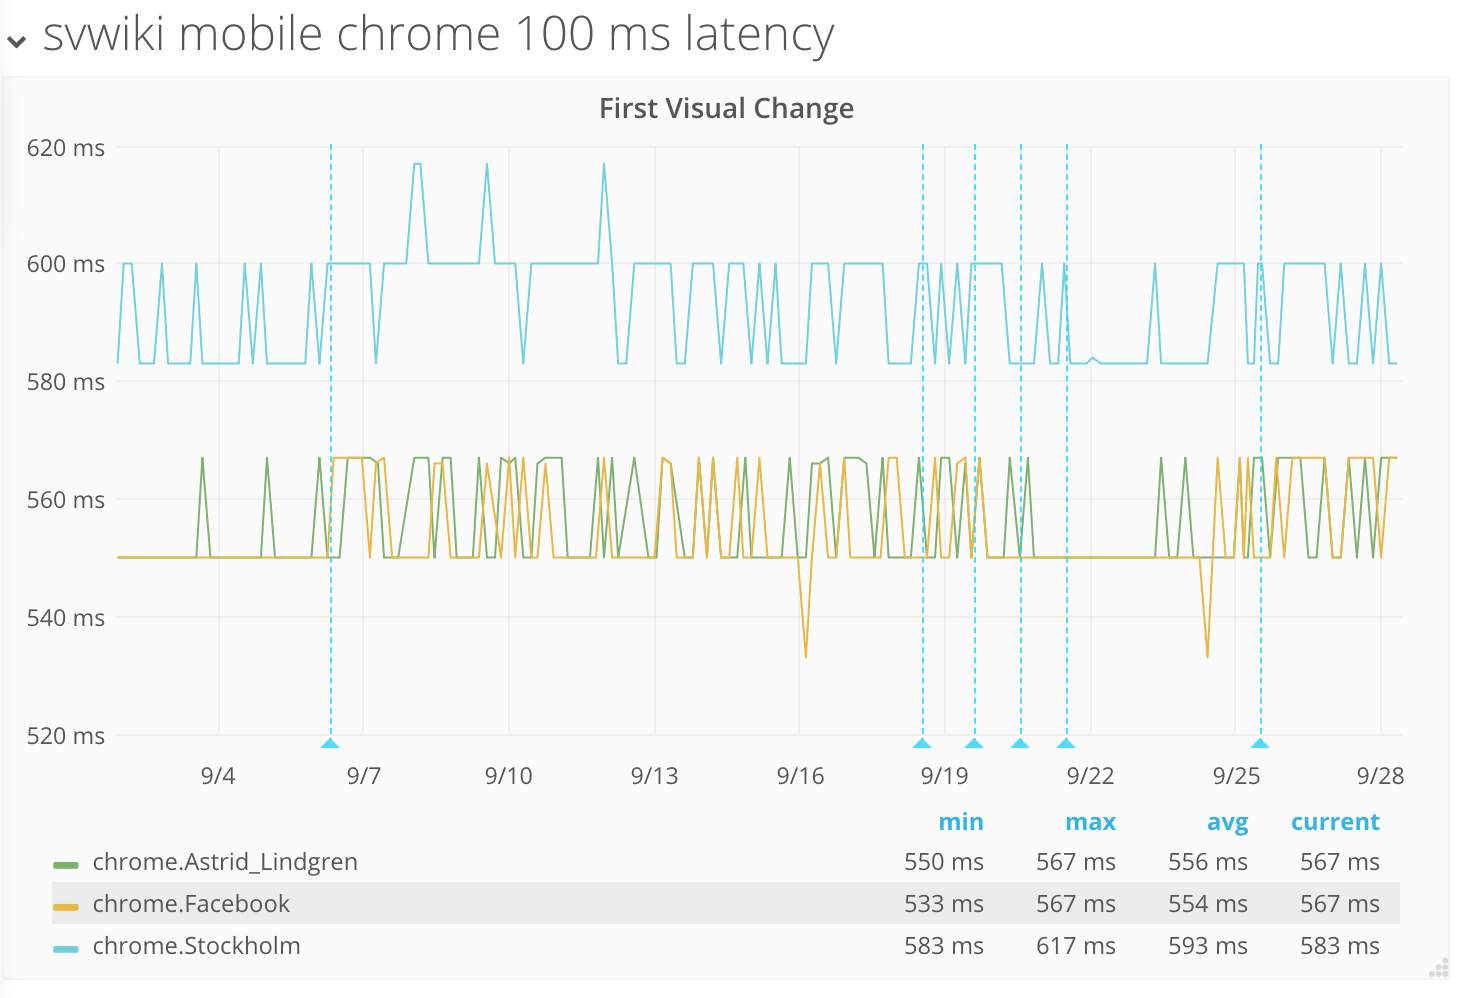
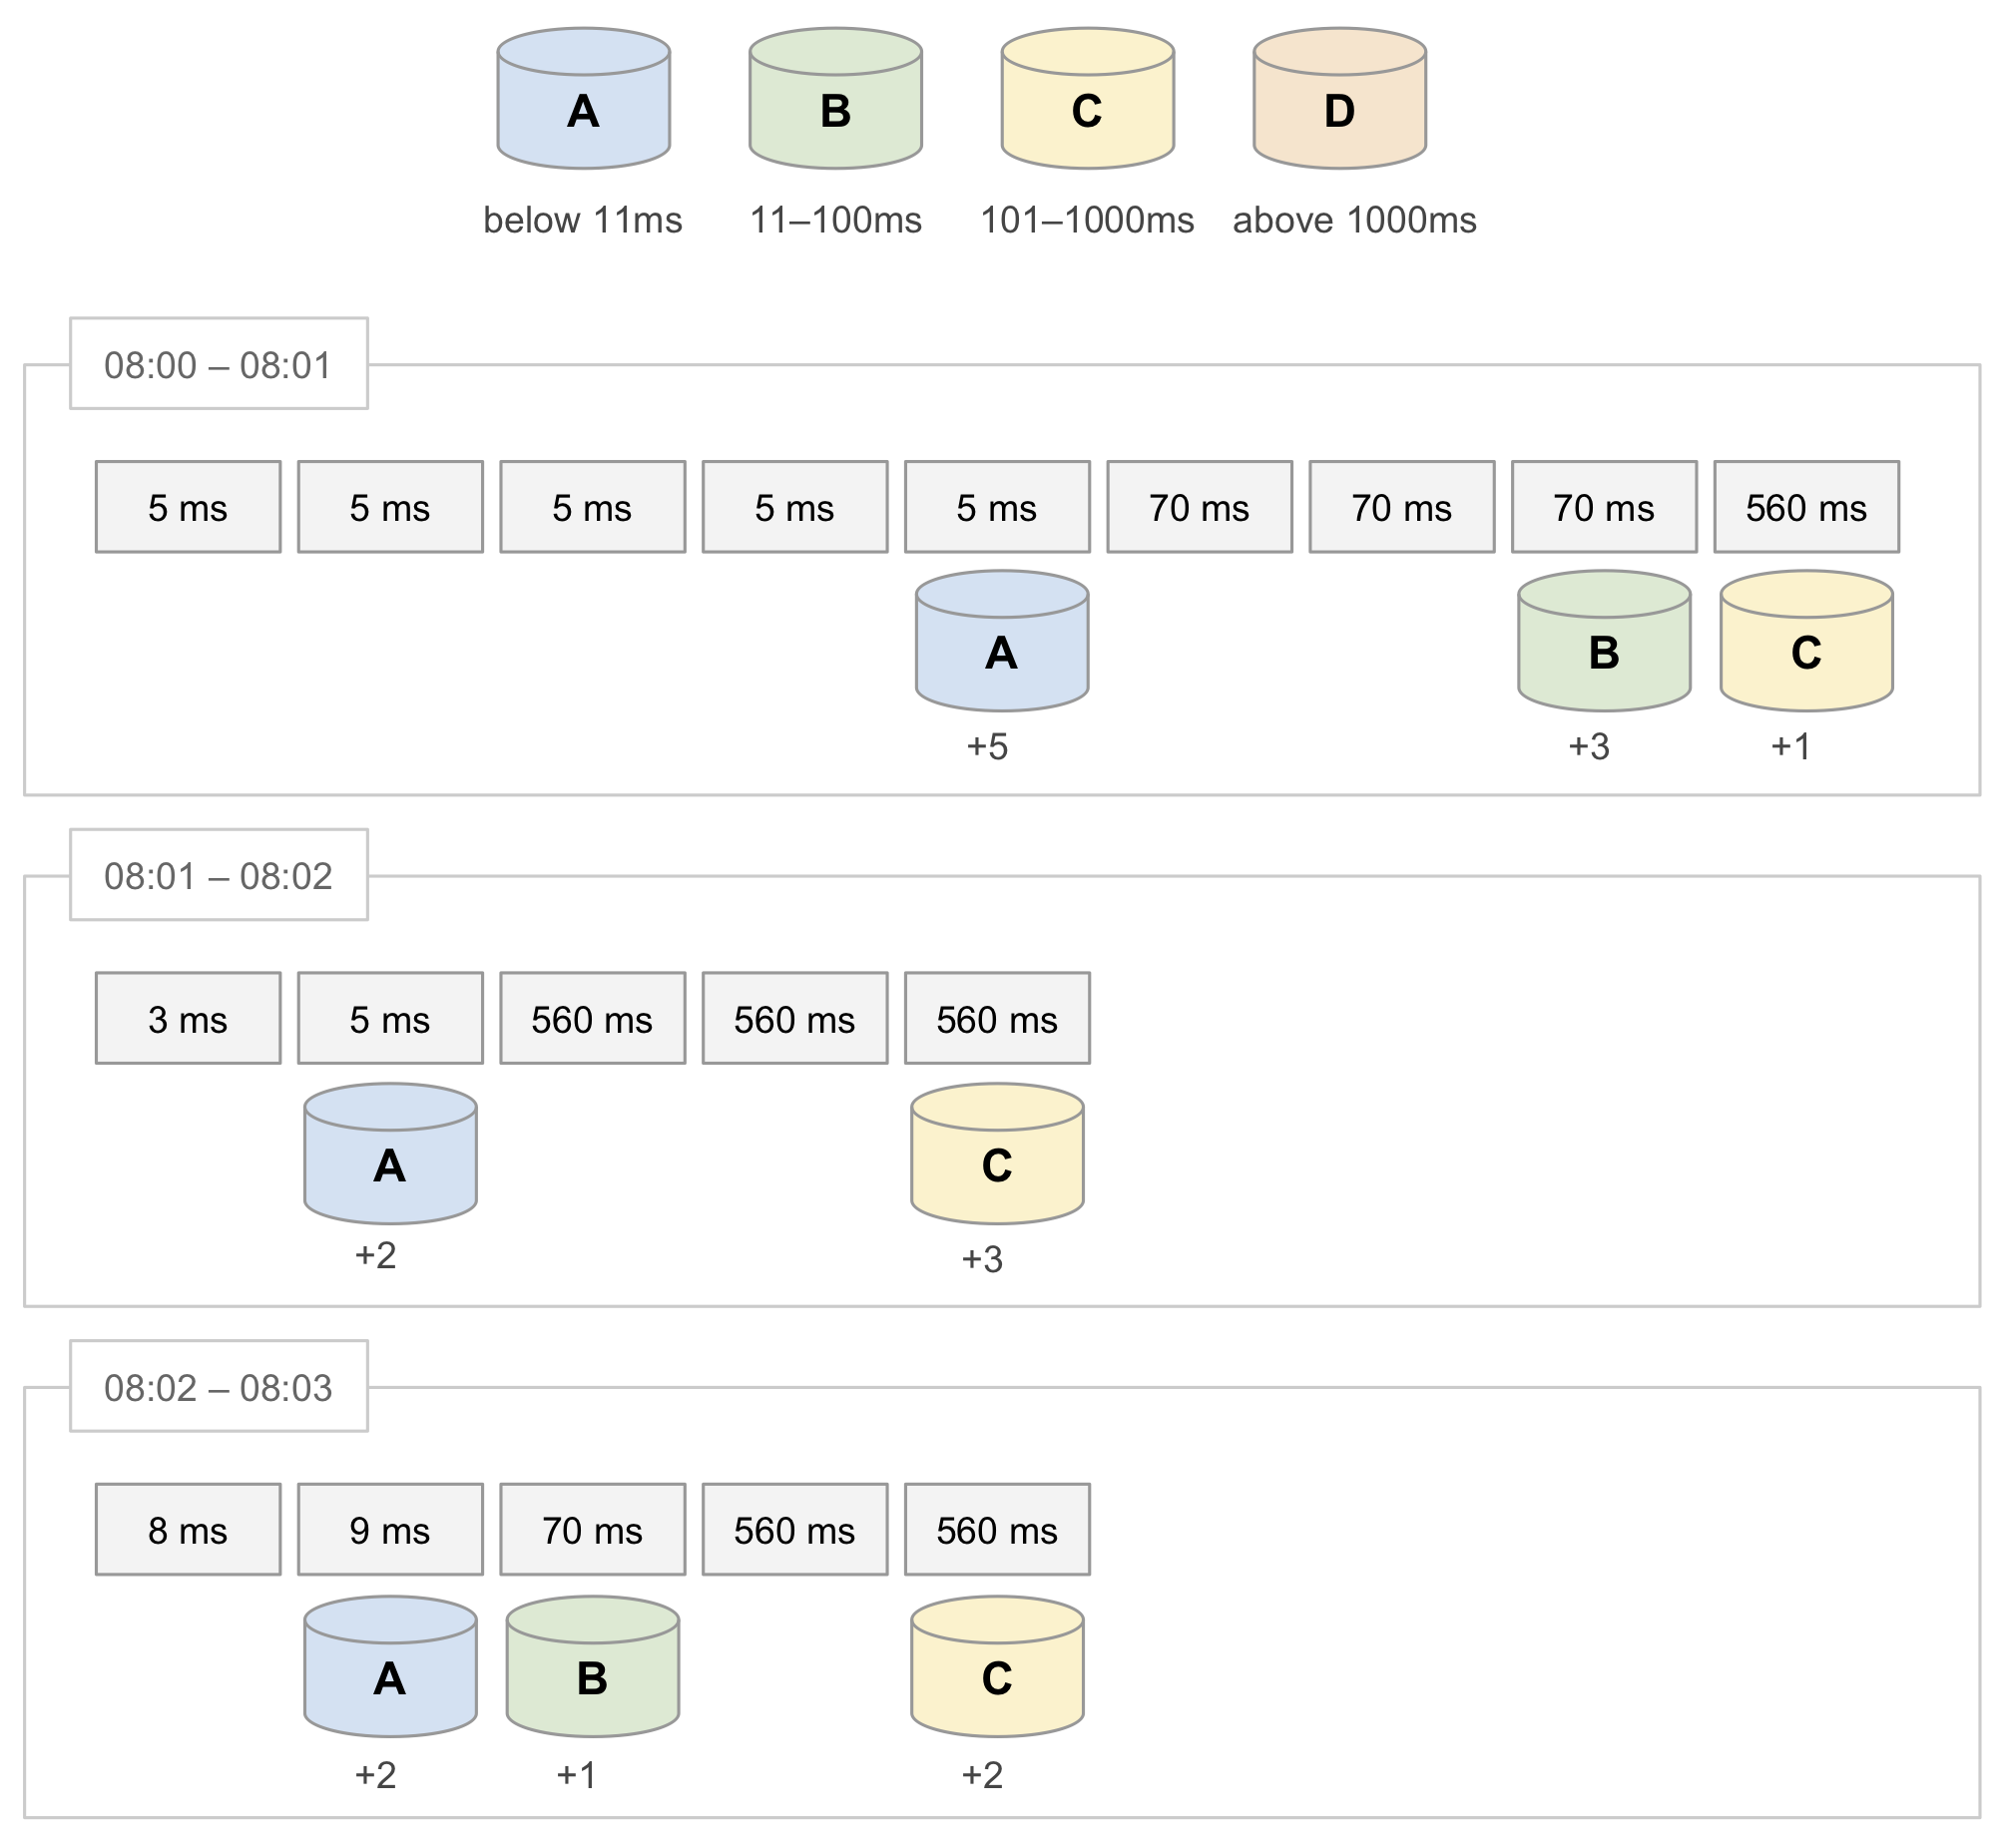
The "Verbose log" option configures MediaWiki to dispatch all its log messages, from any channel or severity level. Below is an example where the Watchlist component is used with the verbose log enabled.
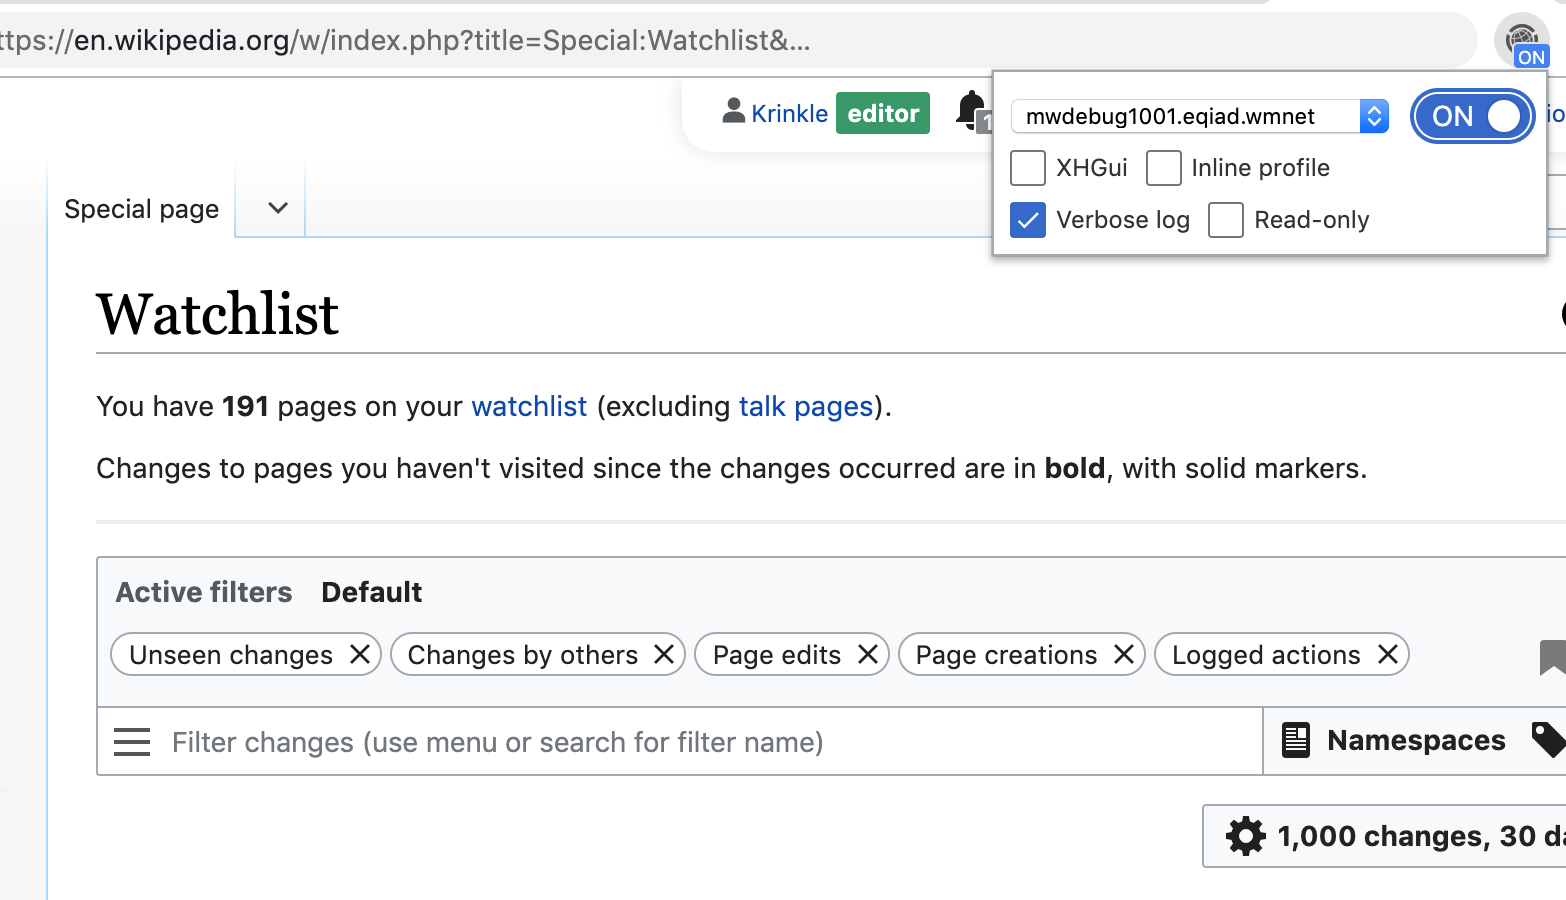
One can then reproduce the bug (on the live site). The verbose log is automatically sent to Logstash, for access via the Kibana viewer at logstash.wikimedia.org (restricted link).
| Aggregate graphs (Kibana) | Verbose log (Kibana) |
|---|---|
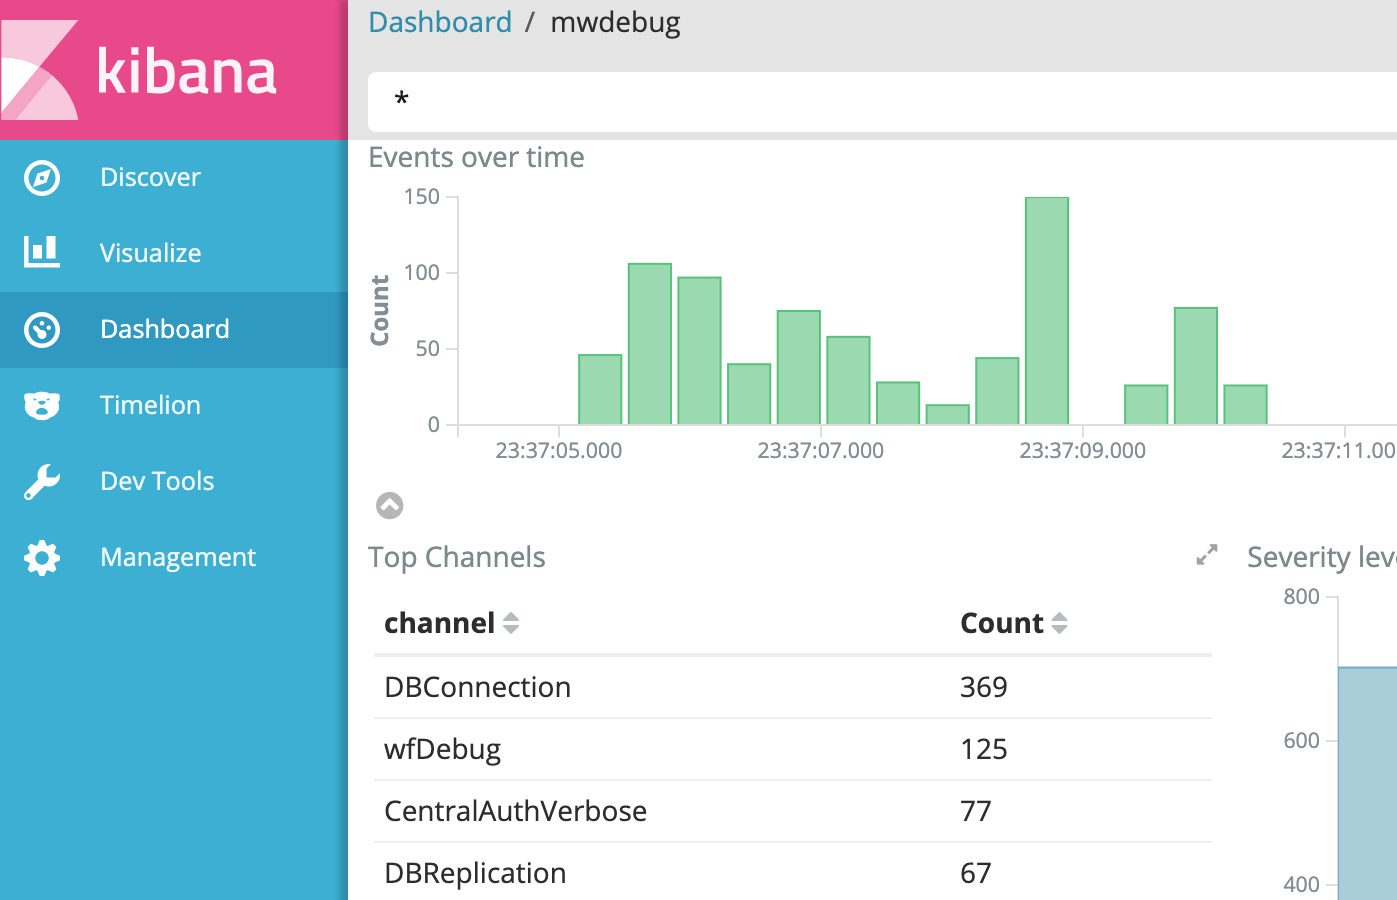 | 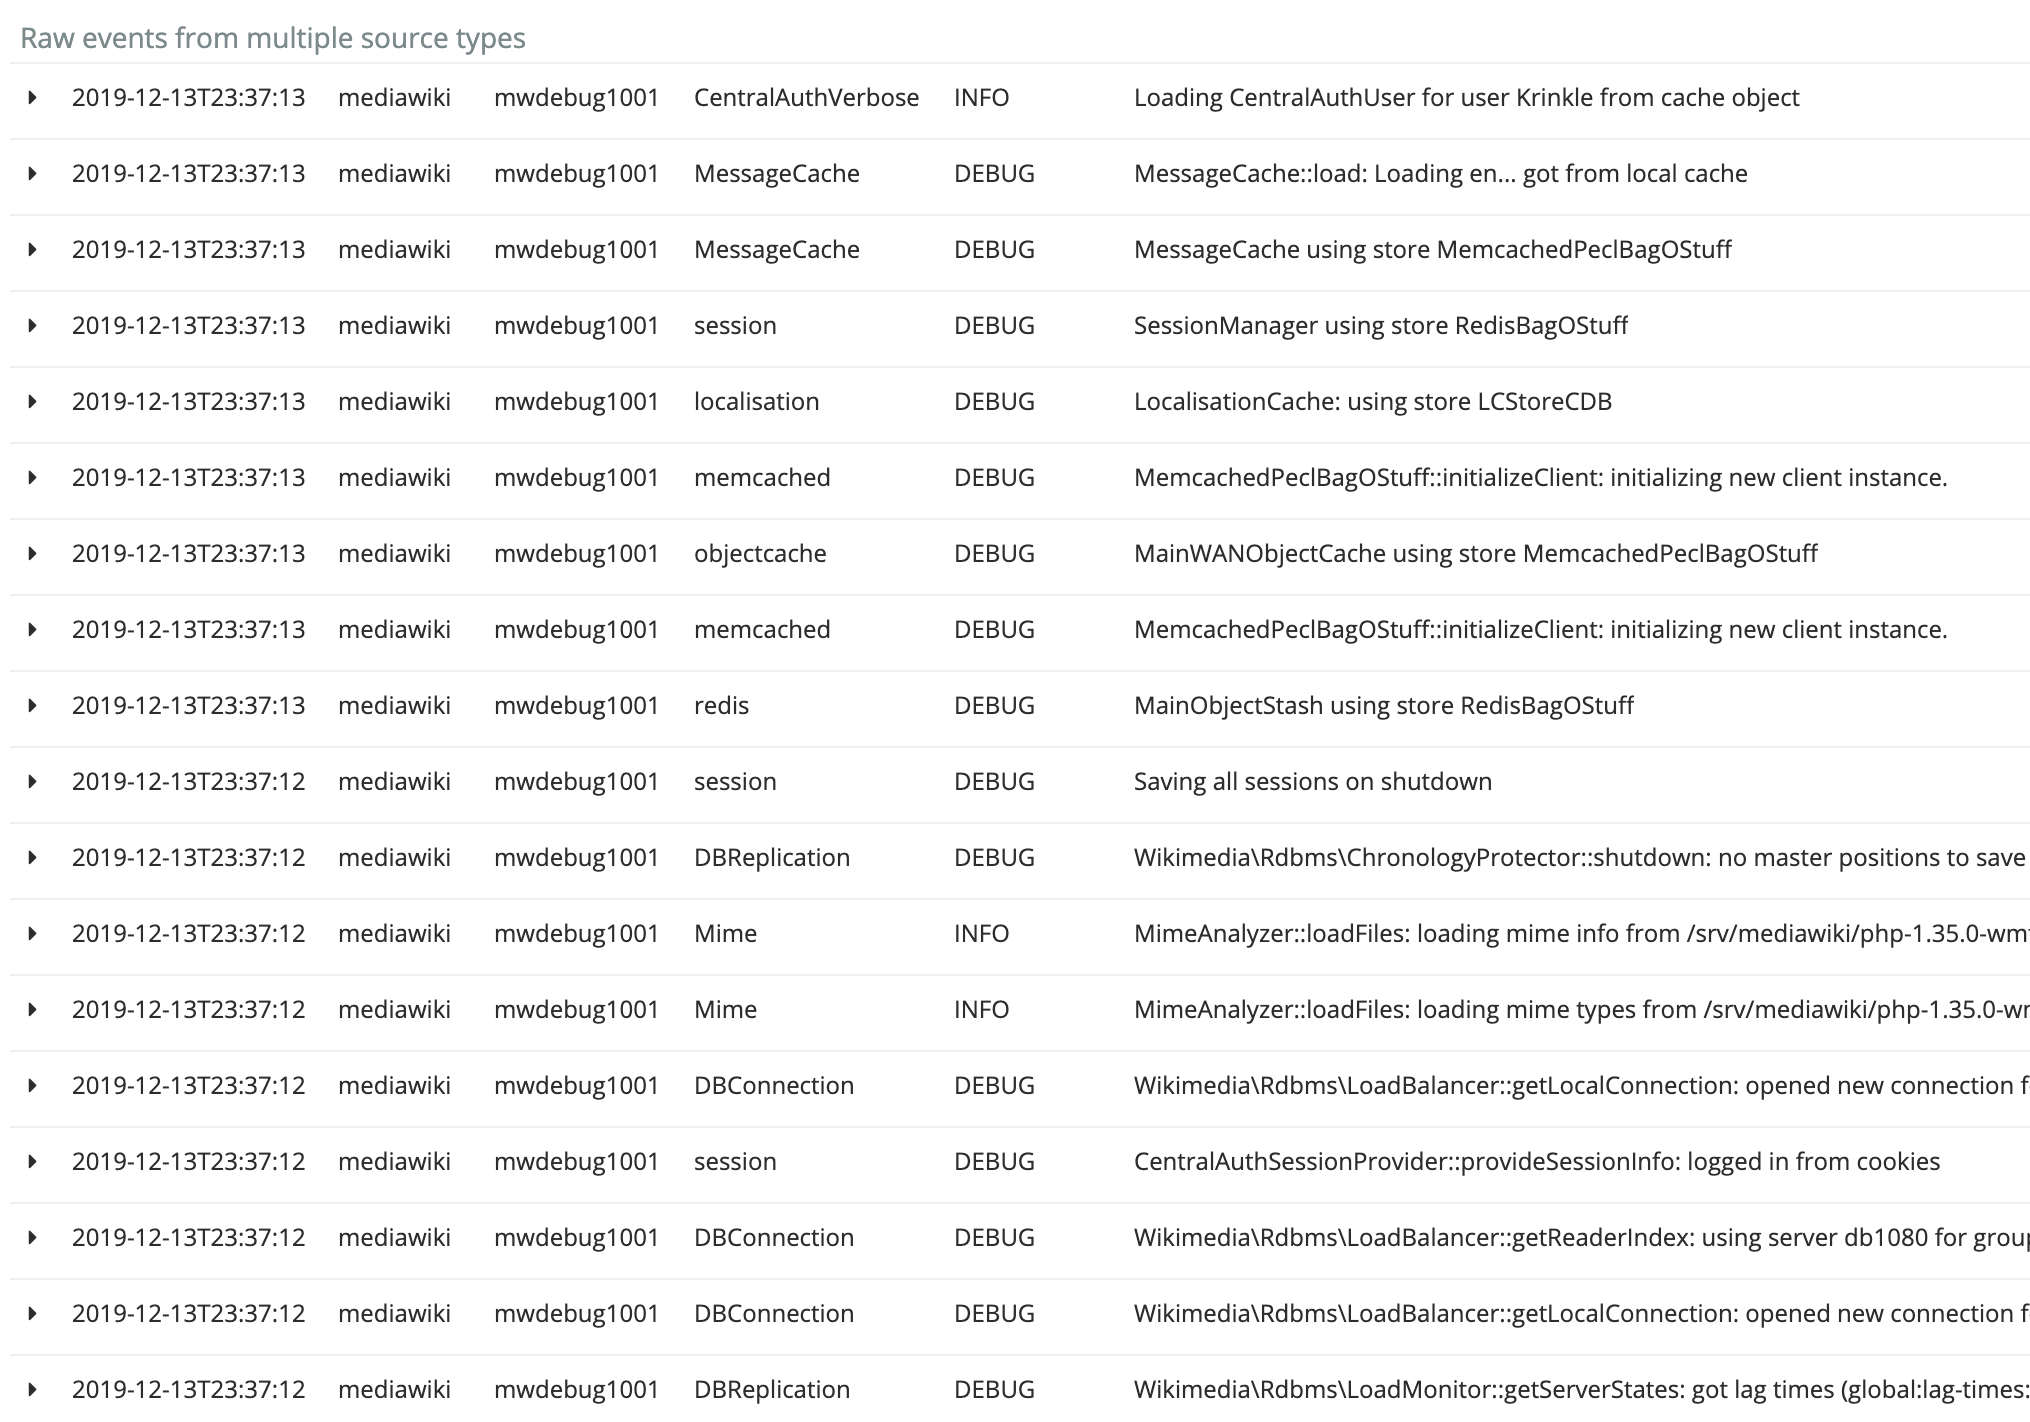 |
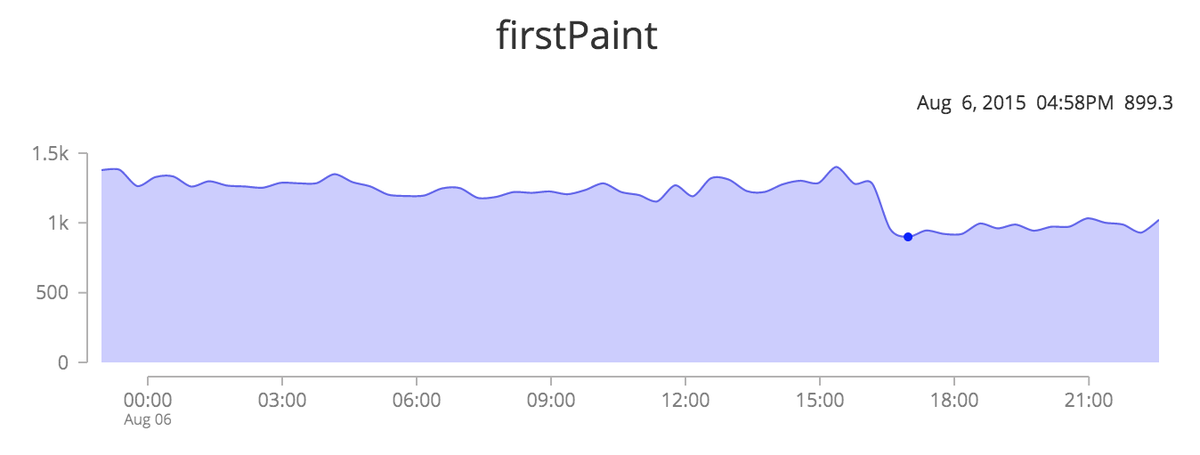
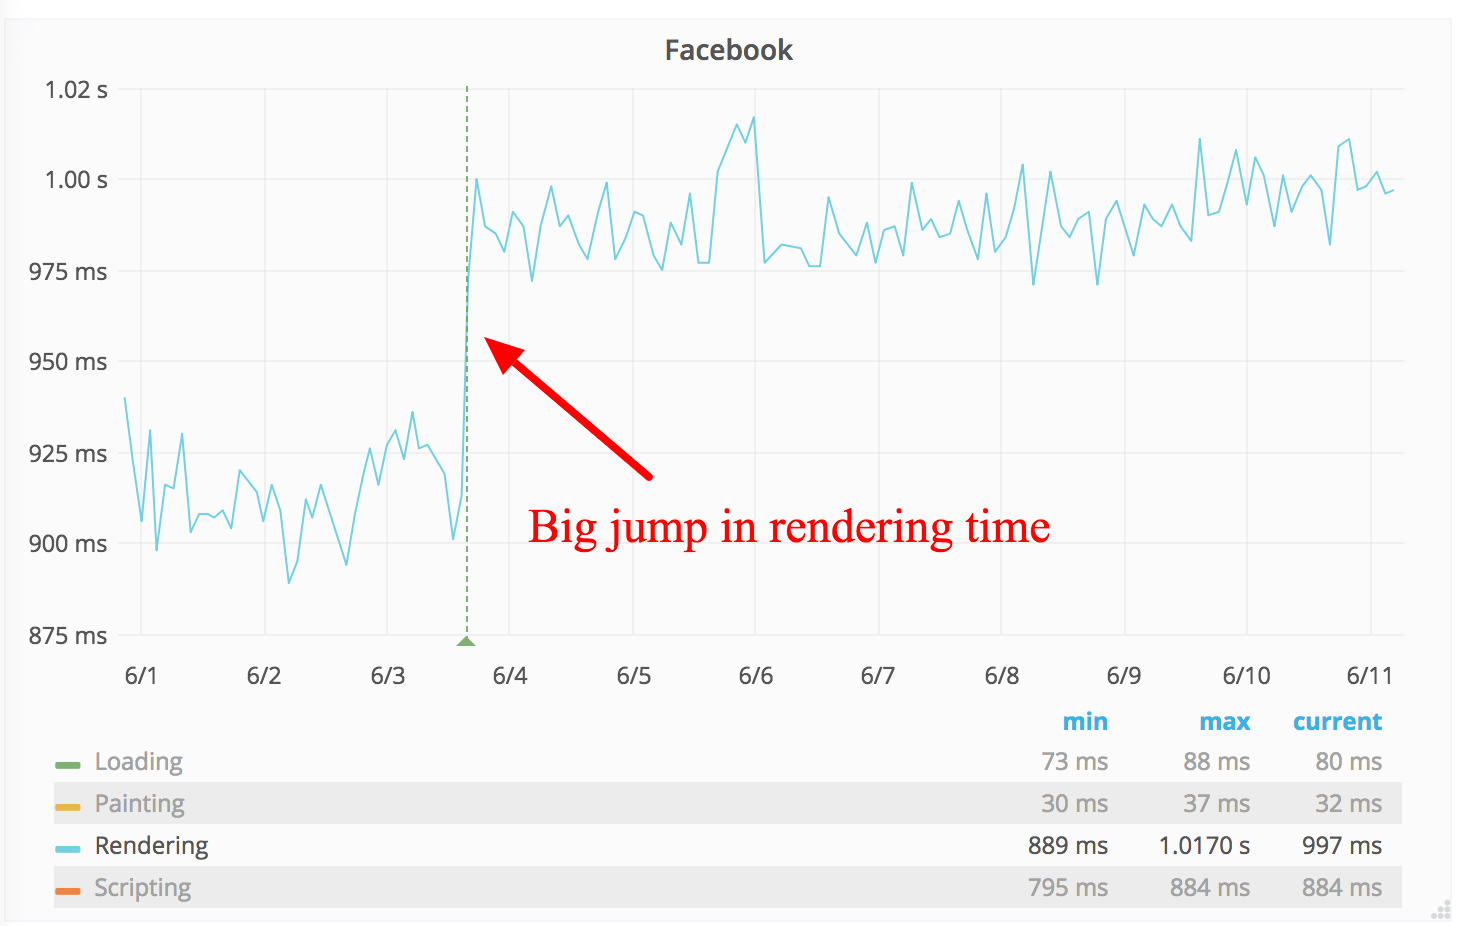
Performance profiling
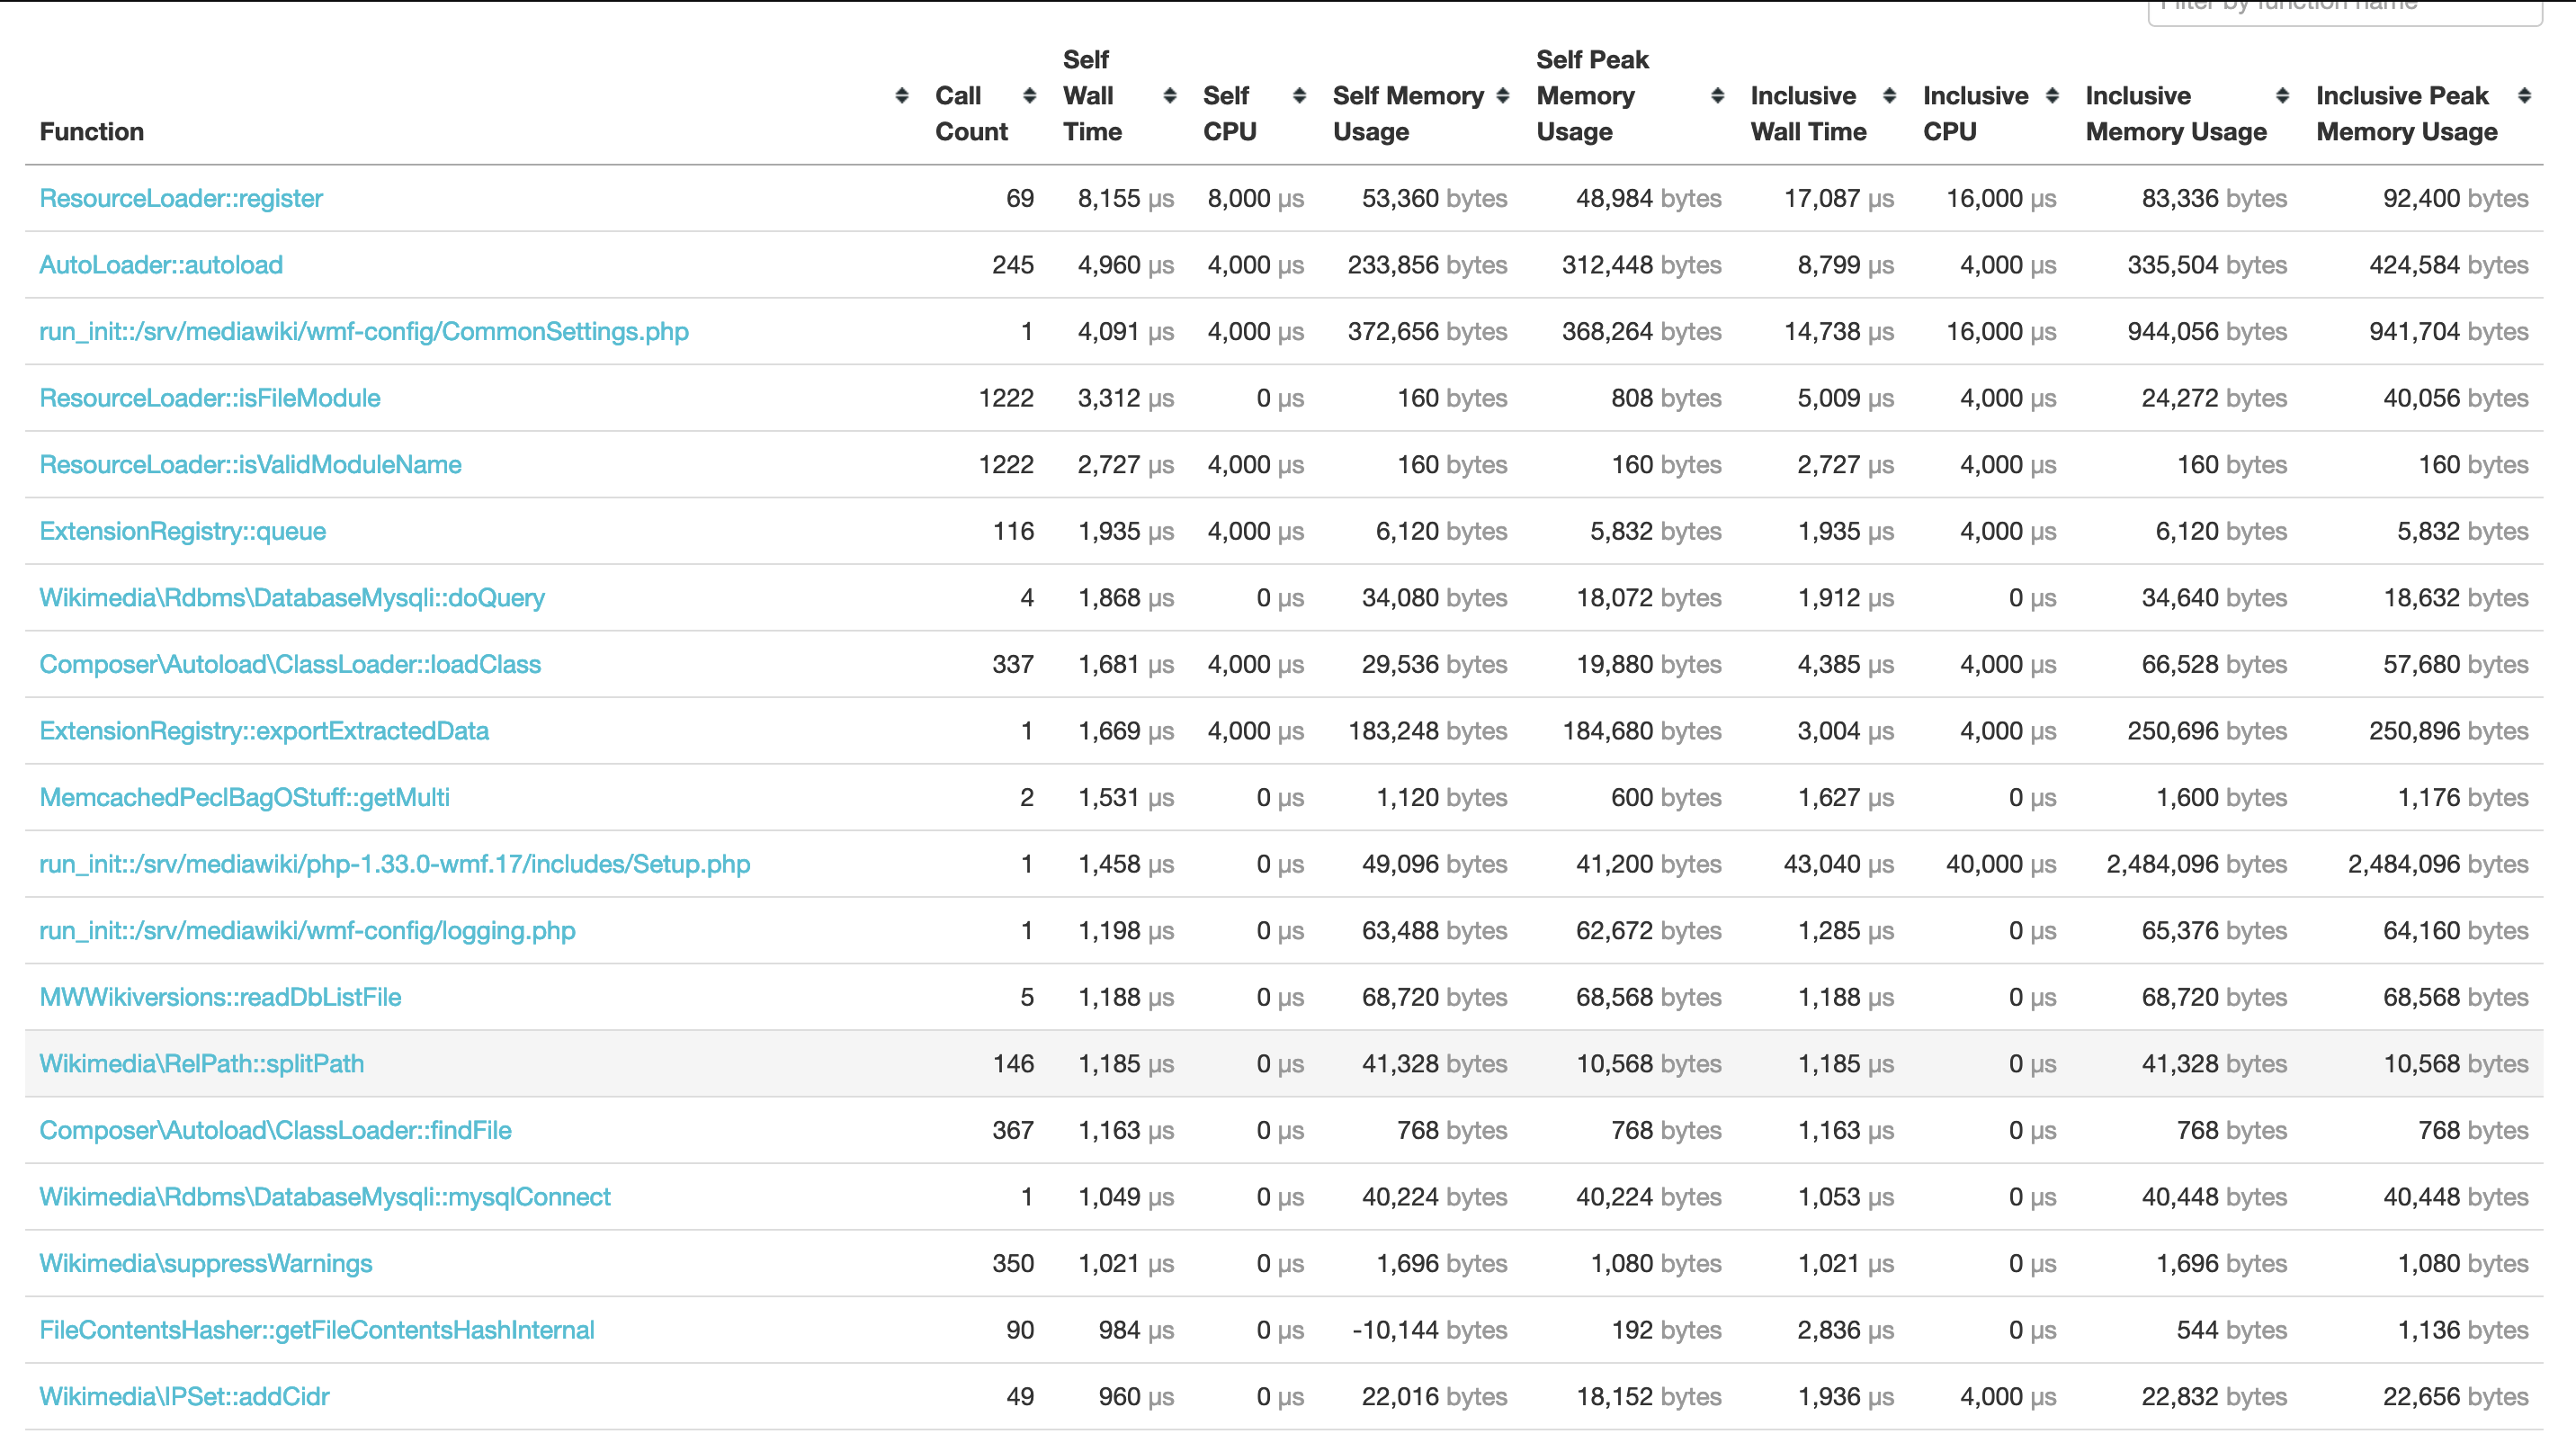
The performance profiler shows where time is spent in a web request. This feature was originally implemented using the XHProf PHP extension (for PHP 5 and HHVM). XHProf is no longer actively developed, or packaged, for PHP 7. As part of the PHP 7 migration this year, we migrated to Tideways which provides similar functionality. (T176370, T206152)
The Tideways profiler intercepts the internals of the PHP engine, and tracks the duration of every subroutine call in the MediaWiki codebase, and its relation to other subroutines. This structure is known as a call tree, or call graph.
The performance profile we capture with Tideways, is automatically sent to our XHGui installation at at https://performance.wikimedia.org (public). There, the request can be inspected in fine detail. In addition to a full call graph, it also monitors memory usage throughout the web request.
| Most expensive functions (XHGui) | Call graph (XHGui) |
|---|---|
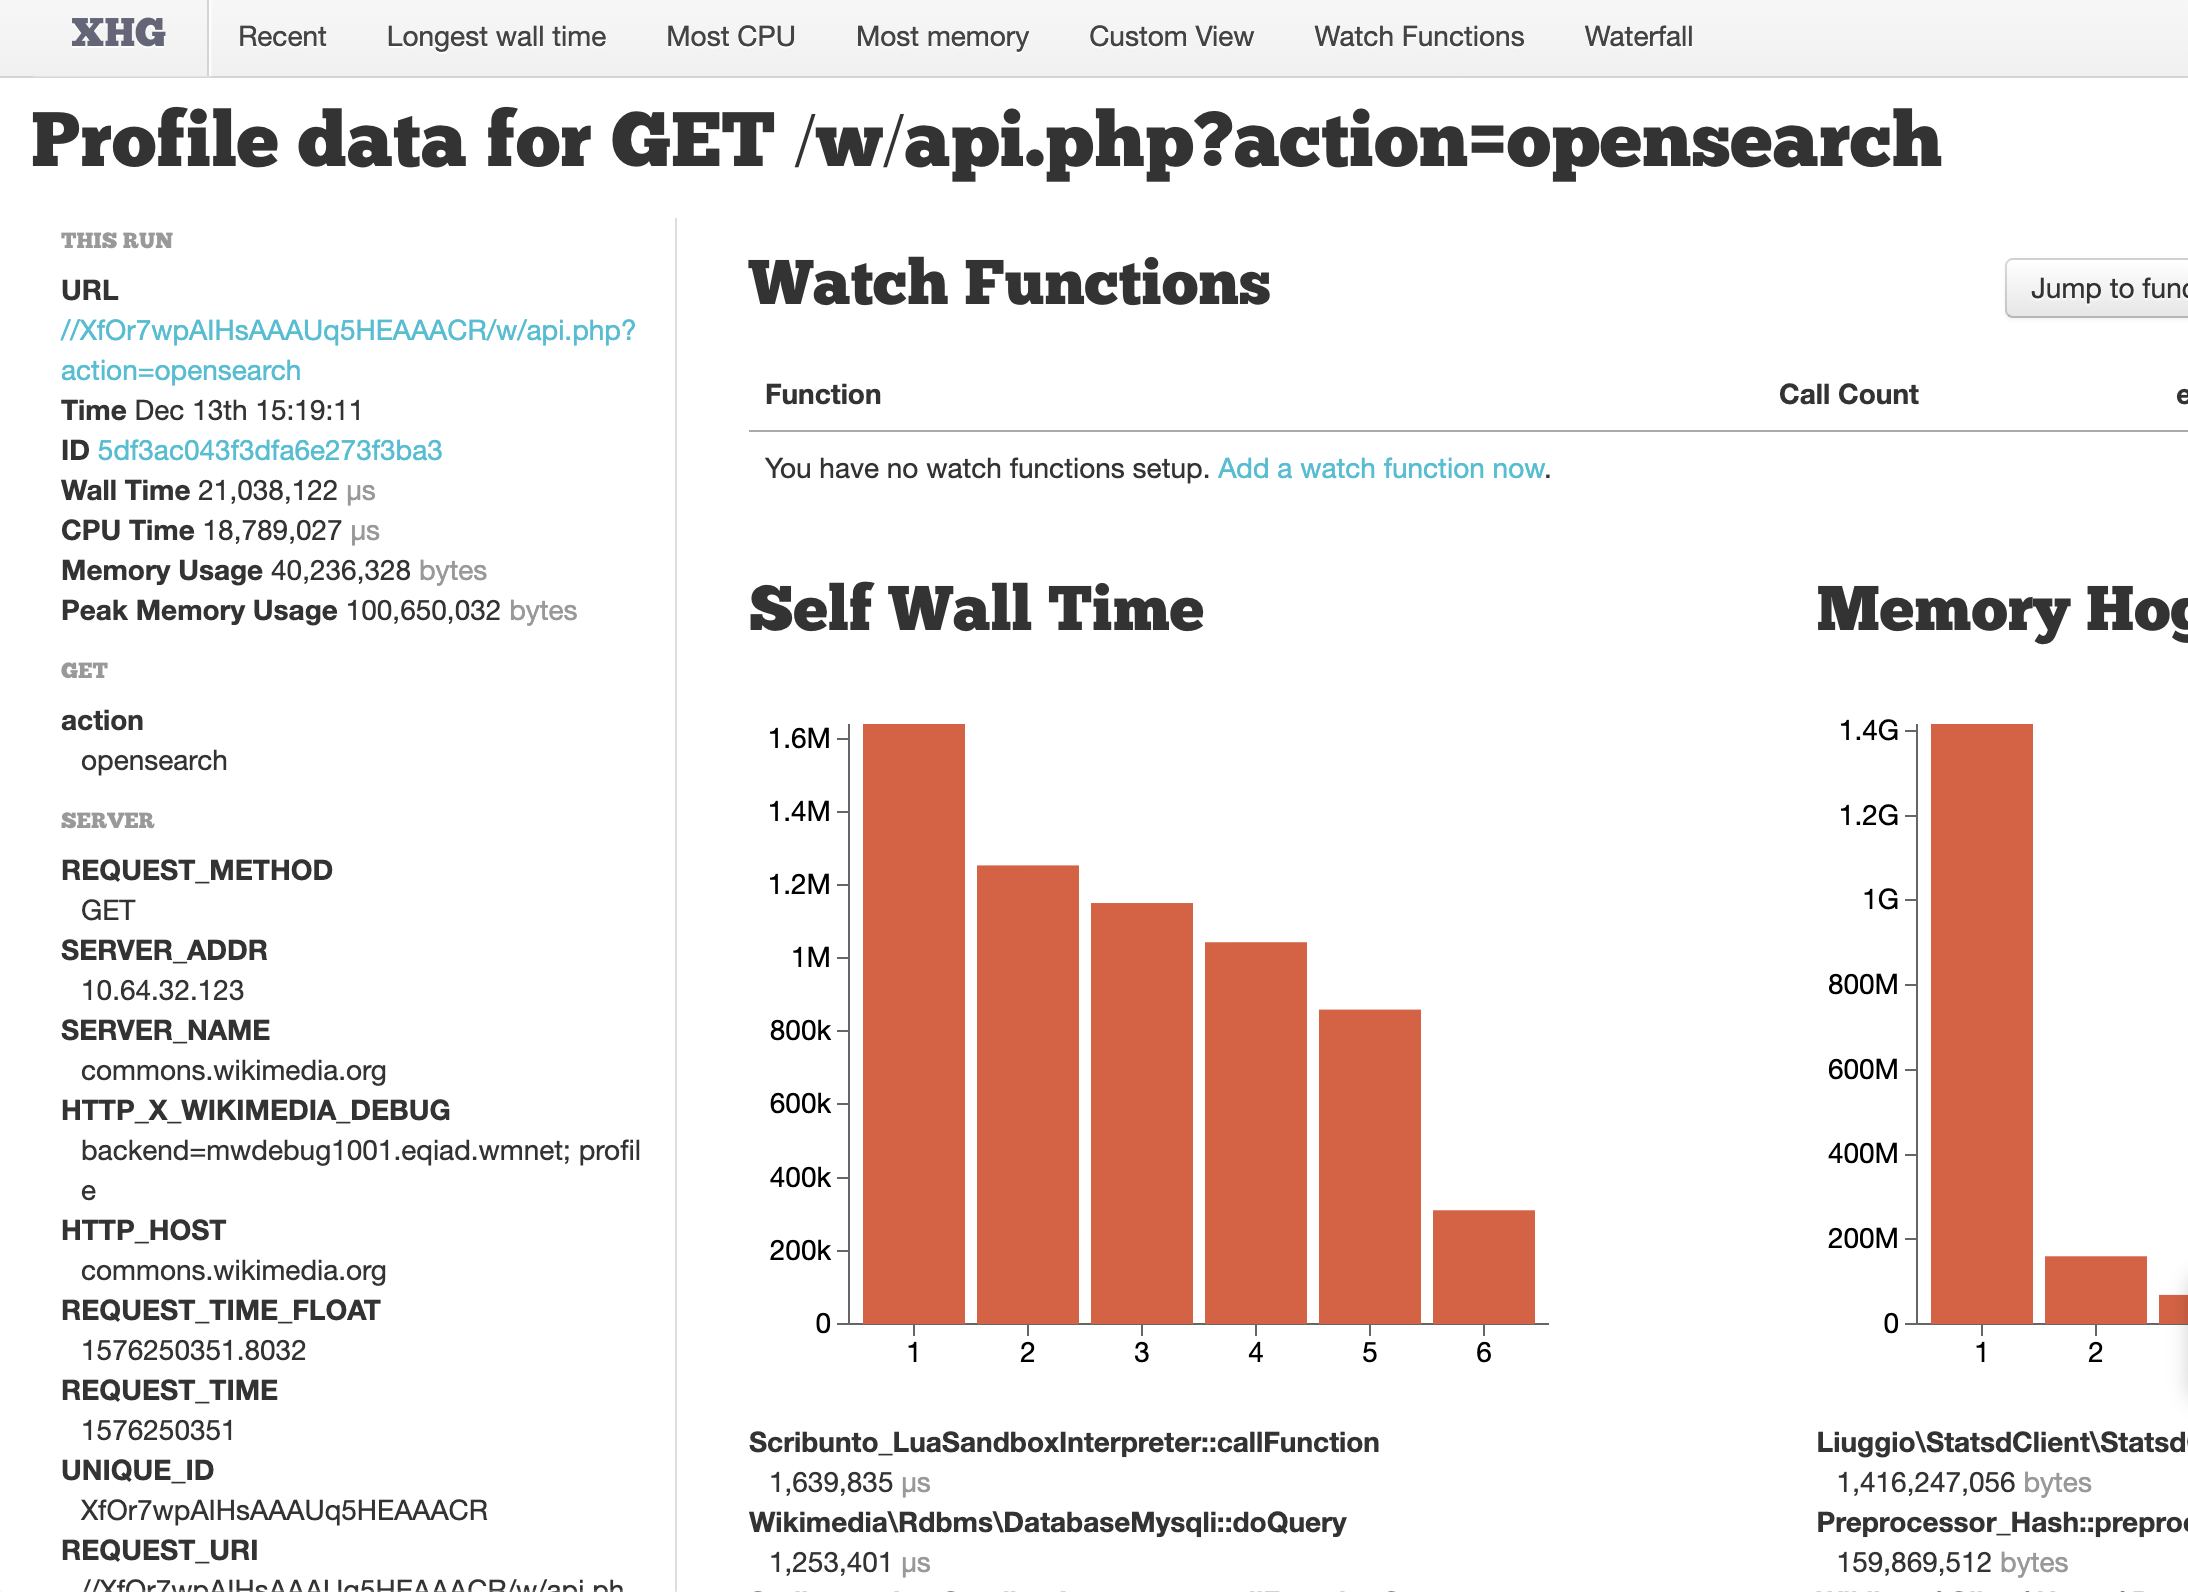 | 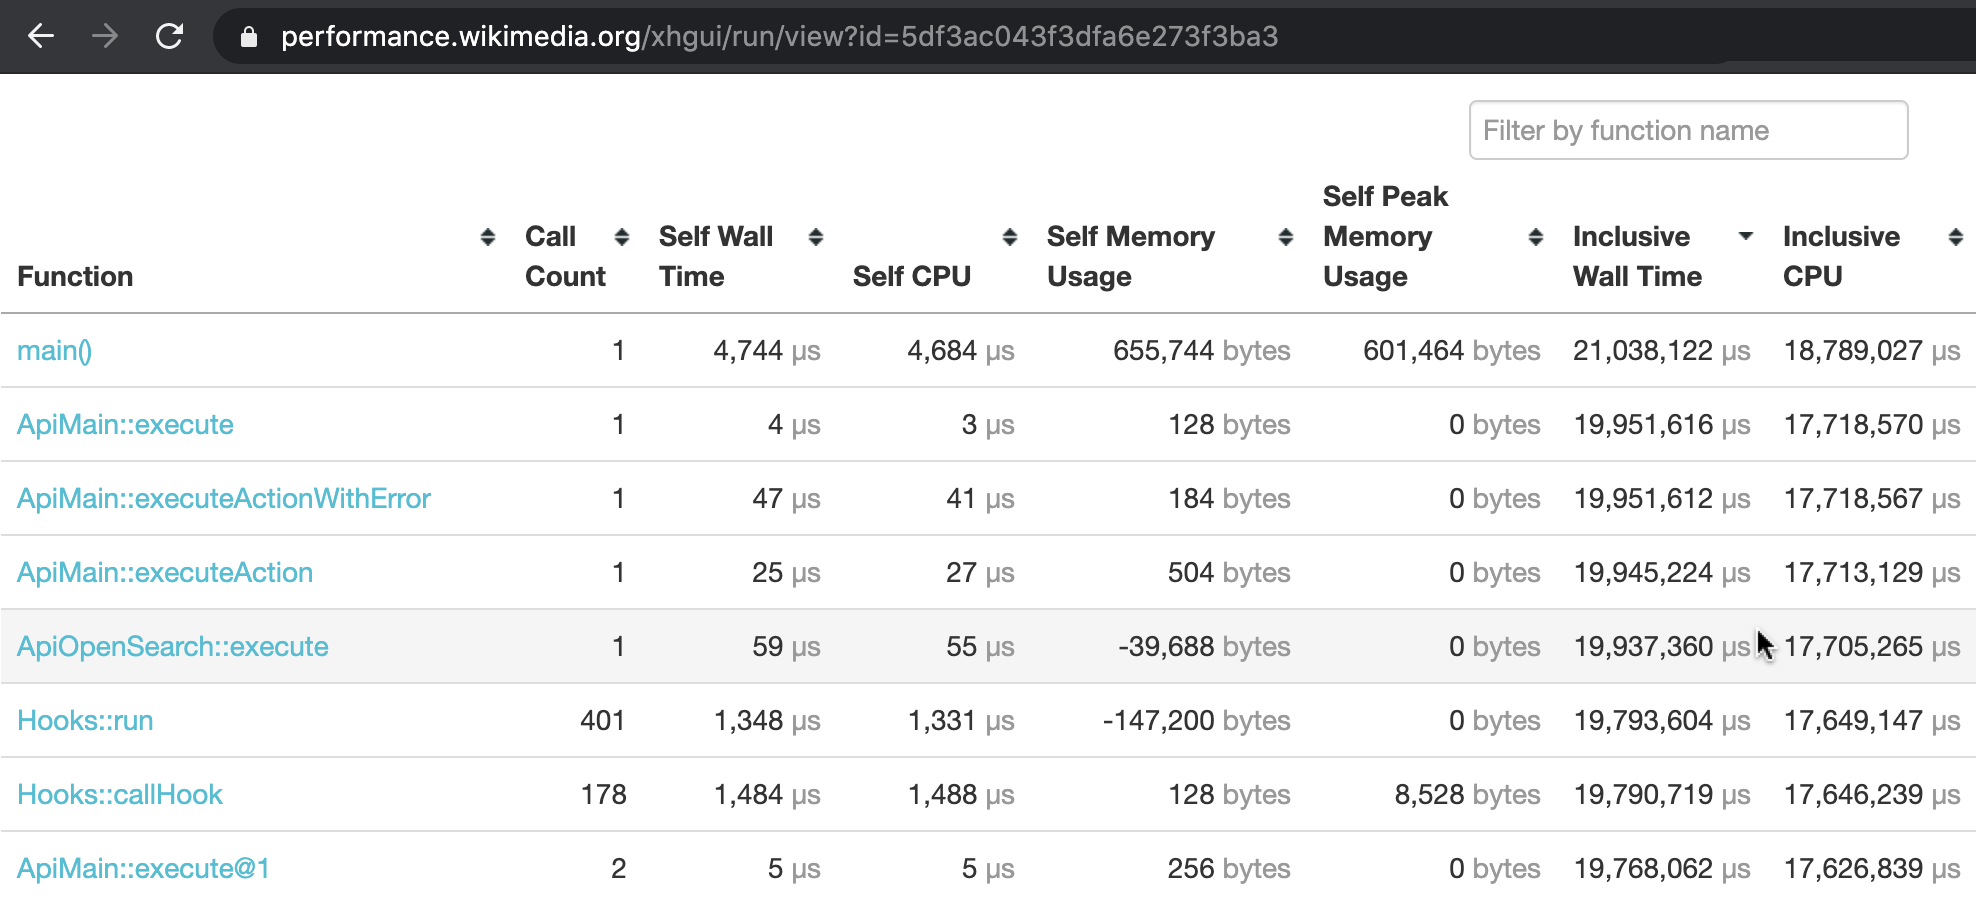 |
§ 3. How does it all work?
Browser extension
The browser extension is written using the WebExtensions API which Firefox and Chrome implement.
You can find the source code on github.com/wikimedia/WikimediaDebug. To learn more about how WebExtensions work, refer to MDN docs, or Chrome docs.
HTTP header
When you activate WikimediaDebug, the browser is given one an extra HTTP header. This header is sent along with all web requests relating to WMF's wiki domains. Both those for production, and those belonging to the Beta Cluster. In other words, any web request for *.wikipedia.org, wikidata.org, *.beta.wmflabs.org, etc.
The header is called X-Wikimedia-Debug. In the edge traffic layers of Wikimedia, this header is used as signal to bypass the CDN cache. The request is then forwarded, past the load balancers, directly to the specified mw-debug server.
X-Wikimedia-Debug: backend=<servername> [ ; log ] [ ; profile ] [ ; forceprofile ] [ ; readonly ]
mediawiki-config
This HTTP header is parsed by our MediaWiki configuration (wmf/profiler.php, and wmf/logging.php).
For example, when profile is set (the XHGui option), profiler.php invokes Tideways to start collecting stack traces with CPU/memory information. It then schedules a shutdown callback in which it gathers this data, connects to the XHGui database, and inserts a new record. The record can then be viewed via performance.wikimedia.org.
See also
- Documentation: How to use WikimediaDebug.
- Change log: WikimediaDebug releases.
- GitHub: perftools/xhgui.
Further reading
- How to debug in production with X-Wikimedia-Debug (Feb 2019), by Kosta Harlan.
- Inline callstack profiling - Now also on Beta Cluster (Jan 2018), by Timo Tijhof.
- Introducing X-Wikimedia-Debug, your new secret side-kick (Mar 2016) by Ori Livneh.


