One of the critical pieces of our infrastructure is Gerrit. It hosts most of our git repositories and is the primary code review interface. Gerrit is written in the Java programming language which runs in the Java Virtual Machine (JVM). For a couple years we have been struggling with memory issues which eventually led to an unresponsive service and unattended restarts. The symptoms were the usual ones: the application responses being slower and degrading until server side errors render the service unusable. Eventually the JVM terminates with:
java.lang.OutOfMemoryError: Java heap space
This post is my journey toward identifying the root cause and having it fixed up by the upstream developers. Given I barely knew anything about Java and much less about its ecosystem and tooling, I have learned more than a few things on the road and felt like it was worth sharing.
Prior work
The first meaningful task was in June 2019 (T225166) which over several months has led us to:
- replace aging underlying hardware
- tuning the memory garbage collector and switching to the G1 garbage collector
- raising the amount of memory allocated to the JVM (the heap)
- upgraded the Debian operating system by two major release (Jessie → Stretch → Buster)
- conduct a major upgrade of Gerrit (June 2020, Gerrit 2.15 → 3.2)
- bots crawling the repositories get moved to a replica
- fixing lack of cache in a MediaWiki extension querying Gerrit more than it should have
All of those were sane operations that are part of any application life-cycle, some were meant to address other issues. Raising the maximum heap size (20G to 32G) definitely reduced the frequency of crashes.
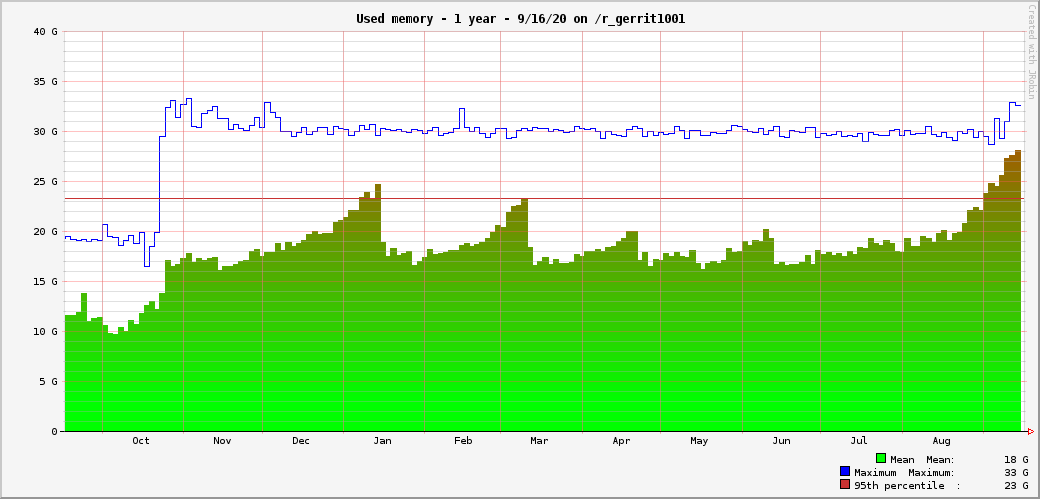
Still, we had memory filing over and over. The graph below shows the memory usage from September 2019 to September 2020. The increase of maximum heap usage in October 2020 is the JVM heap being raised from 20G to 32G. Each of the "little green hills" correspond to memory filing up until we either restarted Gerrit or the JVM unattended crash:
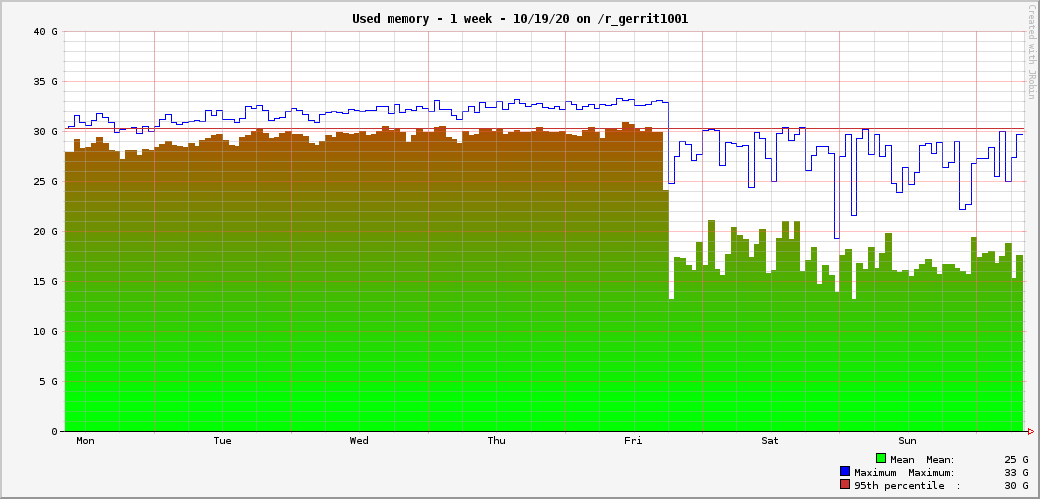
Zooming on a week, it is clearly seen the memory was almost entirely filled until we had to restart:
This had to stop. Complaints about Gerrit being unresponsive, SRE having to respond to java.lang.OutOfMemoryError: Java heap space or us having to "proactively" restart before a week-end. They were not good practices. Back and fresh from vacations, I filed a new task T263008 in September 2020 and started to tackle the problem on my spare time. Would I be able to find my way in an ecosystem totally unknown to me?
Challenge accepted!
stuff learned
- Routine maintenance are definitely a need
- Don't expect things to magically solve but commit to thoroughly identify the root cause instead of hoping.
Looking at memory
Since the JVM runs out of memory, lets look at memory allocation. The JDK provides several utilities to interact with a running JVM. Be it to attach a debugger, writing a copy of the whole heap or sending admin commands to the JVM.
jmap lets one take a full capture of the memory used by a Java virtual machine. It has to run as the same user as the application (we use Unix username gerrit2) and when having multiple JDKs installed, one has to make sure to invoke the jmap that is provided by the Java version running the targeted JVM.
Dumping the memory is then a magic:
sudo -u gerrit2 /usr/lib/jvm/java-8-openjdk-amd64/bin/jmap \
  -dump:live,format=b,file=/var/lib/gerrit-202009170755.hprof <pid of java process here>
It takes a few minutes depending on the number of objects. The resulting .hprof file is a binary format, which can be interpreted by various tools.
jhat, a Java heap analyzer, is provided by the JDK along jmap. I ran it disabling tracking of of object allocations (-stack false) as well as references to object (|-refs false) since even with 64G of RAM and 32 core it took a few hours and eventually crashed. That is due to the insane amount of live objects. On the server I thus ran:
/usr/lib/jvm/java-8-openjdk-amd64/bin/jhat -stack false -refs false gerrit-202009170755.hprof
It spawns a web service which I can reach from my machine over ssh using some port redirection and open a web browser for it:
ssh  -C -L 8080:ip6-localhost:7000 gerrit1001.wikimedia.org &
xdg-open http://ip6-localhost:8080/
Instance Counts for All Classes (excluding native types)
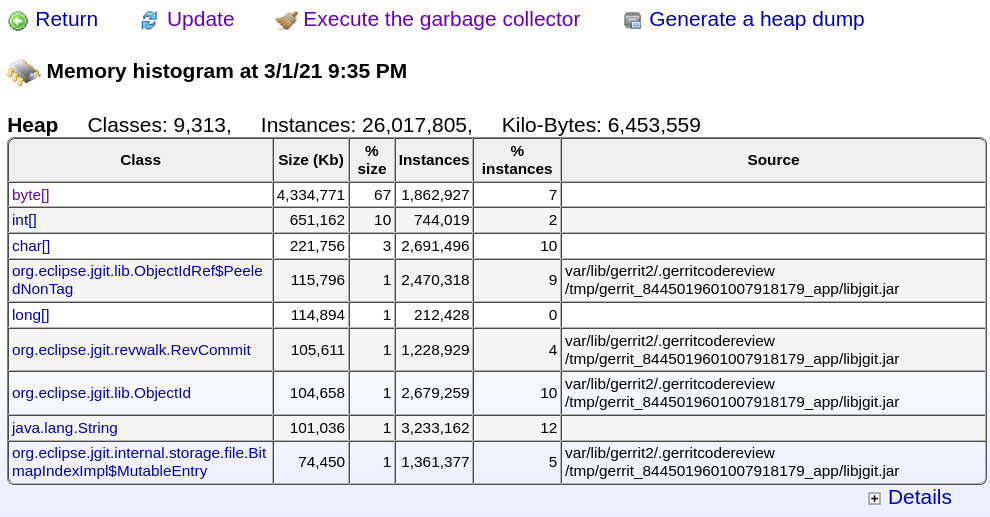
2237744 instances of class org.eclipse.jgit.lib.ObjectId
2128766 instances of class org.eclipse.jgit.lib.ObjectIdRef$PeeledNonTag
735294 instances of class org.eclipse.jetty.util.thread.Locker
735294 instances of class org.eclipse.jetty.util.thread.Locker$Lock
735283 instances of class org.eclipse.jetty.server.session.Session
...
And an other view shows 3.5G of byte arrays.
I got pointed to https://heaphero.io/ however the file is too large to upload and it contains sensitive information (credentials, users personal information) which we can not share with a third party.
Nothing really conclusive at this point, the heap dump has been taken shortly after a restart and Gerrit was not in trouble.
Eventually I found Javamelody has a view providing the exact same information without all the trouble of figuring out jmap, jhat and ssh proper set of parameters. Just browse to the monitoring page and:
stuff learned
- jmap to issue commands to the jvm including taking a heap dump
- jhat to run analysis with some options required to make it workable
- Use JavaMelody instead
JVM handling of out of memory error
An idea was to take a heap dump whenever the JVM encounters an out of memory error. That can be turned on by passing the extended option HeapDumpOnOutOfMemoryError to the JVM and specifying where the dump will be written to with HeapDumpPath:
java \
  -XX:+HeapDumpOnOutOfMemoryError \
  -XX:HeapDumpPath=/srv/gerrit \
  -jar gerrit.war ...
And surely next time it ran out of memory:
Nov 07 13:43:35 gerrit2001 java[30197]: java.lang.OutOfMemoryError: Java heap space
Nov 07 13:43:35 gerrit2001 java[30197]: Dumping heap to /srv/gerrit/java_pid30197.hprof ...
Nov 07 13:47:02 gerrit2001 java[30197]: Heap dump file created [35616147146 bytes in 206.962 secs]
Which results in a 34GB dump file which was not convenient for a full analysis. Even with 16G of heap for the analyze and a couple hours of CPU churning it was not any helpful
And at this point the JVM is still around, the java process is still there and thus systemd does not restart the service for us even though we have instructed it to do so:
[Service]
ExecStart=java -jar gerrit.war
Restart=always
RestartSec=2s
That lead to our Gerrit replica being down for a whole weekend with no alarm whatsoever (T267517). I imagine the reason for the JVM not exiting on an OutOfMemoryError is to let one investigate the reason. Just like heap dump, the behavior can be configured via the ExitOnOutOfMemoryError extended option:
java -XX:+ExitOnOutOfMemoryError
Next time the JVM will exit causing systemd to notice the service went away and so it will happily restart it again.
stuff learned
- automatic heap dumping with the JVM for future analysis
- Be sure to have the JVM exit when running out of memory so systemd will restart the service
- Process can be up while still not serving its purpose
Side track to jgit cache
When I filed the task, I suspected enabling git protocol version 2 (J199) on CI might have been the root cause. That eventually lead me to look at how Gerrit caches git operations. Being a Java application it does not use the regular git command but a pure Java implementation jgit, a project started by the same author as Gerrit (Shawn Pearce).
To speed up operations, jgit keeps git objects in memory with various tuning settings. You can read more about it at T263008#6601490 , but in the end it was of no use for the problem. @thcipriani would later point out that jgit cache does not overgrow past its limit:
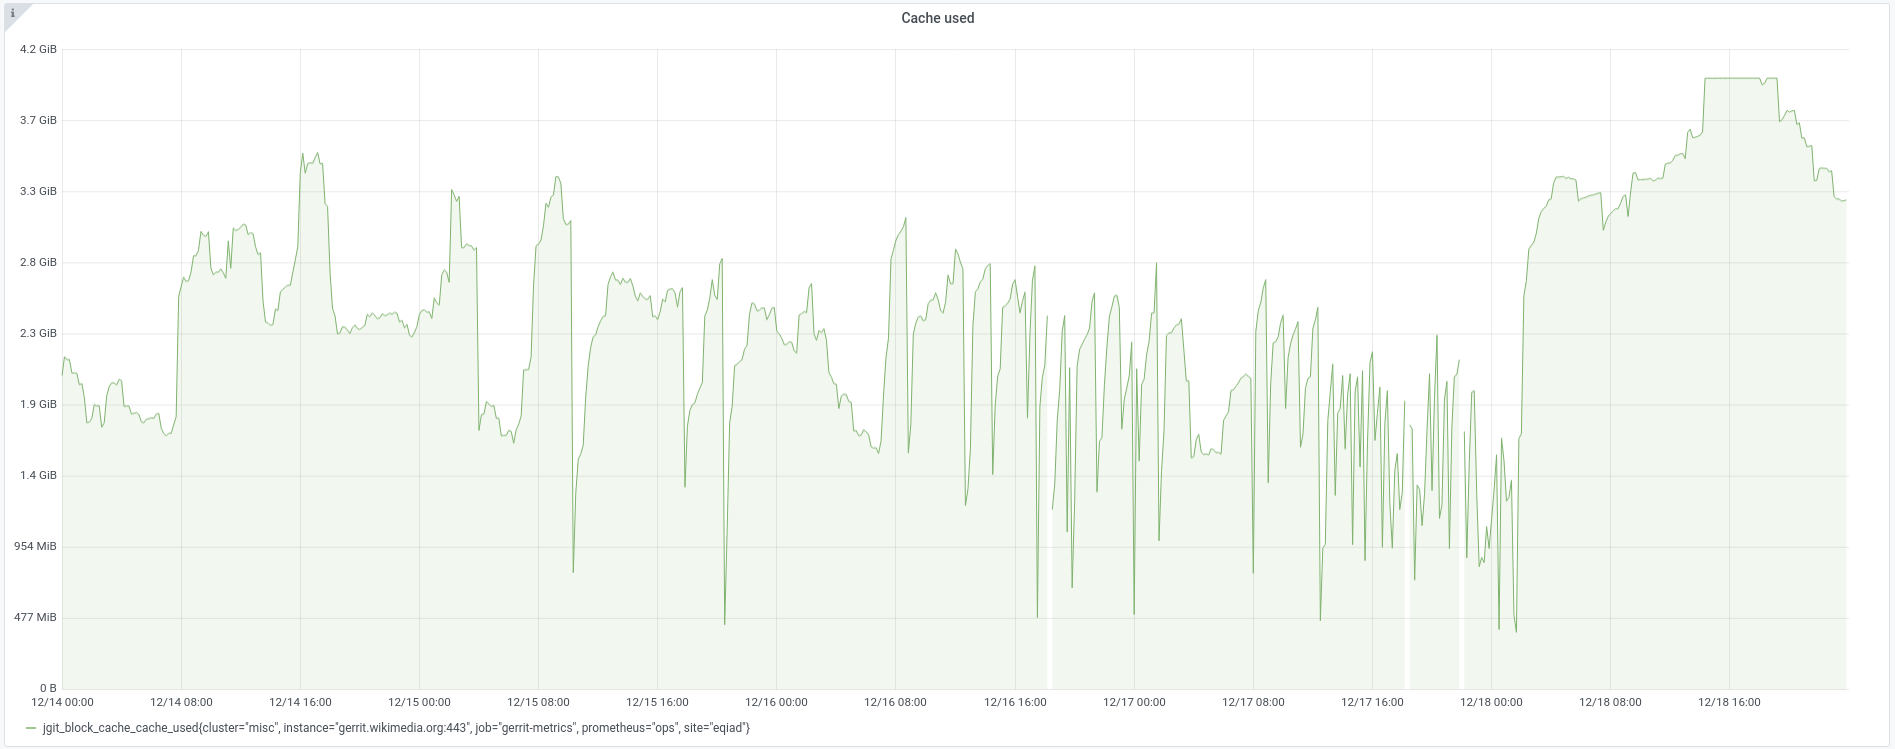
The investigation was not a good lead, but surely it prompted us to have a better view as to what is going on in the jgit cache. But to do so we would need to expose historical metrics of the status of the cache.
Stuff learned
- Jgit has in memory caches to hold frequently accessed repositories / objects in the JVM memory speeding up access to them.
Metrics collection
We always had trouble determining whether our jgit cache was properly sized and tuned it randomly with little information. Eventually I found out that Gerrit does have a wide range of metrics available which are described at https://gerrit.wikimedia.org/r/Documentation/metrics.html . I always wondered how we could access them without having to write a plugin.
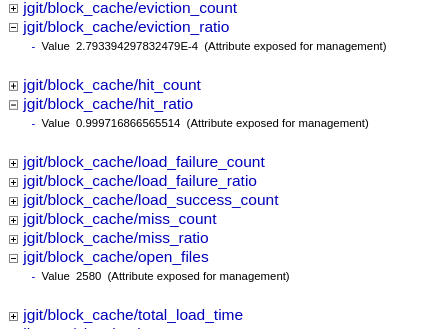
The first step was to add the metrics-reporter-jmx plugin. It registers all the metrics with JMX, a Java system to manage resources. That is then exposed by JavaMelody and at least let us browse the metrics:
I long had a task to get those metrics exposed (T184086) but never had a strong enough incentive to work it. The idea was to expose those metrics to the Prometheus monitoring system which would scrape them and make them available in Grafana. They can be exposed using the metrics-reporter-prometheus plugin. There is some configuration required to create an authentication token that lets Prometheus scrape the metrics and it is then all set and collected.
In Grafana, discovering which metrics are of interest might be daunting. Surely for the jgit cache it is only a few metrics we are interested in and crafting a basic dashboard for it is simple enough. But since we now collect all those metrics, surely we should have dashboards for anything that could be of interest to us.
While browsing the Gerrit upstream repositories, I found an unadvertised repository: gerrit/gerrit-monitoring. The project aims at deploying to Kubernetes a monitoring stack for Gerrit composed of Grafana, Loki, Prometheus and Promtail. While browsing the code, I found out they already had a Grafana template which I could import to our Grafana instance with some little modifications.
During the Gerrit Virtual Summit I raised that as a potentially interesting project for the whole community and surely a few days later:
- The existing dashboard got adjusted to be easily imported outside of the gerrit-monitoring context ( https://gerrit-review.googlesource.com/c/gerrit-monitoring/+/289222/ )
- The authors have sent a wide announcement to highlight the project: Monitoring dashboards for Gerrit (An update about the gerrit-monitoring project)
In the end we have a few useful Grafana dashboards, the ones imported from the gerrit-monitoring repo are suffixed with (upstream): https://grafana.wikimedia.org/dashboards/f/5AnaHr2Mk/gerrit
And I crafted one dedicated to jgit cache: https://grafana.wikimedia.org/d/8YPId9hGz/jgit-block-cache
Stuff learned
- Prometheus scraping system with auth token
- Querying Prometheus metrics in Grafana and its vector selection mechanism
- Other Gerrit administrators already created Vizualization
- Raising our reuse prompted upstream to further advertise their solution which hopefully has led to more adoption of their solution.
Despair
After a couple months, there was no good lead. The issue has been around for a while, in a programming language I don't know with assisting tooling completely alien to me. I even found jcmd to issue commands to the JVM, such as dumping a class histogram, the same view provided by JavaMelody:
$ sudo -u gerrit2 jcmd 2347 GC.class_histogram
num     #instances         #bytes  class name
3	----------------------------------------------
4	   5:      10042773     1205132760  org.eclipse.jetty.server.session.SessionData
5	   8:      10042773      883764024  org.eclipse.jetty.server.session.Session
6	  11:      10042773      482053104  org.eclipse.jetty.server.session.Session$SessionInactivityTimer$1
7	  13:      10042779      321368928  org.eclipse.jetty.util.thread.Locker
8	  14:      10042773      321368736  org.eclipse.jetty.server.session.Session$SessionInactivityTimer
9	  17:      10042779      241026696  org.eclipse.jetty.util.thread.Locker$Lock
That is quite handy when already in a terminal, saves a few click to switch to a browser, head to JavaMelody and find the link.
But it is the last week of work of the year.
Christmas is in two days.
Kids are messing up all around the home office since we are under lockdown.
Despair.
Out of rage I just stall the task shamelessly hoping for Java 11 and Gerrit 3.3 upgrades to solve this. Much like we hoped the system would be fixed by upgrading.
Wait..
1 million?
ONE MILLION ??
TEN TO THE POWER OF SIX ???
WHY IS THERE A MILLION HTTP SESSIONS HELD IN GERRIT !!!!!!?11??!!??
10042773 org.eclipse.jetty.server.session.SessionData
There. Right there. It was there since the start. In plain sight. And surely 19 hours later Gerrit had created 500k sessions for 56 MBytes of memory. It is slowly but surely leaking memory.
stuff learned
- Everything clears up once one has found the root cause
When upstream saves you
At this point it was just an intuition, albeit a strong one. I know not much about Java or Gerrit internals and went to invoke upstream developers for further assistance. But first, I had to reproduce the issue and investigate a bit more to give as many details as possible when filing a bug report.
Reproduction
I copied a small heap dump I took just a few minutes after Gerrit got restarted, it had a manageable size making it easier to investigate. Since I am not that familiar with the Java debugging tools, I went with what I call a clickodrome interface, a UI that lets you interact solely with mouse clicks: https://visualvm.github.io/
Once the heap dump is loaded, I could easily access objects. Notably the org.eclipse.jetty.server.session.Session objects had a property expiry=0, often an indication of no expiry at all. Expired sessions are cleared by Jetty via a HouseKeeper thread which inspects sessions and deletes expired ones. I have confirmed it does run every 600 seconds, but since sessions are set to not expire, they pile up leading to the memory leak.
On December 24th, a day before Christmas, I filed a private security issue to upstream (now public): https://bugs.chromium.org/p/gerrit/issues/detail?id=13858
After the Christmas and weekend break upstream acknowledged and I did more investigating to pinpoint the source of the issue. The sessions are created by a SessionHandler and debug logs show: dftMaxIdleSec=-1 or Default maximum idle seconds set to -1, which means that by default the sessions are created without any expiry. The Jetty debug log then gave a bit more insight:
DEBUG org.eclipse.jetty.server.session : Session xxxx is immortal && no inactivity eviction
It is immortal and is thus never picked up by the session cleaner:
DEBUG org.eclipse.jetty.server.session : org.eclipse.jetty.server.session.SessionHandler
==dftMaxIdleSec=-1 scavenging session ids []
                                          ^^^ --- empty array
Our Gerrit instance has several plugins and the leak can potentially come from one of them. I then booted a dummy Gerrit on my machine (java -jar gerrit-3.3.war) cloned the built-in All-Projects.git repository repeatedly and observed objects with VisualVM. Jetty sessions with no expiry were created, which rules out plugins and point at Gerrit itself. Upstream developer Luca Milanesio pointed out that Gerrit creates a Jetty session which is intended for plugins. I have also narrowed down the leak to only be triggered by git operations made over HTTP. Eventually, by commenting out a single line of Gerrit code, I eliminated the memory leak and upstream pointed at a change released a few versions ago that may have been the cause.
Upstream then went on to reproduce on their side, took some measurement before and after commenting out and confirmed the leak (750 bytes for each git request made over HTTP). Given the amount of traffic we received from humans, systems or bots, it is not surprising we ended up hitting the JVM memory limit rather quickly.
Eventually the fix got released and new Gerrit versions were released. We upgraded to the new release and haven't restarted Gerrit since then. Problem solved!
Stuff learned
- Even with no knowledge about a programming language, if you can build and run it, you can still debug using print or the universal optimization operator: //.
- Quickly acknowledge upstream hints, ideas and recommendations. Even if it is to dismiss one of their leads.
- Write a report, this blog.
Thank you upstream developers Luca Milanesio and David Ostrovsky for fixing the issue!
Thank you @dancy for the added clarifications as well as typos and grammar fixes.
References
- T225166 - 2019 issue referencing out of heap
- T263008 - 2020 fresh new task that eventually has lead to resolution
- Upstream task https://bugs.chromium.org/p/gerrit/issues/detail?id=13858
- The root cause, code adding auditing of GIT over http commands: https://gerrit-review.googlesource.com/c/gerrit/+/203611
- Fix: https://gerrit.googlesource.com/gerrit/+/4b2b2d831b39f57720923d5b0c23f1b6d94be0e9
- CVE-2021-22553 - Google Inc. vulnerability report
Event Timeline
Wow thanks for the detailed write-up! Memory leaks can be some of the most difficult bugs to solve.
Great work @hashar! And a nice writeup too. I think this would make a nice Technical-blog-posts if you are interested in doing that extra step.