Go to https://xtools.wmflabs.org/ec/en.wikipedia.org/TheDragonFire
The edit summary statistics really don't add up.
| TheDragonFire | |
| Aug 12 2017, 11:06 AM |
| F9042614: Screen Shot 2017-08-12 at 8.50.15 pm.png | |
| Aug 12 2017, 11:06 AM |
Go to https://xtools.wmflabs.org/ec/en.wikipedia.org/TheDragonFire
The edit summary statistics really don't add up.
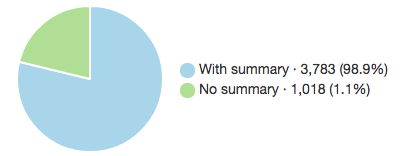
Very peculiar... The values are correct, but looking at the chart the green slice indeed doesn't look like 1.1%. I can confirm the correct data exists within the Chart.js instance, so I think it's a bug within the library itself. Will debug and write back when I know more.
Err... scratch that, pardon the brain farts. The pie chart is right, but the percentages are wrong. We're computing the percentages against live revisions, when it should be against total revisions. But the numbers 3,783 and 1,018 are correct, at least!
@MusikAnimal I'm not sure this fix is correct - isn't the figure for with edit summaries only for live edits?. With this 'fix' it would suggest I have 10.4% without summaries rather than 0.7% which I think is more likely, and what the old xtools shows.
It looks like countRevisionsWithoutComments included all deleted edits as having no summary.
countRevisionsWithComments comes from the 'with_comments' count and comes only from the revisionTable, not the archiveTable
countRevisionsWithoutComments is then made incorrectly from countAllRevisions - countRevisionsWithComments, so I believe it's this line at fault it should be:
public function countRevisionsWithoutComments()
{
    return $this->countLiveRevisions() - $this->countRevisionsWithComments();
}You are correct! This time I think we have it fixed for real... and I've added tests :) Thank you for noticing and informing us of this mistake.
Deployed :) Let us know if there are any more problems/inaccuracies/stupid developer mistakes!