Page MenuHomePhabricator

Investigate decrease in wikidata dispatch times due to eqiad -> codfw DC switch
Closed, ResolvedPublic

Description

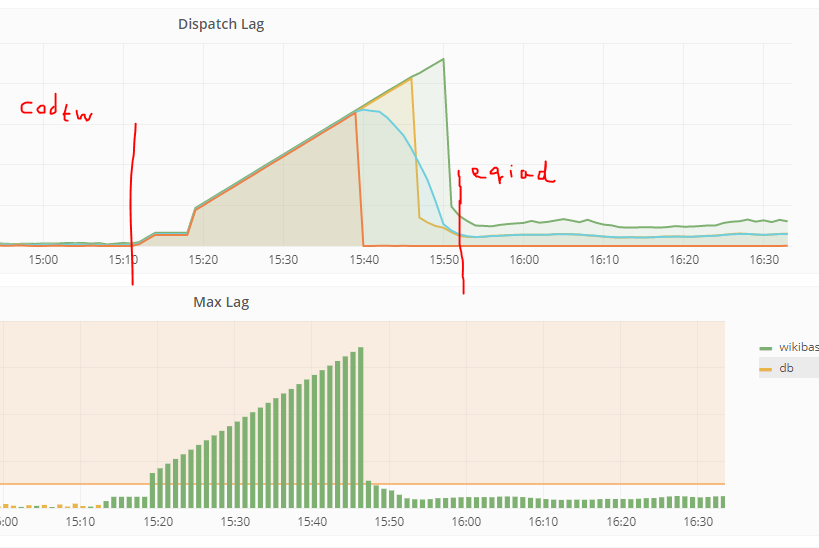
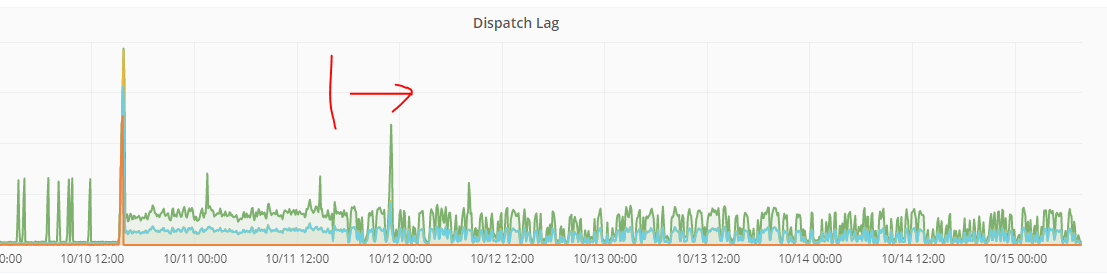
At the time of the eqiad -> codfw DC switch the average dispatch lag times for wikidata dropped from ~2.5 mins on average down to ~16 seconds.

This can be seen on https://grafana.wikimedia.org/dashboard/db/wikidata-dispatch?orgId=1&from=1535809586024&to=1538401586025

We should investigate what exactly caused this.

Looking at the metrics of the dispatching script it appears that the total amount of time spent selecting clients dramatically dropped.

https://grafana.wikimedia.org/dashboard/db/wikidata-dispatch-script?orgId=1&from=1536495649669&to=1537026325588

Possible causes?:

  • different mwmaint hardware
  • different db hardware
  • different redis hardware
  • some other db related difference
  • something else?

Event Timeline

So the timing point that I am looking at is the selectClient call in dispatchChanges.php

$wikiState = $dispatcher->selectClient();

Which is wrapped by some code sending data to wikibase.repo.dispatchChanges.selectClient-time in graphite, which can be looked at on https://grafana.wikimedia.org/dashboard/db/wikidata-dispatch-script in combination with other metrics.

The selectClient does a couple of things, but the only a few of which would make sense to see this sort of speed change.

Two queries come from Wikibase\Store\Sql\SqlChangeDispatchCoordinator::getCandidateClients and would be something like this on an s8 replica:

SELECT max( change_id ) as maxid FROM wb_changes

SELECT chd_site FROM wb_changes_dispatch WHERE ........... ORDER BY chd_seen ASC LIMIT ??

And from Wikibase\Store\Sql\SqlChangeDispatchCoordinator::lockClient also on an s8 replica:

SELECT chd_site,chd_db,chd_seen,chd_touched,chd_lock,chd_disabled FROM wb_changes_dispatch WHERE chd_site = ????

The method also interacts with redis creating locks with the following key:

Wikibase.{$this->repoSiteId}.dispatchChanges.$siteID
Addshore renamed this task from Investigate decrease in wikidata dispatch times due to eqiad -> codfw db switch to Investigate decrease in wikidata dispatch times due to eqiad -> codfw DC switch.Oct 1 2018, 2:12 PM
Addshore moved this task from incoming to needs discussion or investigation on the Wikidata board.
Addshore moved this task from Inbox to Research on the [DEPRECATED] wdwb-tech board.
Addshore added a project: Performance Issue.

Have you checked if the latest changes didn't just switch execution from HHVM to PHP7? That could explain a better performance.

Also, can I ask which redis servers are interacted with? I guess the ones for the locking system, right?

Have you checked if the latest changes didn't just switch execution from HHVM to PHP7? That could explain a better performance.

I can answer this: no, they did not. We launch mwscript for the dispatcher with PHP='hhvm -vEval.Jit=1'

Also, can I ask which redis servers are interacted with? I guess the ones for the locking system, right?

If that's the case I might look into the available hardware.

The "wikibaseDispatchRedisLockManager" uses $wmfMasterServices['redis_lock']

So:

// LockManager Redis
$services['eqiad']['redis_lock'] = [
	'rdb1' => '10.64.0.80',
	'rdb2' => '10.64.16.107',
	'rdb3' => '10.64.48.155'
];
$services['codfw']['redis_lock'] = [
	'rdb1' => '10.192.0.83',
	'rdb2' => '10.192.0.84',
	'rdb3' => '10.192.0.85',
];

I could add some extra timing to the code to determine if the time is being saved on one of the DB queries or during the lock.
I thoughts the DC switch back was happening this week, but as it isn't until next week I should be able to get some more info before it happens.

I poked at potential DB related changes a bit and found none. The tables are consistent across the cluster AFAICT and the queries are being executed in the same way.

Also I quickly micro-benchmarked getConnection+reuseConnection which we do quite a lot in both DCs and couldn't find a difference big enough to explain this (while codfw seems to be like 30% faster, this is not nearly enough).

> $factory = MediaWiki\MediaWikiServices::getInstance()->getDBLoadBalancerFactory();
> $t0 = microtime( true );
> for ( $i = 0; $i < 500; $i++ ) { $repoLB = $factory->getMainLB( 'wikidatawiki' ); $db = $repoLB->getConnection( DB_REPLICA, [], 'wikidatawiki' ); $db->query( 'SELECT "1"' ); $repoLB->reuseConnection( $db ); }
> echo microtime( true ) - $t0;

Due to this I would suggest further poking at the interaction with Redis.

It indeed is the lockmanager. I ran the following on both mwmaint2001 and mwmaint1001:

$lockManager = LockManagerGroup::singleton( wfWikiID() )->get( $wgWBRepoSettings['dispatchingLockManager'] );
$t0 = microtime( true );

for ( $i = 0; $i < 500; $i++ ) { $lockManager->lock( [ 'T205865-test-lock' ] )->isOK(); $lockManager->unlock( [ 'T205865-test-lock' ] )->isOK(); }

echo microtime( true ) - $t0;

mwmaint1001: 73.30463886261
mwmaint2001: 0.64075589179993

mwmaint1001: 73.30463886261
mwmaint2001: 0.64075589179993

Wow, now to figure out why......
Profile on mwmaint1001 P7627, profile on mwmaint2001 P7628

mwmaint1001: 73.30463886261
mwmaint2001: 0.64075589179993

Wow, now to figure out why......
Profile on mwmaint1001 P7627, profile on mwmaint2001 P7628

This could be down to the fact that mwmaint1001 will still connect to the codfw redis servers.

From IRC:
Aaron Schulz addshore: did you check cpu use on redis/mc servers? There is a lot more traffic in eqiad (100x network segments/sec)
AaronSchulz wonders why https://grafana.wikimedia.org/dashboard/db/redis?orgId=1&var-datasource=eqiad%20prometheus%2Fops&var-job=redis_sessions shows more commands in codfw
Aaron Schulz addshore: note that redis does not use the local cluster for writes (e.g. for sessions and for locks), so given the switchover, I'd expect eqiad to be slow

Addshore triaged this task as Medium priority.Oct 8 2018, 12:58 PM

And it looks like after the switch we are back to slow dispatching:

image.png (548×819 px, 42 KB)

It indeed is the lockmanager. I ran the following on both mwmaint2001 and mwmaint1001:

$lockManager = LockManagerGroup::singleton( wfWikiID() )->get( $wgWBRepoSettings['dispatchingLockManager'] );
$t0 = microtime( true );

for ( $i = 0; $i < 500; $i++ ) { $lockManager->lock( [ 'T205865-test-lock' ] )->isOK(); $lockManager->unlock( [ 'T205865-test-lock' ] )->isOK(); }

echo microtime( true ) - $t0;

mwmaint1001: 73.30463886261
mwmaint2001: 0.64075589179993

Reversing this experiment now that we have switched back I see:

mwmaint 1001: 1.4454369544983
mwmaint 2001: 73.811069011688

Reversing this experiment now that we have switched back I see:

mwmaint 1001: 1.4454369544983
mwmaint 2001: 73.811069011688

Interesting… so I went back looking at the databases and actually found something very interesting:
db2083: SELECT COUNT(*) FROM wb_changes_dispatch; -> 1 row in set (0.03 sec)
db1109: SELECT COUNT(*) FROM wb_changes_dispatch; -> 1 row in set (1.82 sec)
db1109: SELECT COUNT(*) FROM wb_changes_dispatch FORCE INDEX(primary); -> 1 row in set (0.00 sec)

I also test this with queries like the ones actually run, where the timing differences are similar (SELECT chd_site FROM wb_changes_dispatch WHERE (( chd_touched < '20181010214641' OR ( 1086 - chd_seen ) > 1000) ) AND (chd_seen < 1086) AND (chd_disabled = 0) ORDER BY chd_seen ASC LIMIT 15; is an example taken from my local installation).

Note the huge difference in Cardinality:

wikiadmin@db2083(wikidatawiki)> SHOW INDEXES FROM wb_changes_dispatch;
+---------------------+------------+---------------------------------+--------------+-------------+-----------+-------------+----------+--------+------+------------+---------+---------------+
| Table               | Non_unique | Key_name                        | Seq_in_index | Column_name | Collation | Cardinality | Sub_part | Packed | Null | Index_type | Comment | Index_comment |
+---------------------+------------+---------------------------------+--------------+-------------+-----------+-------------+----------+--------+------+------------+---------+---------------+
| wb_changes_dispatch |          0 | PRIMARY                         |            1 | chd_site    | A         |         577 |     NULL | NULL   |      | BTREE      |         |               |
| wb_changes_dispatch |          1 | wb_changes_dispatch_chd_seen    |            1 | chd_seen    | A         |         288 |     NULL | NULL   |      | BTREE      |         |               |
| wb_changes_dispatch |          1 | wb_changes_dispatch_chd_touched |            1 | chd_touched | A         |          48 |     NULL | NULL   |      | BTREE      |         |               |
+---------------------+------------+---------------------------------+--------------+-------------+-----------+-------------+----------+--------+------+------------+---------+---------------+
wikiadmin@db1109(wikidatawiki)> SHOW INDEXES FROM wb_changes_dispatch;
+---------------------+------------+---------------------------------+--------------+-------------+-----------+-------------+----------+--------+------+------------+---------+---------------+
| Table               | Non_unique | Key_name                        | Seq_in_index | Column_name | Collation | Cardinality | Sub_part | Packed | Null | Index_type | Comment | Index_comment |
+---------------------+------------+---------------------------------+--------------+-------------+-----------+-------------+----------+--------+------+------------+---------+---------------+
| wb_changes_dispatch |          0 | PRIMARY                         |            1 | chd_site    | A         |         577 |     NULL | NULL   |      | BTREE      |         |               |
| wb_changes_dispatch |          1 | wb_changes_dispatch_chd_seen    |            1 | chd_seen    | A         |           2 |     NULL | NULL   |      | BTREE      |         |               |
| wb_changes_dispatch |          1 | wb_changes_dispatch_chd_touched |            1 | chd_touched | A         |           2 |     NULL | NULL   |      | BTREE      |         |               |
+---------------------+------------+---------------------------------+--------------+-------------+-----------+-------------+----------+--------+------+------------+---------+---------------+

Change 465933 had a related patch set uploaded (by Marostegui; owner: Marostegui):
[operations/mediawiki-config@master] db-eqiad.php: Temporary depool db1109

https://gerrit.wikimedia.org/r/465933

Change 465933 merged by jenkins-bot:
[operations/mediawiki-config@master] db-eqiad.php: Temporary depool db1109

https://gerrit.wikimedia.org/r/465933

I have run an analyze table on both db1109 and db2083 and things are similar now:

db1109
+---------------------+------------+---------------------------------+--------------+-------------+-----------+-------------+----------+--------+------+------------+---------+---------------+
| Table               | Non_unique | Key_name                        | Seq_in_index | Column_name | Collation | Cardinality | Sub_part | Packed | Null | Index_type | Comment | Index_comment |
+---------------------+------------+---------------------------------+--------------+-------------+-----------+-------------+----------+--------+------+------------+---------+---------------+
| wb_changes_dispatch |          0 | PRIMARY                         |            1 | chd_site    | A         |         577 |     NULL | NULL   |      | BTREE      |         |               |
| wb_changes_dispatch |          1 | wb_changes_dispatch_chd_seen    |            1 | chd_seen    | A         |         456 |     NULL | NULL   |      | BTREE      |         |               |
| wb_changes_dispatch |          1 | wb_changes_dispatch_chd_touched |            1 | chd_touched | A         |         264 |     NULL | NULL   |      | BTREE      |         |               |
+---------------------+------------+---------------------------------+--------------+-------------+-----------+-------------+----------+--------+------+------------+---------+---------------+
db2083
+---------------------+------------+---------------------------------+--------------+-------------+-----------+-------------+----------+--------+------+------------+---------+---------------+
| Table               | Non_unique | Key_name                        | Seq_in_index | Column_name | Collation | Cardinality | Sub_part | Packed | Null | Index_type | Comment | Index_comment |
+---------------------+------------+---------------------------------+--------------+-------------+-----------+-------------+----------+--------+------+------------+---------+---------------+
| wb_changes_dispatch |          0 | PRIMARY                         |            1 | chd_site    | A         |         577 |     NULL | NULL   |      | BTREE      |         |               |
| wb_changes_dispatch |          1 | wb_changes_dispatch_chd_seen    |            1 | chd_seen    | A         |         455 |     NULL | NULL   |      | BTREE      |         |               |
| wb_changes_dispatch |          1 | wb_changes_dispatch_chd_touched |            1 | chd_touched | A         |         243 |     NULL | NULL   |      | BTREE      |         |               |
+---------------------+------------+---------------------------------+--------------+-------------+-----------+-------------+----------+--------+------+------------+---------+---------------+

Change 466029 had a related patch set uploaded (by Addshore; owner: Addshore):
[mediawiki/extensions/Wikibase@master] SqlChangeDispatchCoordinator further statd tracking

https://gerrit.wikimedia.org/r/466029

Change 466031 had a related patch set uploaded (by Addshore; owner: Addshore):
[mediawiki/extensions/Wikibase@wmf/1.32.0-wmf.24] SqlChangeDispatchCoordinator further statsd tracking

https://gerrit.wikimedia.org/r/466031

Looking at a couple of minutes of extra timing data it looks like this is down to the selectCandidates DB query.
This query must run much faster in codfw.
This is the area hoo was looking at in T205865#4656722

image.png (346×808 px, 26 KB)

		$candidates = $dbr->selectFieldValues(
			$this->stateTable,
			'chd_site',
			$where,
			__METHOD__,
			[
				'ORDER BY' => 'chd_seen ASC',
				'LIMIT' => (int)$this->randomness
			]
		);

These queries are performed on replicas, and would look something like this:

SELECT chd_site FROM wb_changes_dispatch WHERE <<conditions including chd_touched, chd_seen, and chd_disabled>> ORDER BY chd_seen ASC LIMIT 20 /*\Wikibase\Store\Sql\SqlChangeDispatchCoordinator::getCandidateClients*/

The condition would be something like:

WHERE (( chd_touched < '20181010214641' OR ( 1086 - chd_seen ) > 1000) ) AND (chd_seen < 1086) AND (chd_disabled = 0)
  • Part 1, chd_touched < '20181010214641': This will always be now - an interval (currently 25)
  • Part 2, 1086 - chd_seen: This is the max( change_id ) that we select in a different query - chd_seen
  • Part 3, chd_seen < 1086: chd_seen is lower than the max value we selected previously
  • Part 4, chd_disable = 0: This will always be the same

Thanks @Marostegui but this sadly didn't help. Do you have any other ideas what could cause these discrepencies?

wikiadmin@db1109(wikidatawiki)> SELECT * FROM information_schema.tables WHERE table_name = 'wb_changes_dispatch'\G
*************************** 1. row ***************************
  TABLE_CATALOG: def
   TABLE_SCHEMA: wikidatawiki
     TABLE_NAME: wb_changes_dispatch
     TABLE_TYPE: BASE TABLE
         ENGINE: InnoDB
        VERSION: 10
     ROW_FORMAT: Compact
     TABLE_ROWS: 577
 AVG_ROW_LENGTH: 141
    DATA_LENGTH: 81920
MAX_DATA_LENGTH: 0
   INDEX_LENGTH: 4907859968
      DATA_FREE: 7340032
 AUTO_INCREMENT: NULL
    CREATE_TIME: 2018-04-26 09:16:42
    UPDATE_TIME: NULL
     CHECK_TIME: NULL
TABLE_COLLATION: binary
       CHECKSUM: NULL
 CREATE_OPTIONS: 
  TABLE_COMMENT: 
1 row in set (0.00 sec)

wikiadmin@db2083(wikidatawiki)> SELECT * FROM information_schema.tables WHERE table_name = 'wb_changes_dispatch'\G
*************************** 1. row ***************************
  TABLE_CATALOG: def
   TABLE_SCHEMA: wikidatawiki
     TABLE_NAME: wb_changes_dispatch
     TABLE_TYPE: BASE TABLE
         ENGINE: InnoDB
        VERSION: 10
     ROW_FORMAT: Compressed
     TABLE_ROWS: 577
 AVG_ROW_LENGTH: 70
    DATA_LENGTH: 40960
MAX_DATA_LENGTH: 0
   INDEX_LENGTH: 540672
      DATA_FREE: 9961472
 AUTO_INCREMENT: NULL
    CREATE_TIME: 2018-05-31 10:31:11
    UPDATE_TIME: NULL
     CHECK_TIME: NULL
TABLE_COLLATION: binary
       CHECKSUM: NULL
 CREATE_OPTIONS: row_format=COMPRESSED key_block_size=8
  TABLE_COMMENT: 
1 row in set (0.03 sec)

The index length differences look interesting…

That's probably because the table is compressed on db2083 and not compressed on db1109.

db1109 and db2083 run a different version of MariaDB.
db1109 runs 10.1.36
db2083 runs 10.1.33

Could this be a 10.1.36 regression? It wouldn't be surprising. Maybe we are being hit by: https://jira.mariadb.org/browse/MDEV-17155
db1109 is being rebuilt now due to T206743 and it is getting compressed tables, so I will run the query there to see if compression has any effect on this equation.
Once that is done, l'll try to upgrade db2083 to 10.1.36 and see if it gets worse there, which could mean a regression on that version.

@hoo after db1109 has been recloned (and now has compressed tables):

root@db1109.eqiad.wmnet[wikidatawiki]> SELECT COUNT(*) FROM wb_changes_dispatch;
+----------+
| COUNT(*) |
+----------+
|      577 |
+----------+
1 row in set (0.00 sec)

root@db1109.eqiad.wmnet[wikidatawiki]> SELECT  chd_site  FROM wb_changes_dispatch    WHERE (( chd_touched < '20181010214641' OR ( 1086 - chd_seen ) > 1000) ) AND (chd_seen < 1086) AND (chd_disabled = 0)  ORDER BY chd_seen ASC LIMIT 15;
Empty set (0.00 sec)

Which is better than what you were getting at T205865#4656722
Can you re-run your tests?

As some of the pooled hosts has already been reimaged we can already see the production dispatching speeding up.

Below you can see the dispatching switching between slow and fast slaves resulting in a pretty choppy lag graph.

image.png (274×1 px, 52 KB)

Another test with db1104 before and after compressing:

root@db1104.eqiad.wmnet[wikidatawiki]> show create table wb_changes_dispatch\G
*************************** 1. row ***************************
       Table: wb_changes_dispatch
Create Table: CREATE TABLE `wb_changes_dispatch` (
  `chd_site` varbinary(32) NOT NULL,
  `chd_db` varbinary(32) NOT NULL,
  `chd_seen` int(11) NOT NULL DEFAULT '0',
  `chd_touched` varbinary(14) NOT NULL DEFAULT '00000000000000',
  `chd_lock` varbinary(64) DEFAULT NULL,
  `chd_disabled` tinyint(3) unsigned NOT NULL DEFAULT '0',
  PRIMARY KEY (`chd_site`),
  KEY `wb_changes_dispatch_chd_seen` (`chd_seen`),
  KEY `wb_changes_dispatch_chd_touched` (`chd_touched`)
) ENGINE=InnoDB DEFAULT CHARSET=binary
1 row in set (0.00 sec)

root@db1104.eqiad.wmnet[wikidatawiki]> SELECT COUNT(*) FROM wb_changes_dispatch;
+----------+
| COUNT(*) |
+----------+
|      577 |
+----------+
1 row in set (0.98 sec)

root@db1104.eqiad.wmnet[wikidatawiki]> SELECT  chd_site  FROM wb_changes_dispatch    WHERE (( chd_touched < '20181010214641' OR ( 1086 - chd_seen ) > 1000) ) AND (chd_seen < 1086) AND (chd_disabled = 0)  ORDER BY chd_seen ASC LIMIT 15;
Empty set (0.99 sec)


root@db1104.eqiad.wmnet[wikidatawiki]> alter table wb_changes_dispatch ROW_FORMAT=COMPRESSED KEY_BLOCK_SIZE=8;
Query OK, 0 rows affected (4.66 sec)
Records: 0  Duplicates: 0  Warnings: 0

root@db1104.eqiad.wmnet[wikidatawiki]> show create table wb_changes_dispatch\G
*************************** 1. row ***************************
       Table: wb_changes_dispatch
Create Table: CREATE TABLE `wb_changes_dispatch` (
  `chd_site` varbinary(32) NOT NULL,
  `chd_db` varbinary(32) NOT NULL,
  `chd_seen` int(11) NOT NULL DEFAULT '0',
  `chd_touched` varbinary(14) NOT NULL DEFAULT '00000000000000',
  `chd_lock` varbinary(64) DEFAULT NULL,
  `chd_disabled` tinyint(3) unsigned NOT NULL DEFAULT '0',
  PRIMARY KEY (`chd_site`),
  KEY `wb_changes_dispatch_chd_seen` (`chd_seen`),
  KEY `wb_changes_dispatch_chd_touched` (`chd_touched`)
) ENGINE=InnoDB DEFAULT CHARSET=binary ROW_FORMAT=COMPRESSED KEY_BLOCK_SIZE=8
1 row in set (0.00 sec)

root@db1104.eqiad.wmnet[wikidatawiki]> SELECT COUNT(*) FROM wb_changes_dispatch;
+----------+
| COUNT(*) |
+----------+
|      577 |
+----------+
1 row in set (0.01 sec)

root@db1104.eqiad.wmnet[wikidatawiki]> SELECT  chd_site  FROM wb_changes_dispatch    WHERE (( chd_touched < '20181010214641' OR ( 1086 - chd_seen ) > 1000) ) AND (chd_seen < 1086) AND (chd_disabled = 0)  ORDER BY chd_seen ASC LIMIT 15;
Empty set (0.00 sec)

Change 466031 abandoned by Addshore:
SqlChangeDispatchCoordinator further statsd tracking

Reason:
Given we solved the issue, lets not bother adding this.

https://gerrit.wikimedia.org/r/466031

Change 466029 abandoned by Addshore:
SqlChangeDispatchCoordinator further statsd tracking

Reason:
Given we solved the issue, lets not bother adding this.

https://gerrit.wikimedia.org/r/466029

All the pooled replicas have now compressed tables, can you confirm from your end if this is good?

Addshore claimed this task.
Addshore added a project: Wikidata-Campsite.

All looks good to me! :)

I'm going to mark this as resolved.

T207006 is the followup to make sure this happens on all wikibases! :)