There is a mismatch between replication lag that is being reported by MariaDB tooling and MW tooling. One possible cause of this is that MW tooling takes into account so-called bogus GTIDs which are materialised in a variety of ways (e.g. maintenance work on a server in the non-master DC). In order to mitigate that, we should implement the logic to filter out the bogus IDs.
Description
Description
Details
Details
Customize query in gerrit
| Status | Subtype | Assigned | Task | ||
|---|---|---|---|---|---|
| Resolved | aaron | T88445 MediaWiki active/active datacenter investigation and work (tracking) | |||
| Declined | aaron | T221159 FY18/19 TEC1.6 Q4: Improve or replace the usage of GTID_WAIT with pt-heartbeat in MW | |||
| Resolved | aaron | T224422 Implement logic to filter bogus GTIDs |
Event Timeline
Comment Actions
Change 517778 had a related patch set uploaded (by Aaron Schulz; owner: Aaron Schulz):
[mediawiki/core@master] rdbms: add ILoadBalancer::getReplicaResumePos method
Comment Actions
Change 517830 had a related patch set uploaded (by Aaron Schulz; owner: Aaron Schulz):
[mediawiki/core@master] rdbms: fix active GTID filtering in DatabaseMysqlBase
Comment Actions
Change 517778 merged by jenkins-bot:
[mediawiki/core@master] rdbms: add ILoadBalancer::getReplicaResumePos method
Comment Actions
Change 517830 merged by jenkins-bot:
[mediawiki/core@master] rdbms: fix active GTID filtering in DatabaseMysqlBase
Comment Actions
I have been taking a look at the comment on the patch, maybe it is easier to follow up here.
By checking the most recent error, which is:
db_server	   	10.64.0.96
 sql	   	SELECT MASTER_GTID_WAIT('171978924-171978924-268029771', 1)
normalized_message	   	Timed out waiting for replication to reach 171970645-171970645-288070551,171978778-171978778-3298185533,171978924-171978924-268029771,180359242-180359242-170963125
So 171978924 is db1109 (current s8 master), and the server that erroed was db1126 (s8 slave) so that makes sense.
However 171970645 is db1104 (old s8 master), 171978778 isn't a current host, but the IP is 10.64.48.26 which correlates to the old decommissioned s8 master (https://gerrit.wikimedia.org/r/#/c/operations/dns/+/540765/1/templates/wmnet).
So there is definitely something going on there - it shouldn't be looking for old those masters, only 171978924 would make sense.
Comment Actions
So this is my proposal- GTID get "infected" from the master, but they were able to be at least cleared. I want to depool a host where this happens a lot, db1121, remove its gtids, reconnect it to master and see if this continues happening (I was able to reproduce it on db1121 with the current gtid pos). The rationale is that for gtid positions not waited, it waits on some existing only on a replica but not on the new master. Thoughts?
Comment Actions
+1
I remember having to manually delete GTIDs from the mysql tables when troubleshooting the issue with gtid_domain_id on multisource hosts as reset slave all wouldn't get those cleaned up - not sure if it would still be the case after MariaDB fixed that bug. If you manage to get them totally cleaned up, please paste here the procedure so we can document it :-)
Also, I would wait for tomorrow before depooling a host, as we have many depooled now for the PDU maintenance (or wait until the PDU maintenance is done, which I would expect it to be finished by 12 or 13 UTC)
Comment Actions
I checked db1084 execution and local execution seem to work as intended:
root@db1084[(none)]> SELECT MASTER_POS_WAIT('db1138-bin.000467', 303912456, 1);
+----------------------------------------------------+
| MASTER_POS_WAIT('db1138-bin.000467', 303912456, 1) |
+----------------------------------------------------+
|                                               NULL |
+----------------------------------------------------+
1 row in set (0.00 sec)

root@db1084[(none)]> SELECT MASTER_GTID_WAIT('0-180359175-3368394787,171978876-171978876-109300035,171966557-171966557-578966402,180359190-180359190-192195477,171978775-171978775-4822899280,180359175-180359175-43143523,171970589-171970589-201132050', 1);
+-----------------------------------------------------------------------------------------------------------------------------------------------------------------------------------------------------------------------------------+
| MASTER_GTID_WAIT('0-180359175-3368394787,171978876-171978876-109300035,171966557-171966557-578966402,180359190-180359190-192195477,171978775-171978775-4822899280,180359175-180359175-43143523,171970589-171970589-201132050', 1) |
+-----------------------------------------------------------------------------------------------------------------------------------------------------------------------------------------------------------------------------------+
|                                                                                                                                                                                                                                -1 |
+-----------------------------------------------------------------------------------------------------------------------------------------------------------------------------------------------------------------------------------+
1 row in set (1.00 sec)

root@db1084[(none)]> show global variables like 'gtid%';
+------------------------+------------------------------------------------------------------------------------------------------------------------------------------------------------------------------------------------------------+
| Variable_name          | Value                                                                                                                                                                                                      |
+------------------------+------------------------------------------------------------------------------------------------------------------------------------------------------------------------------------------------------------+
| gtid_binlog_pos        | 171978876-171978876-108546562                                                                                                                                                                              |
| gtid_binlog_state      | 171978876-171978876-108546562                                                                                                                                                                              |
| gtid_current_pos       | 0-180359175-3368394787,171966557-171966557-578966402,171970589-171970589-201132050,171978775-171978775-4822899280,171978876-171978876-108546562,180359175-180359175-43143523,180359190-180359190-192195477 |
| gtid_domain_id         | 171970662                                                                                                                                                                                                  |
| gtid_ignore_duplicates | OFF                                                                                                                                                                                                        |
| gtid_slave_pos         | 0-180359175-3368394787,171966557-171966557-578966402,171970589-171970589-201132050,171978775-171978775-4822899280,171978876-171978876-108546562,180359175-180359175-43143523,180359190-180359190-192195477 |
| gtid_strict_mode       | OFF                                                                                                                                                                                                        |
+------------------------+------------------------------------------------------------------------------------------------------------------------------------------------------------------------------------------------------------+
7 rows in set (0.00 sec)

root@db1084[(none)]> SELECT MASTER_GTID_WAIT('171978876-171978876-108546562', 1);
+------------------------------------------------------+
| MASTER_GTID_WAIT('171978876-171978876-108546562', 1) |
+------------------------------------------------------+
|                                                    0 |
+------------------------------------------------------+
1 row in set (0.00 sec)

root@db1084[(none)]> SELECT MASTER_GTID_WAIT('171978876-171978876-100850438', 1);
+------------------------------------------------------+
| MASTER_GTID_WAIT('171978876-171978876-100850438', 1) |
+------------------------------------------------------+
|                                                    0 |
+------------------------------------------------------+
1 row in set (0.00 sec)

root@db1084[(none)]> SELECT MASTER_GTID_WAIT('171978876-171978876-108546562', 1);
+------------------------------------------------------+
| MASTER_GTID_WAIT('171978876-171978876-108546562', 1) |
+------------------------------------------------------+
|                                                    0 |
+------------------------------------------------------+
1 row in set (0.00 sec)

root@db1084[(none)]> SELECT MASTER_GTID_WAIT('171978876-171978876-108546563', 1);
+------------------------------------------------------+
| MASTER_GTID_WAIT('171978876-171978876-108546563', 1) |
+------------------------------------------------------+
|                                                   -1 |
+------------------------------------------------------+
However, I just noticed that while manuel log is rational, other logs on db1084 are not:
normalized_message:
Timed out waiting for replication to reach 171966557-171966557-578966402,171978775-171978775-4822899280,171978876-171978876-100850438
Query:
SELECT MASTER_GTID_WAIT('171978876-171978876-100850438', 1)
I thought the logs and query where missaligned, but assuming the log is before filtering and the query is after filtering, it is working as inteded. But we still have a large number of errors, are we waiting on the right position? Do we have lag > 1s on so many servers?
Comment Actions
I think I need more metrics (e.g. percentage of executions of chronology protector vs. successful executions) because either this didn't work, its measurements are not accurate for what we really want to measure, or it worked and displayed worse lag issues than we thought.
Comment Actions
So this is the latest news:
On T234948 we found that special page updates can lead to a constant 1-2 seconds of lag for the confluence of large long running query with heavy load from the many s8 edits + ongoing wikibase refactoring. Because the timeout is only 1 second, this means chronology protector will fail frequently. However, because we allow pooling for I think a limit of 5 seconds, the host is not depooled. Also, some jobs probably use the "slow" replica and try to use chronology protector, which leads to lots of errors. Obviously, increasing the timeout cannot be done lightly, as it could cause worse problems.
The good news is that I believe this was deployed successfully and works as intended. The bad news is that there is a weakness on our infrastructure, but I am not sure how to move forward, need suggestions. We can open discussion on another ticket, as this scope seems solved.
Comment Actions
Indeed the logging is based on the *whole* raw unfiltered position...I should add a logstash key for the filtered one too.
Comment Actions
Change 542268 had a related patch set uploaded (by Aaron Schulz; owner: Aaron Schulz):
[mediawiki/core@master] rdbms: make DatabaseMysqlBase::masterPosWait() logging clearer about GTID filtering
Comment Actions
Change 542268 merged by jenkins-bot:
[mediawiki/core@master] rdbms: make DatabaseMysqlBase::masterPosWait() logging clearer about GTID filtering
Comment Actions
This same issue happened today (same host - db1087) and will most likely keep happening as the updateSpecialPages.php script runs heavy queries)
Comment Actions
I apologize for assuming gtid changes were to blame- in my defense logging was confusing to me. On the bad news side, I believe there is still some underlying issue showing "fake" lag/creating extra waits, due to some kind of contention on the mysql or application layer. Right now this is most visible on the job queue, so not sure timeout is the right way to go, it could be just some concurrency configuration to "smooth" mysql queries/connections, or maybe some migration or other ongoing issue (e.g. could be a fallout of the application server latency issue we have observed in the past).
Sadly I have not yet been able to pinpoint a sure cause. :-(
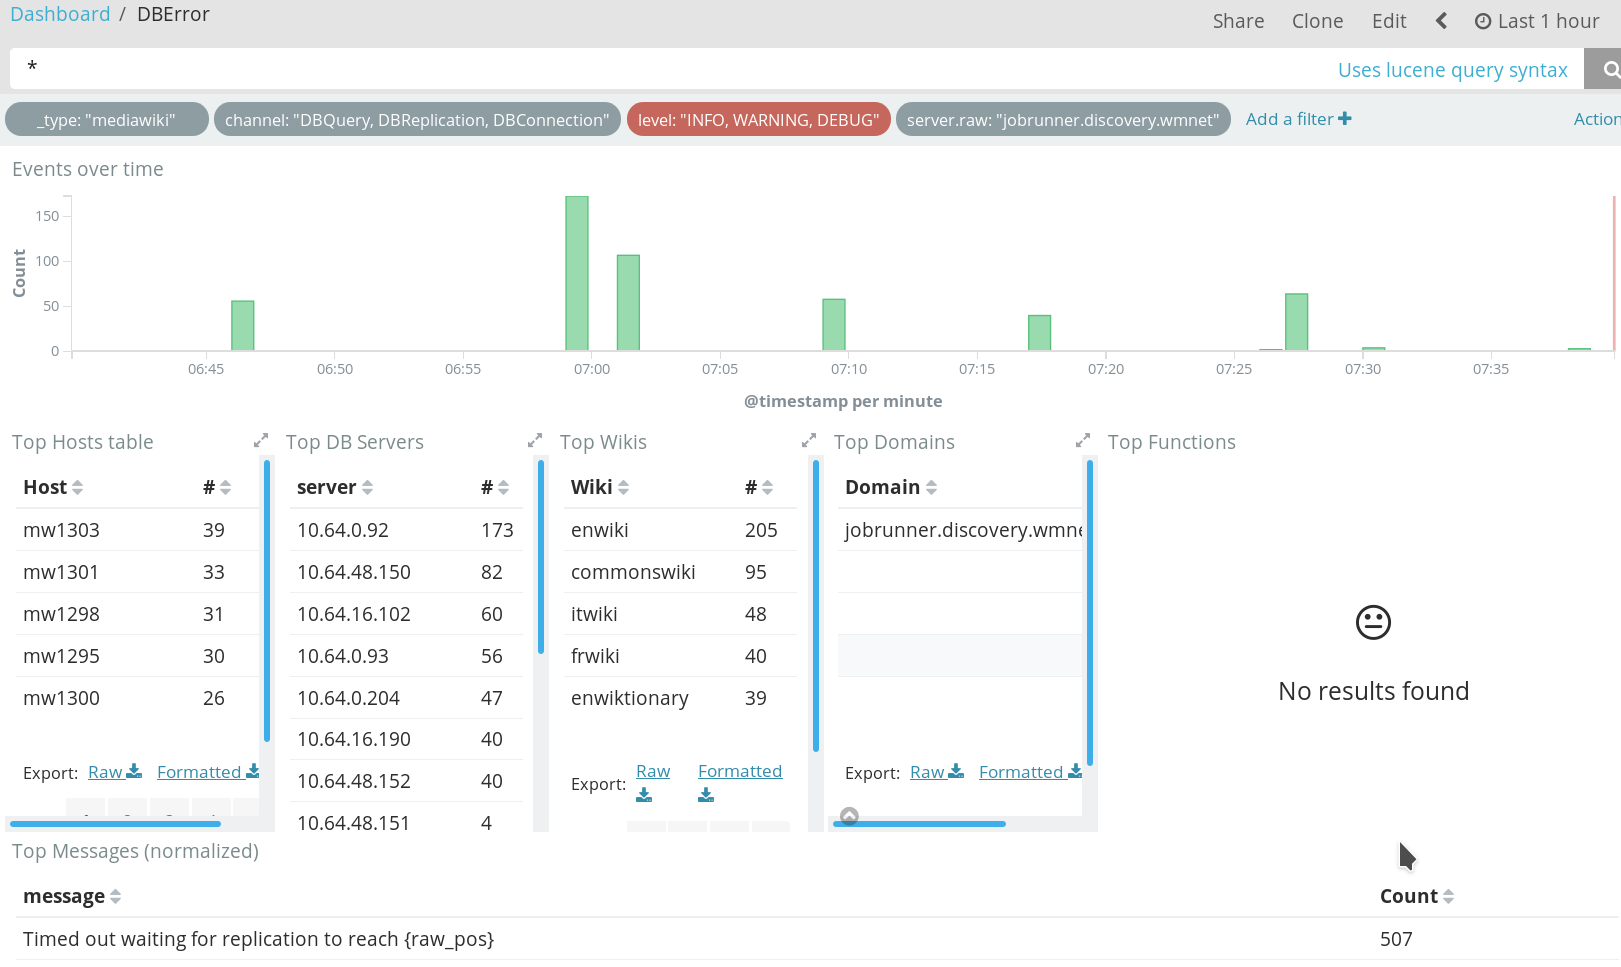
This is what I mean: