On multiple cache nodes, but more so on text@esams/eqsin than others, we get frequent errors from varnishmtail. The errors are repeated occurrences of:
Oct 19 05:23:03 cp3062 varnishmtail[15013]: Log overrun
Oct 19 05:23:03 cp3062 varnishmtail[15013]: Log reacquired
The situation is at times so bad that varnishmtail crashes altogether:
Oct 19 05:57:19 cp3062 varnishmtail[15013]: Assert error in vtx_append(), vsl_dispatch.c line 457:
Oct 19 05:57:19 cp3062 varnishmtail[15013]:   Condition(i != vsl_check_e_inval) not true.
Oct 19 05:57:20 cp3062 varnishmtail[15013]: varnishncsa seems to have crashed, exiting
Oct 19 05:57:20 cp3062 systemd[1]: varnishmtail.service: Main process exited, code=exited, status=1/FAILURE
Oct 19 05:57:20 cp3062 systemd[1]: varnishmtail.service: Failed with result 'exit-code'.
Oct 19 05:57:20 cp3062 systemd[1]: varnishmtail.service: Consumed 7h 40min 57.670s CPU time.
Oct 19 05:57:20 cp3062 systemd[1]: varnishmtail.service: Service RestartSec=100ms expired, scheduling restart.
Oct 19 05:57:20 cp3062 systemd[1]: varnishmtail.service: Scheduled restart job, restart counter is at 6928.
Oct 19 05:57:20 cp3062 systemd[1]: Stopped Varnish mtail.
Oct 19 05:57:20 cp3062 systemd[1]: varnishmtail.service: Consumed 7h 40min 57.670s CPU time.
Oct 19 05:57:20 cp3062 systemd[1]: Started Varnish mtail.
Varnishmtail is nothing more than varnishncsa | mtail, so a likely cause for this issue is that mtail is not able to process the input coming from varnishncsa fast enough.
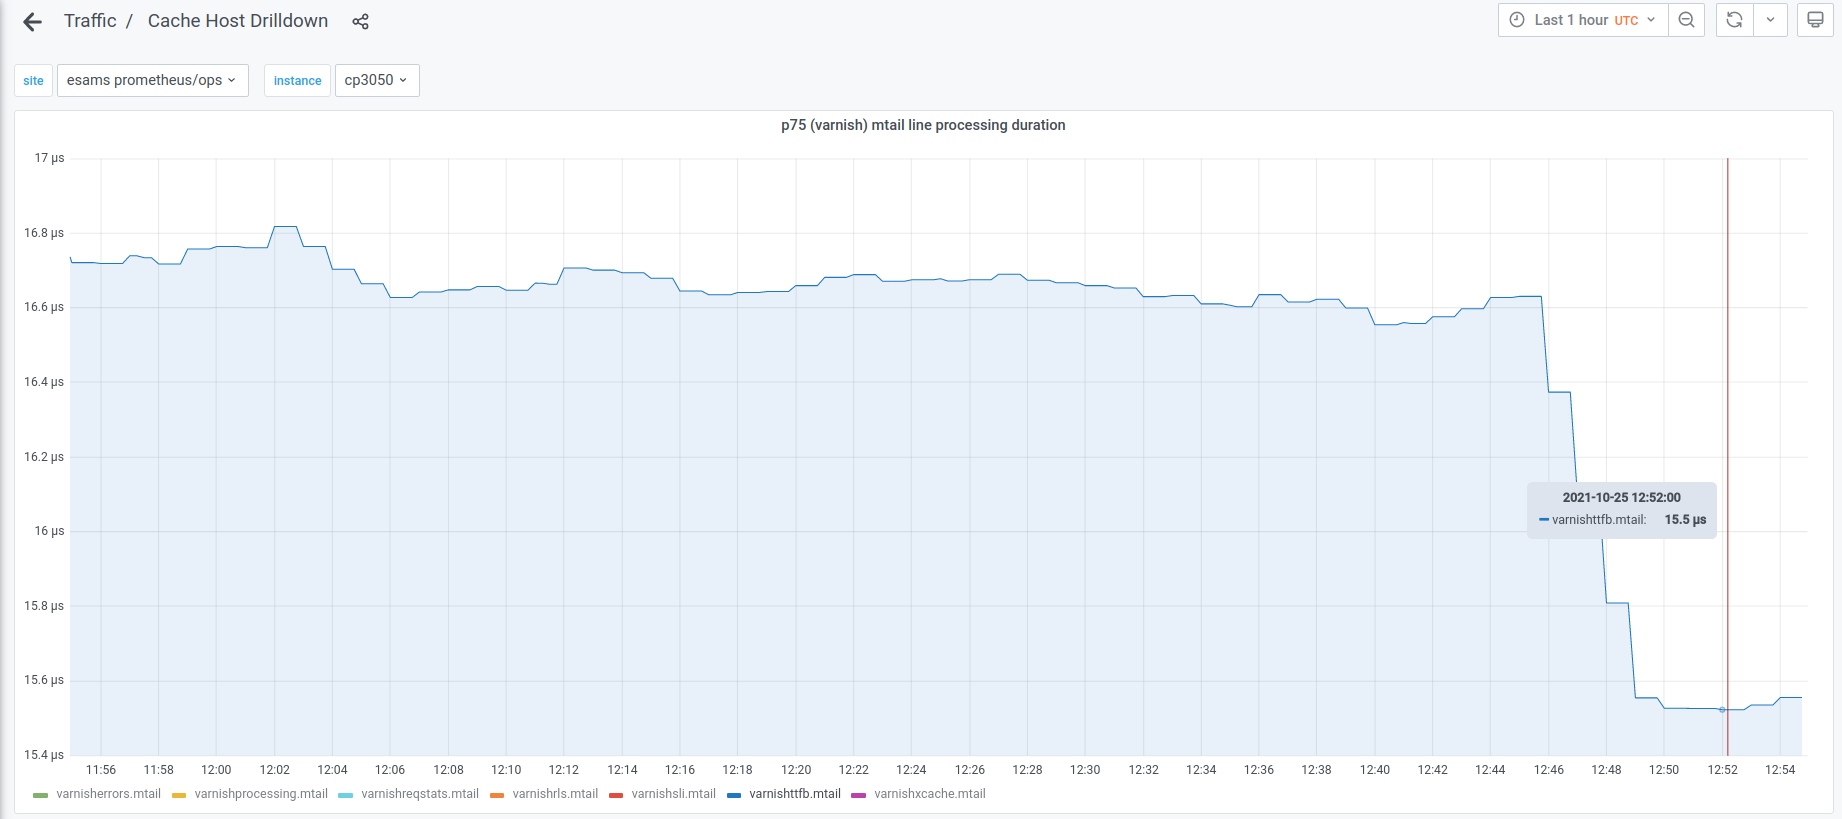
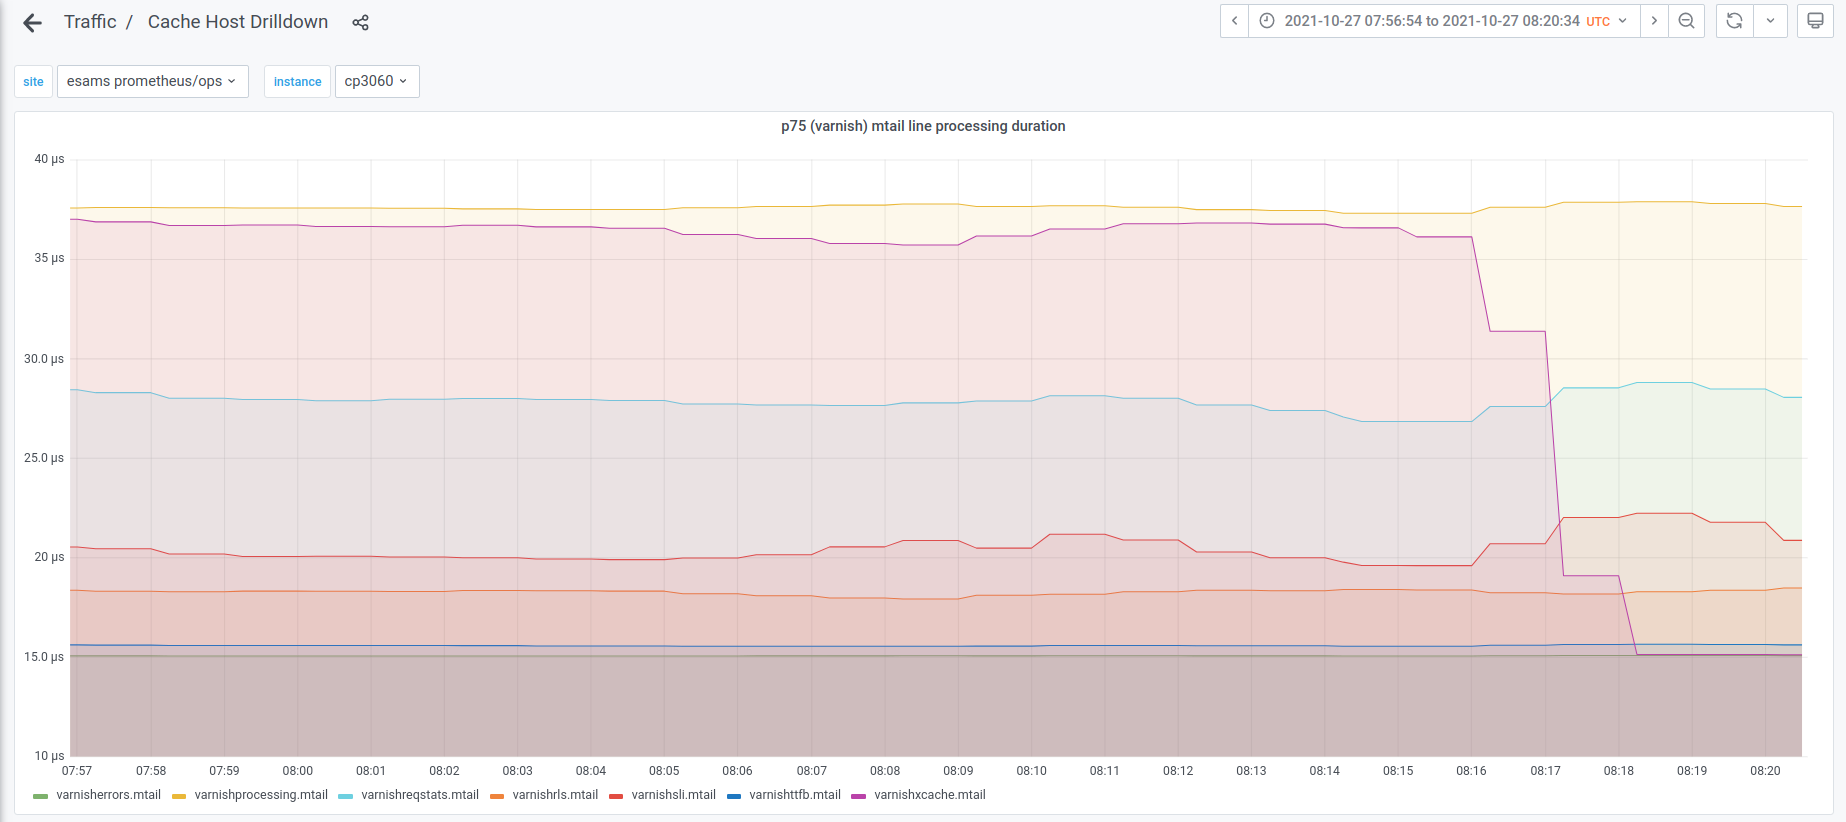
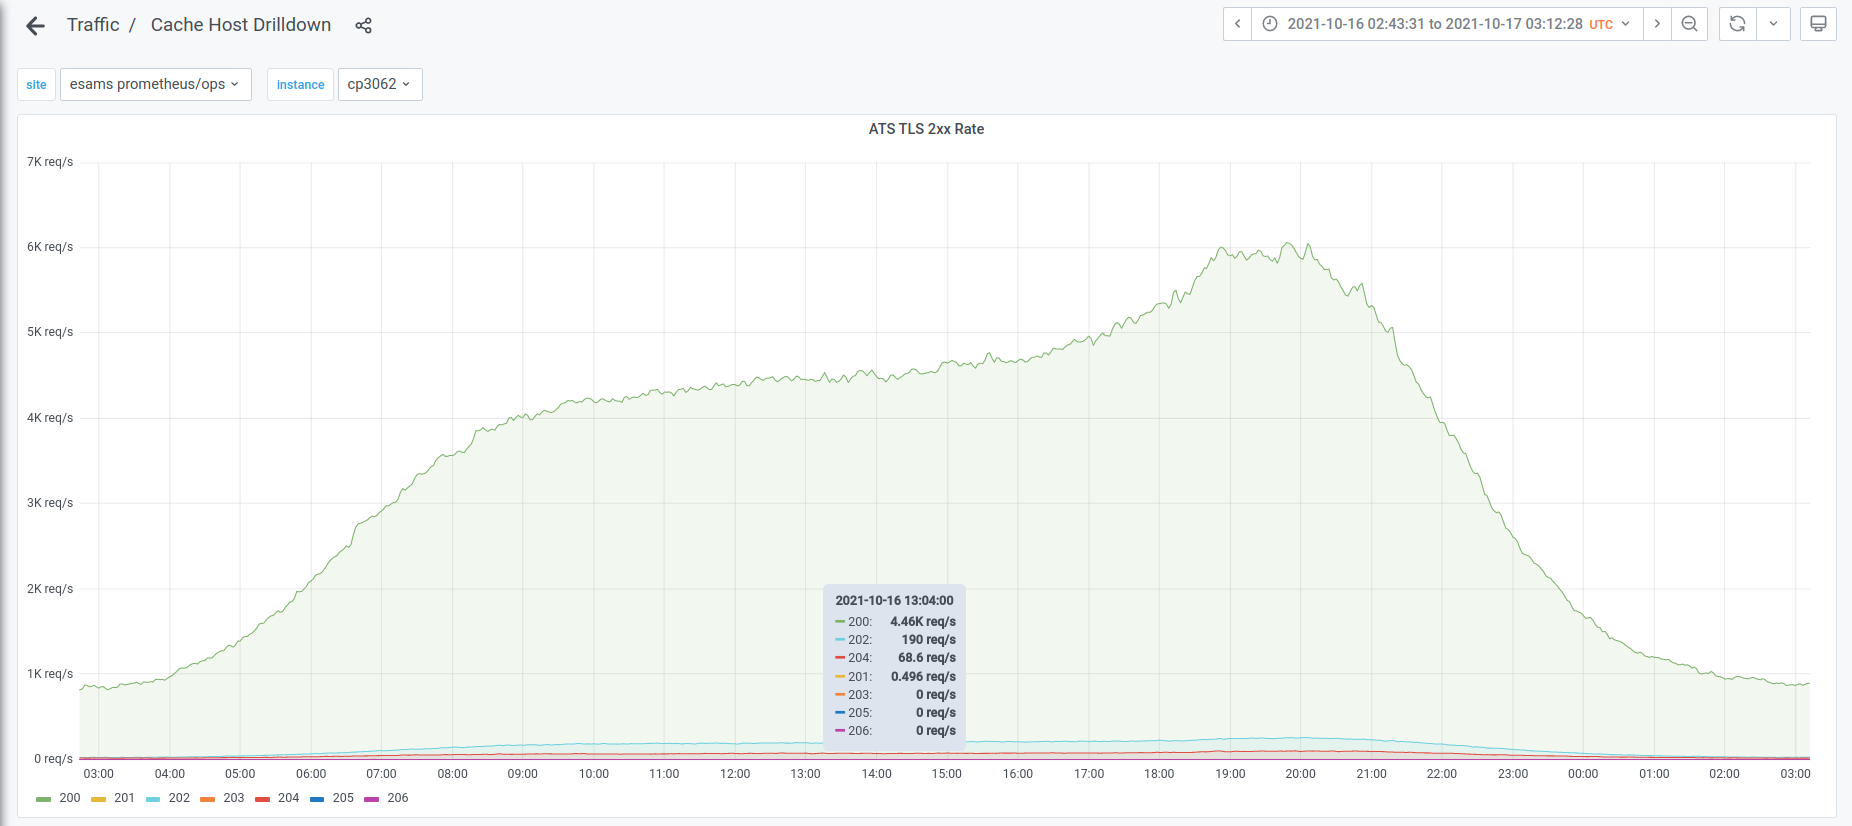
As a consequence, most of the varnish metrics produced by varnishmtail are skewed. Compare the view on 200 responses from ats-tls and varnish:

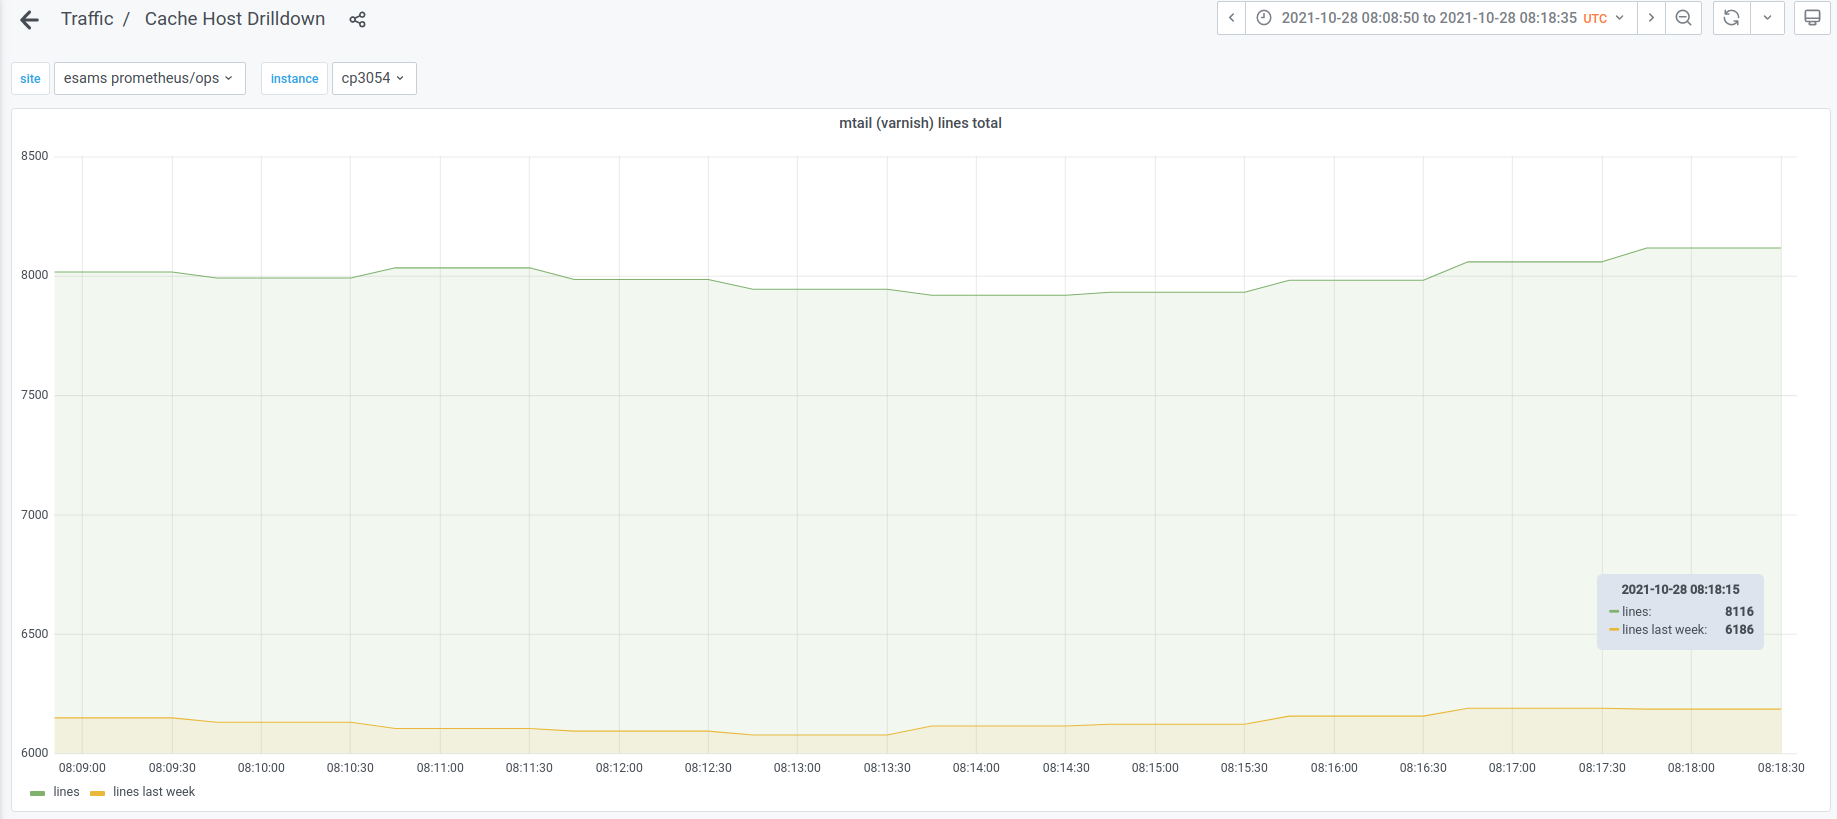
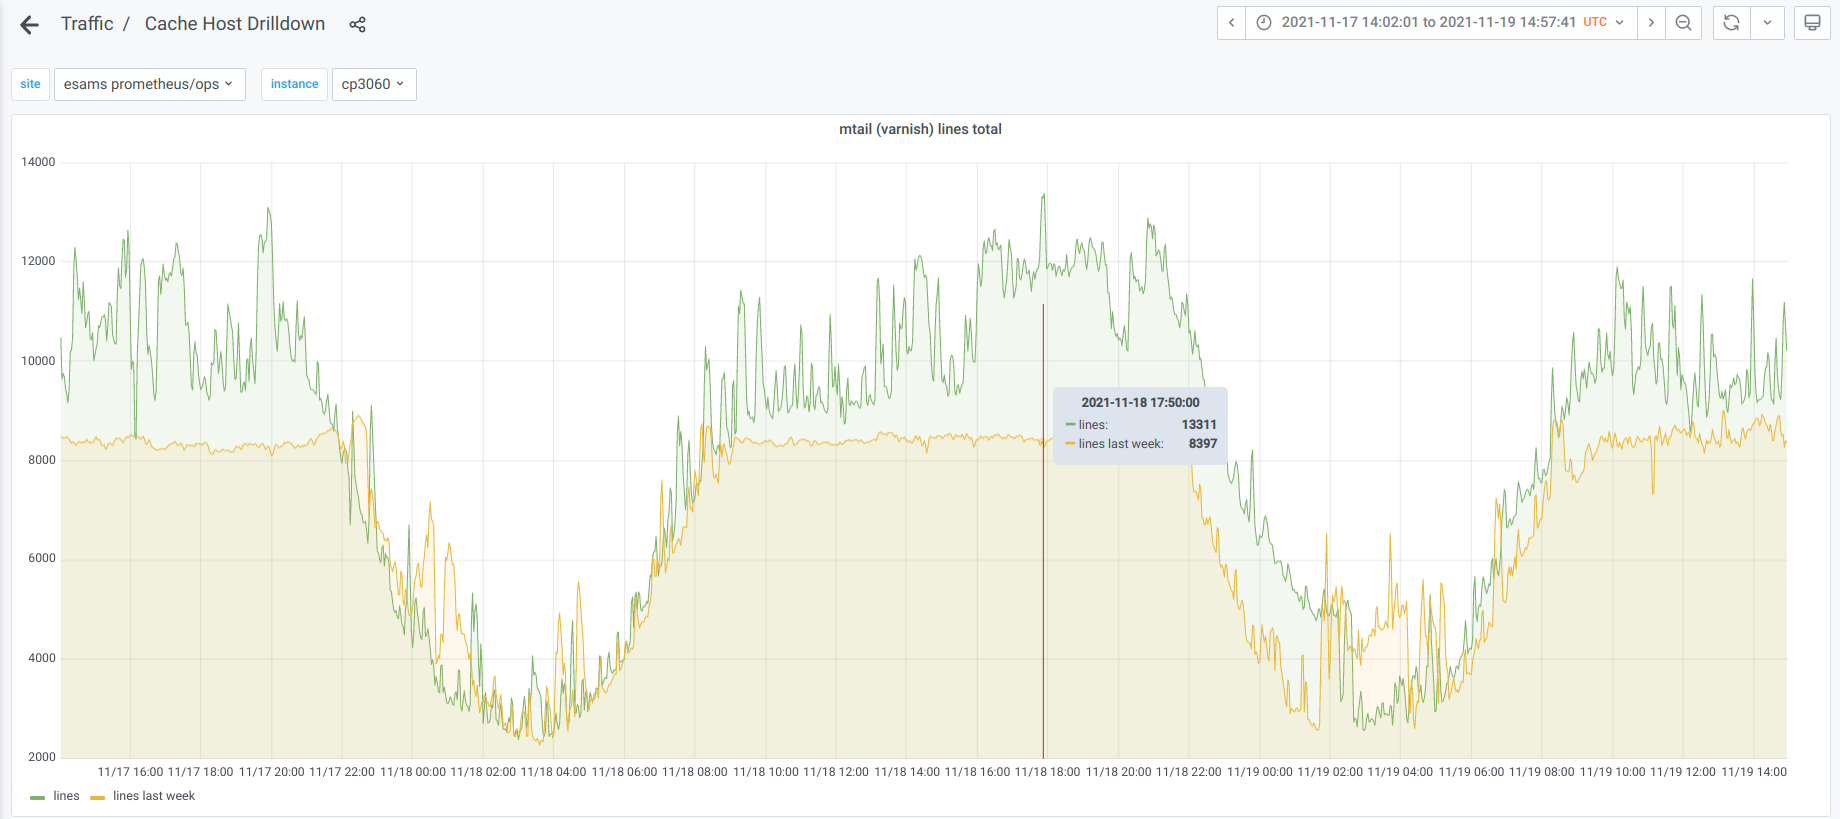
The overruns happen pretty uniformly throughout the week:
11:51:07 ema@cp3062.esams.wmnet:~
$ sudo journalctl -u varnishmtail.service --since '1 week ago' | awk '/overrun/ {print $1, $2}' | uniq -c
  15051 Oct 13
  22299 Oct 14
  20593 Oct 15
  16158 Oct 16
  17279 Oct 17
  19051 Oct 18
  19804 Oct 19
And so do the crashes:
11:51:18 ema@cp3062.esams.wmnet:~
$ sudo journalctl -u varnishmtail.service --since '1 week ago' | awk '/vsl_check_e_inval/ {print $1, $2}' | uniq -c
     95 Oct 13
    128 Oct 14
    121 Oct 15
     94 Oct 16
     95 Oct 17
    110 Oct 18
    107 Oct 19
There is a direct correlation between varnishmtail crashes and metric dips in the graphs, as one would expect.
The VarnishTrafficDrop alert is affected by this issue, as well as dashboards used regularly such as frontend-traffic, varnish-caching, and others.
Upstream PRs 3451 and 3468 may be of interest. See T151643 for a problem with the same symptoms but different circumstances tackled in the past.
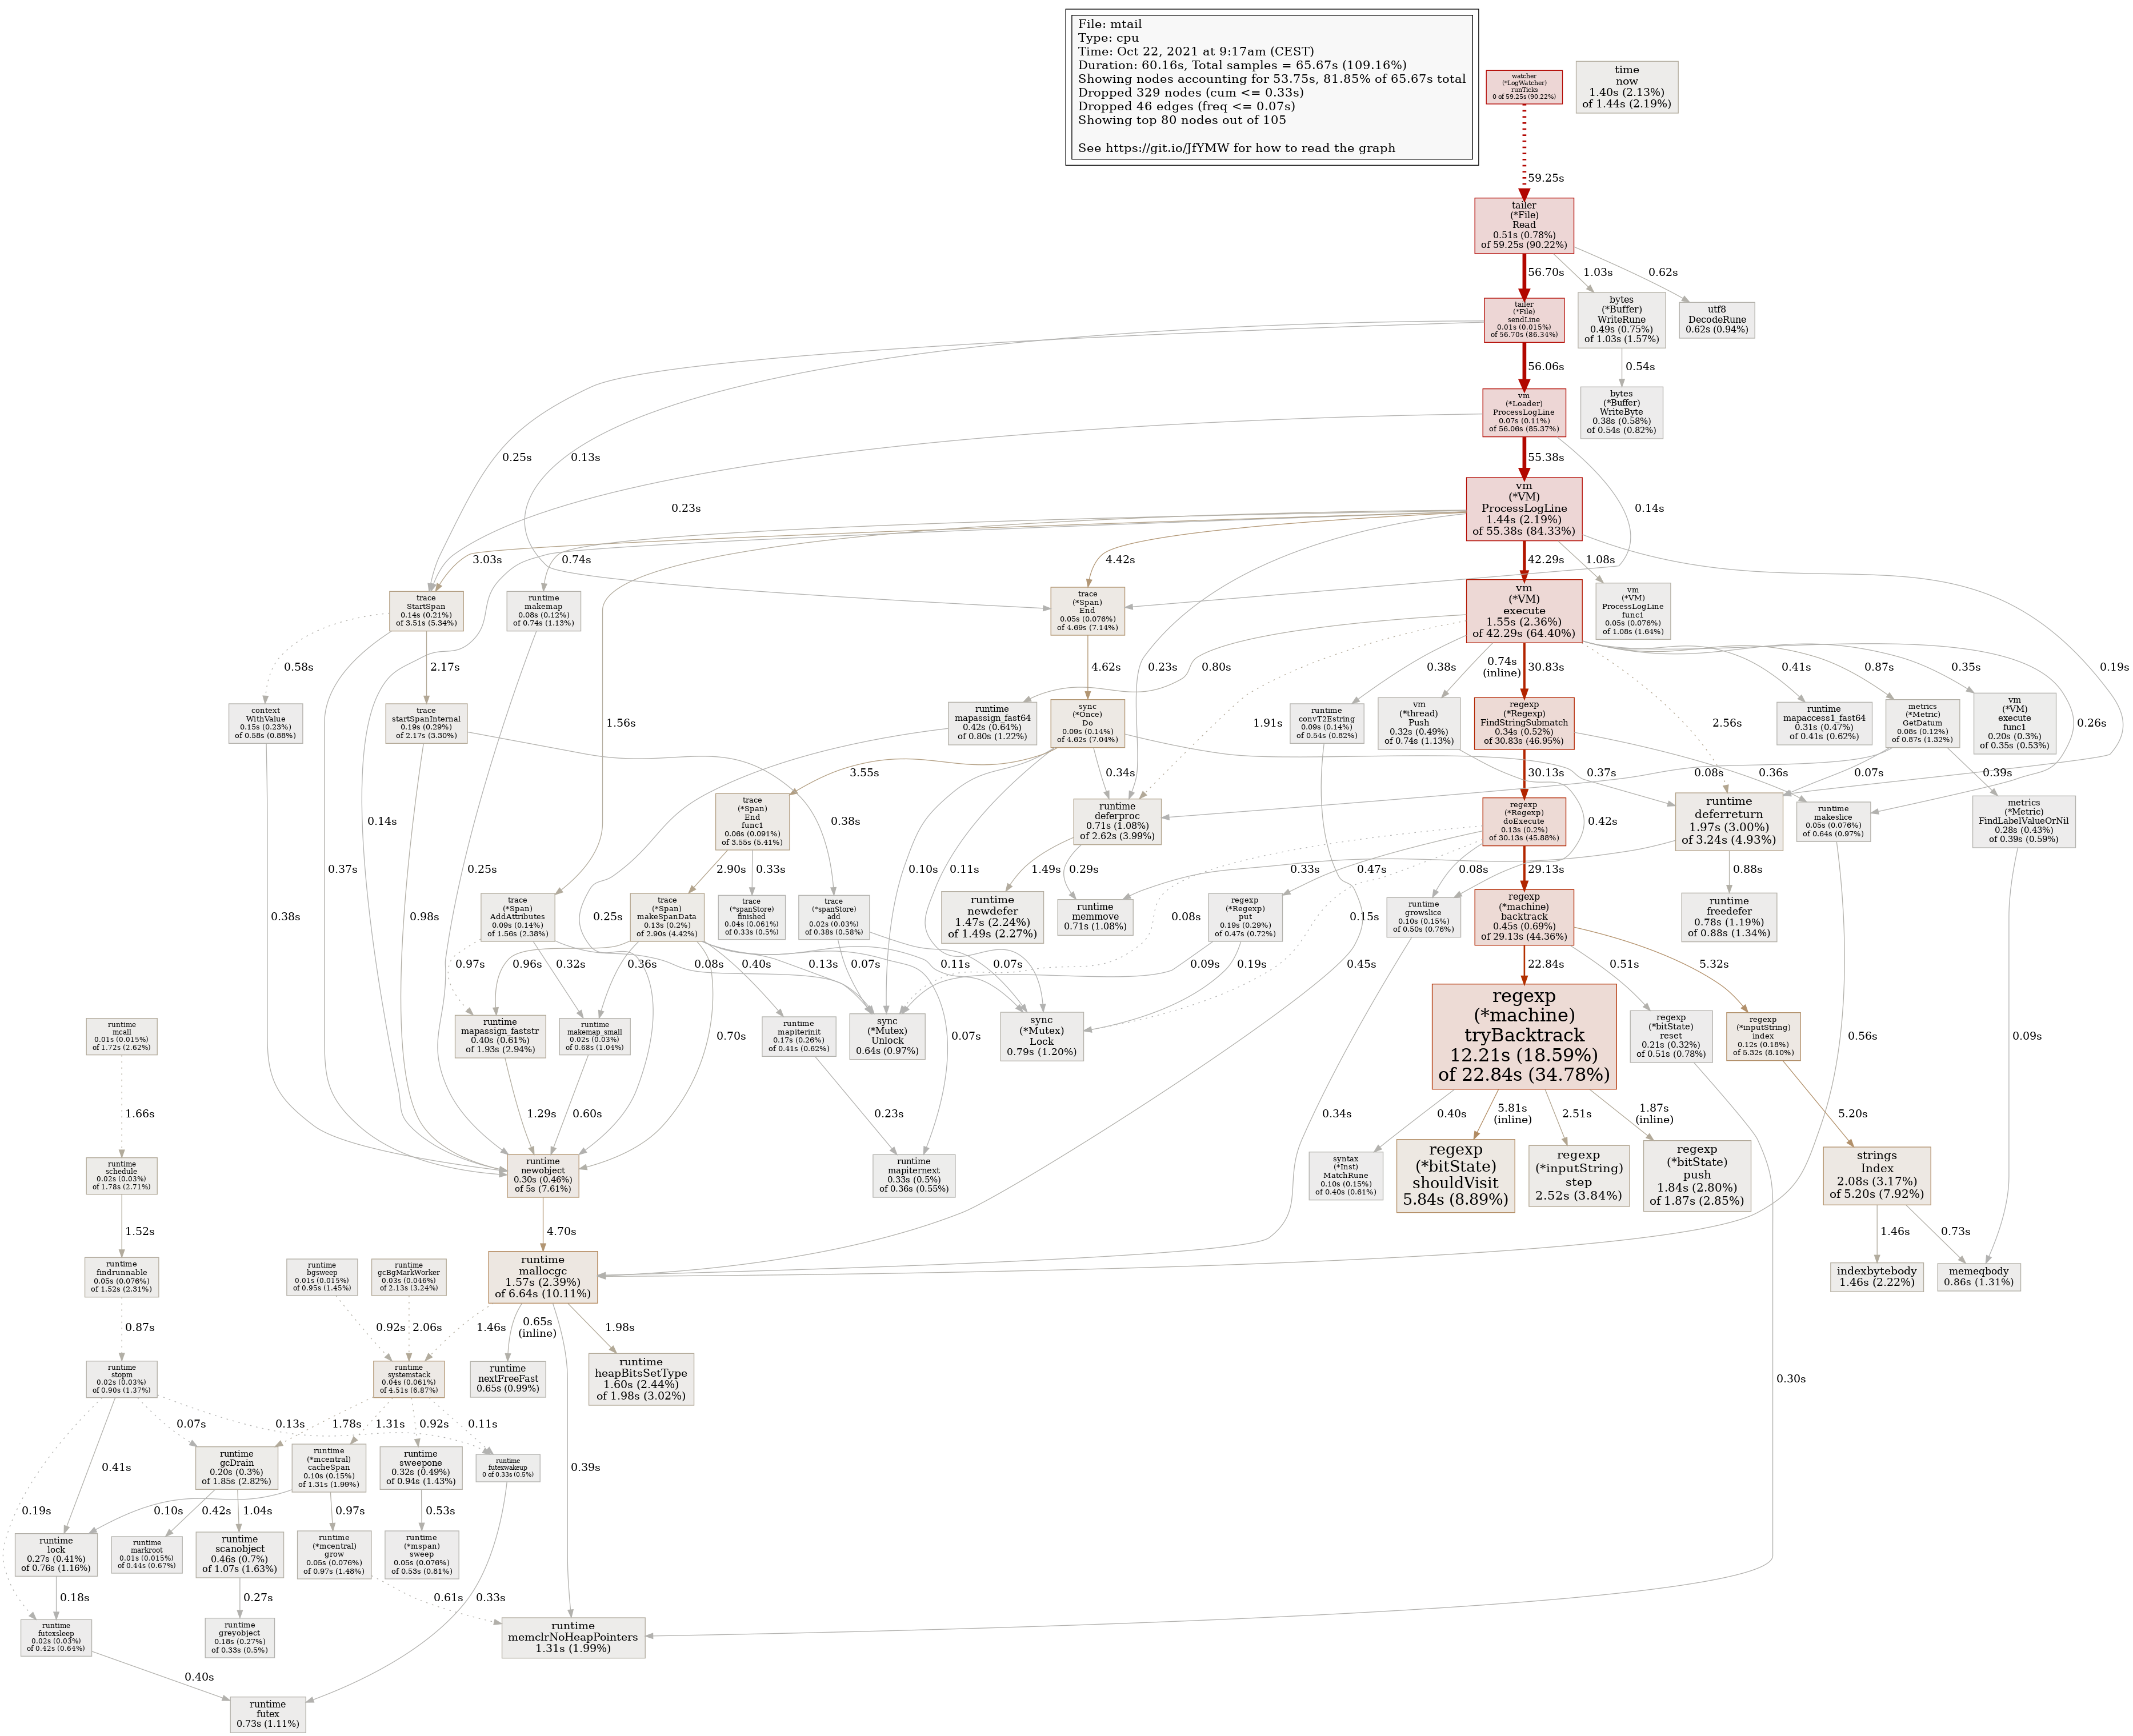
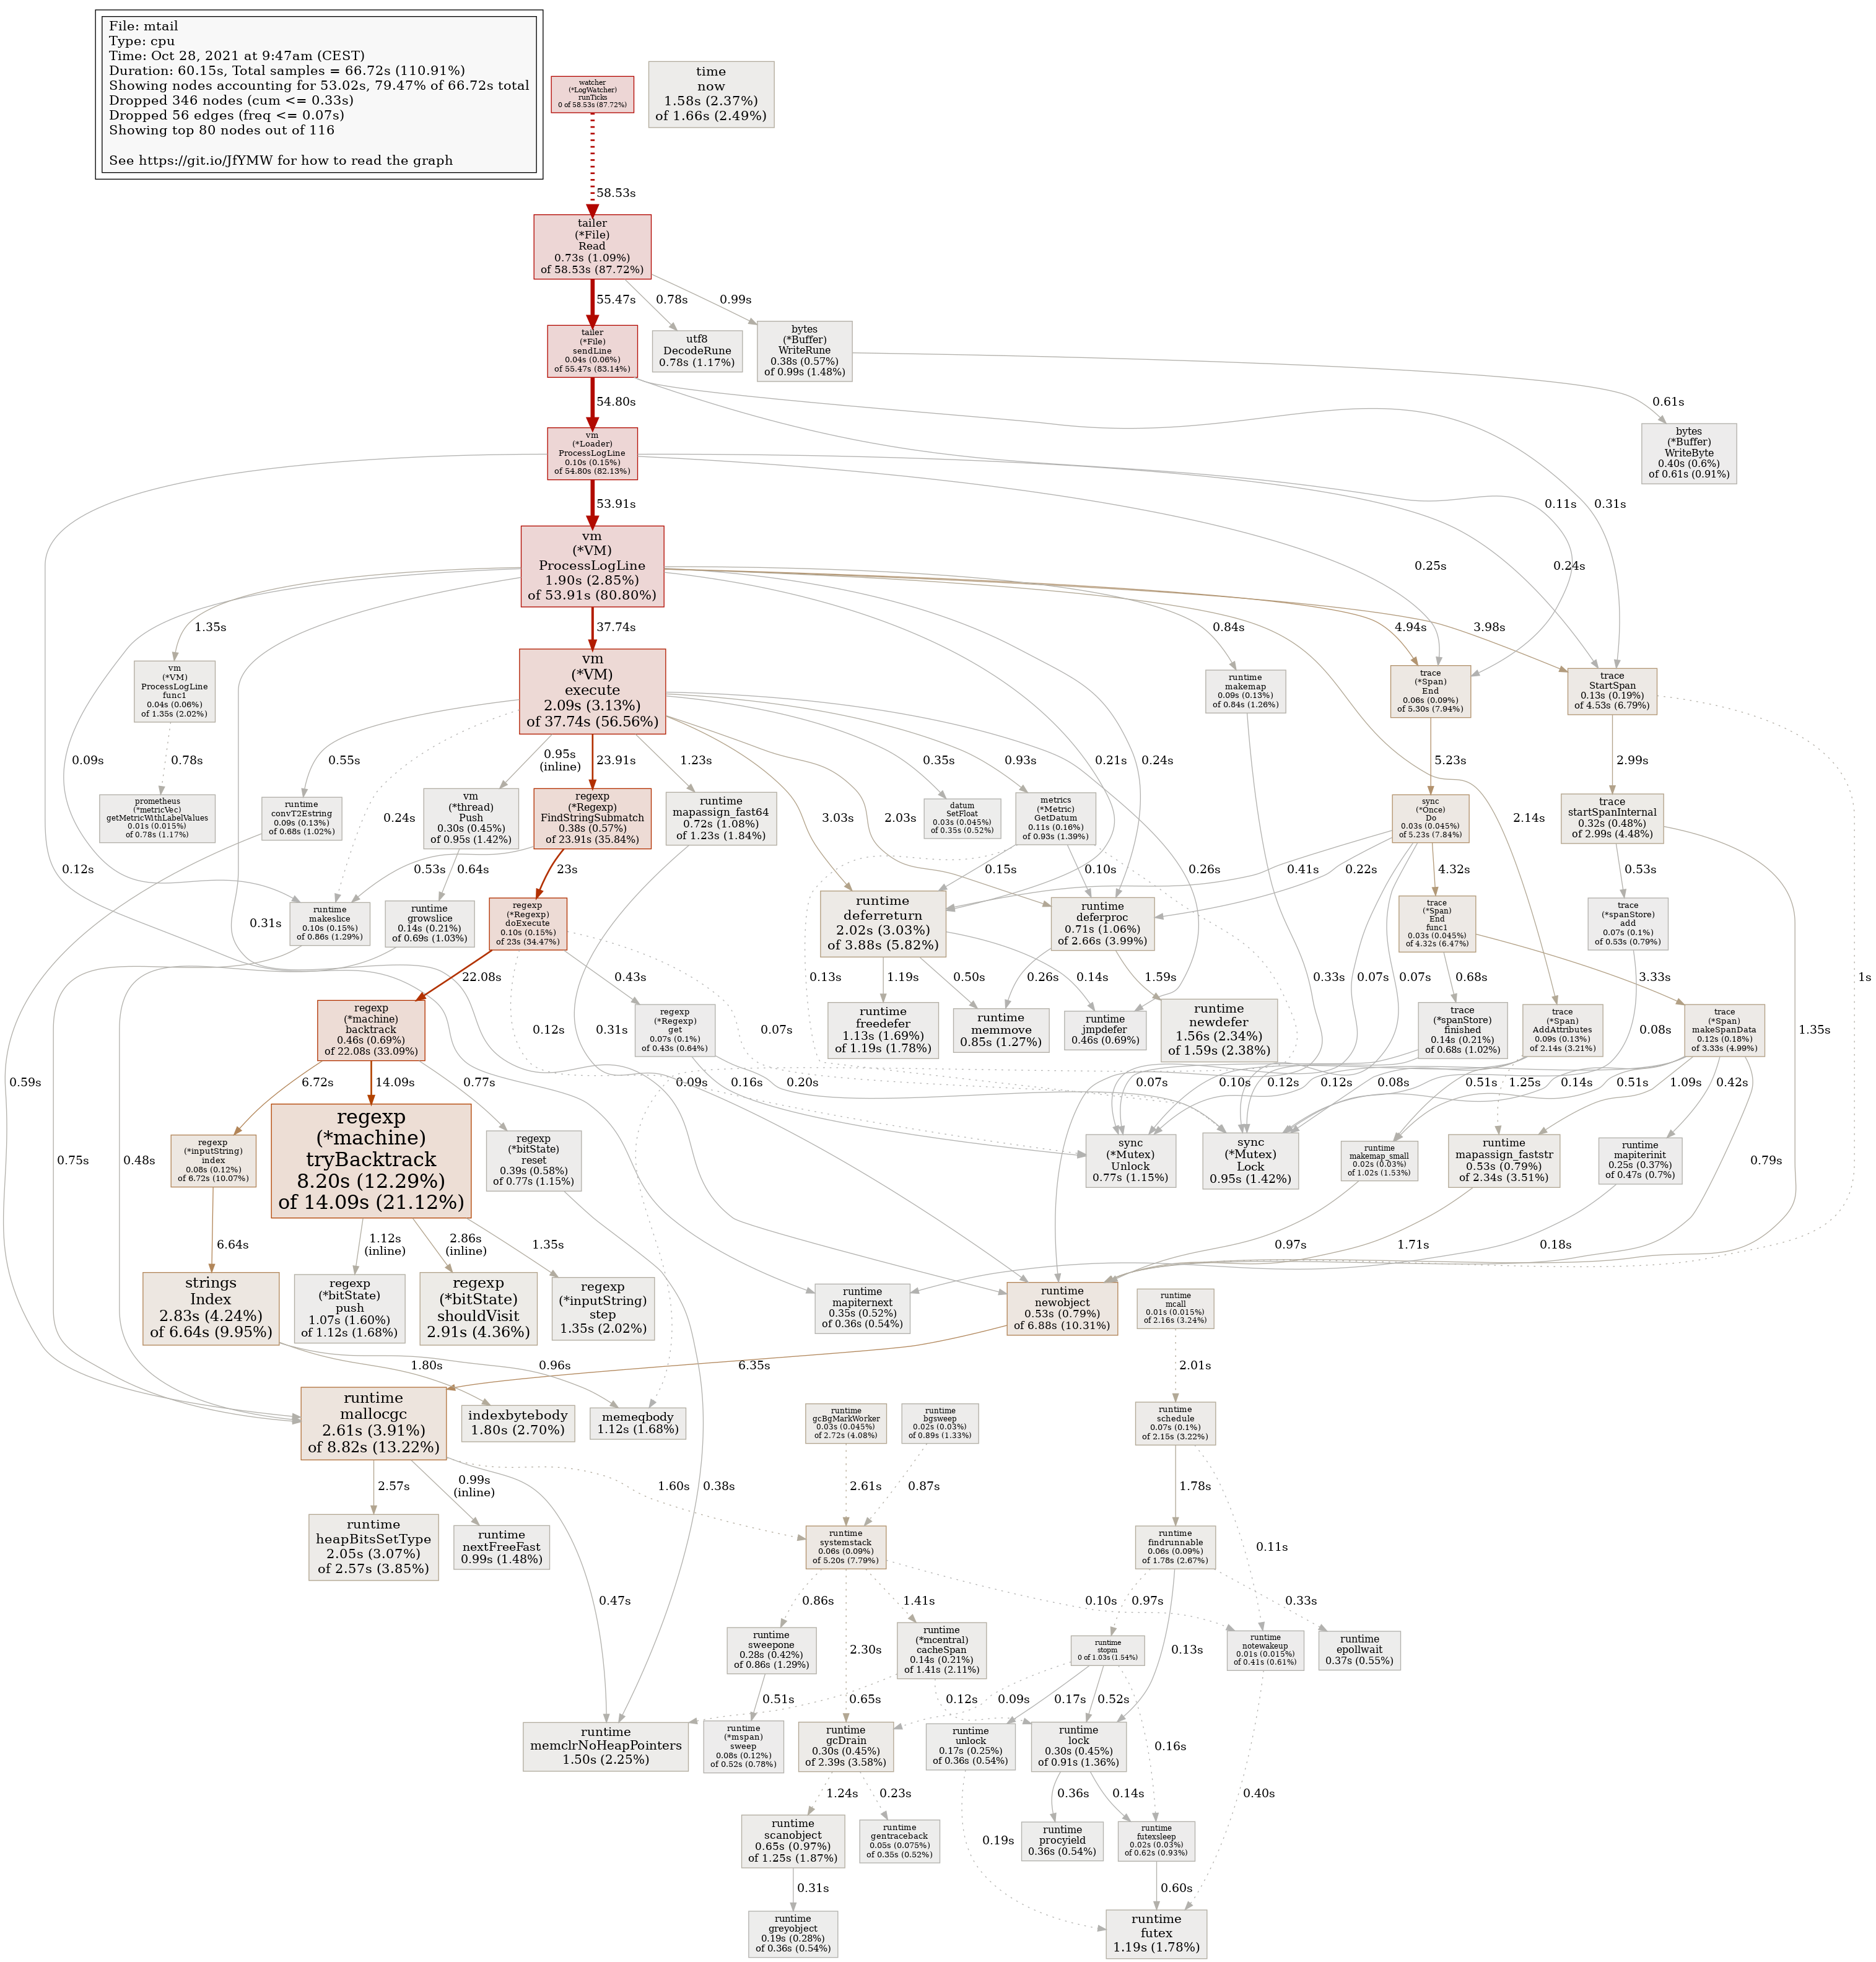
On the mtail front, this is what 1 minute of CPU profiling looks like while the issue is happening: