Page MenuHomePhabricator

Apparent latency warning in 90th centile of eventgate-logging-external
Closed, ResolvedPublic

Assigned To
Authored By
BTullis
Nov 3 2021, 11:53 AM
Referenced Files
F35235205: Screenshot 2022-06-13 at 12.27.39.png
Jun 13 2022, 11:35 AM
F35235185: Screenshot 2022-06-13 at 12.22.04.png
Jun 13 2022, 11:35 AM
F35235193: Screenshot 2022-06-13 at 12.22.22.png
Jun 13 2022, 11:35 AM
F35235188: Screenshot 2022-06-13 at 12.22.13.png
Jun 13 2022, 11:35 AM
F35221315: image.png
Jun 9 2022, 8:57 AM
F35215352: image.png
Jun 7 2022, 12:00 PM
F34869903: image.png
Dec 9 2021, 3:07 PM
F34869626: image.png
Dec 9 2021, 2:58 PM

Description

As part of the work to migrate Prometheus based checks from Icinga to Alertmanager (T293399) I have discovered something that I feel needs to be double-checked before I can proceed.
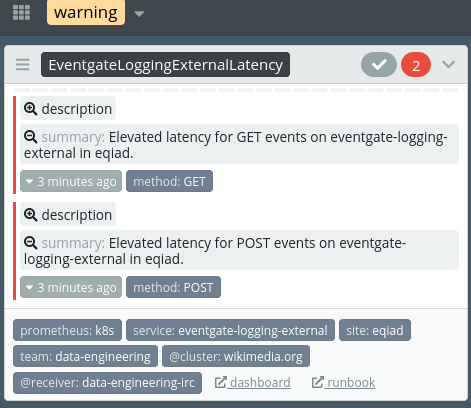
This relates to the alert for Elevated latency for eventgate-logging-external alert.

At the moment it appears to me that a latency warning should be in Icinga, but is not there due to a metric having been renamed.
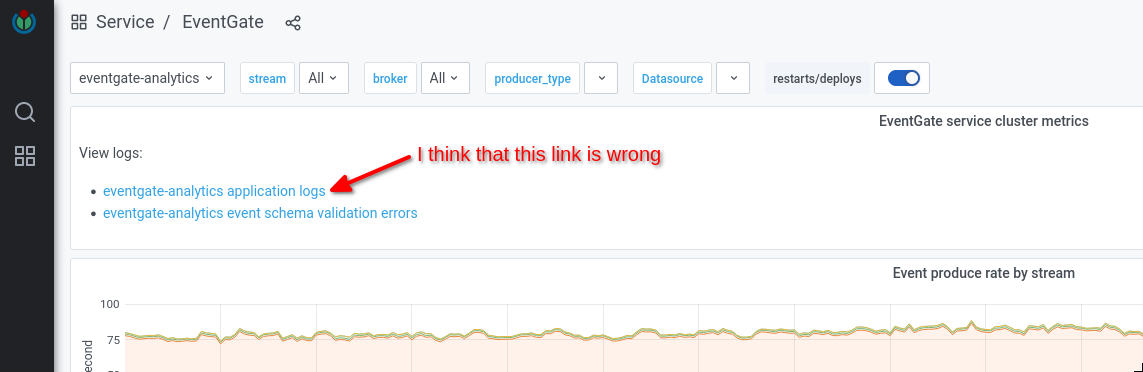
The Icinga check itself is here and is currently green (although the dashboard link is broken).

image.png (62ร—950 px, 16 KB)

I'd appreciate help please to understand which of the following is/are likely

  • there is a latency issue affecting ~ 10% of these events, which requires investigation
  • I should increase the warning/critical thresholds to match the observations
  • there is a problem with the way that this metric is calculated

or, naturally,

  • I've made a number of half-witted mistakes in getting this far ๐Ÿ™‚

Currently, that latency alert is defined by a monitoring::check_prometheus resource in Icinga here.

It queries a Prometheus metric named service_method:service_runner_request_duration_seconds:90pct5m{service="eventgate-logging-external"}

However, if we check Thanos and search for that metric, we can see that the only place it now exists is on the k8s-staging cluster.

image.png (290ร—1 px, 48 KB)

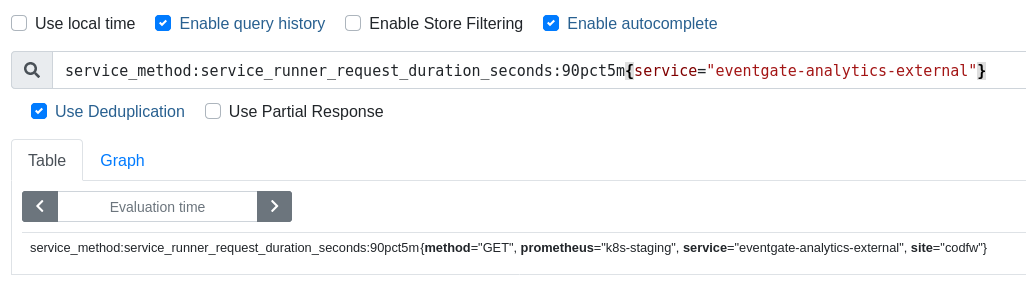
I believe that the name of the metric has been renamed from service_runner_request_duration_seconds to express_router_request_duration_seconds during the migration of this service to Kubernetes. This renaming was discussed here T238658#5947574 and here T278141#6949288.

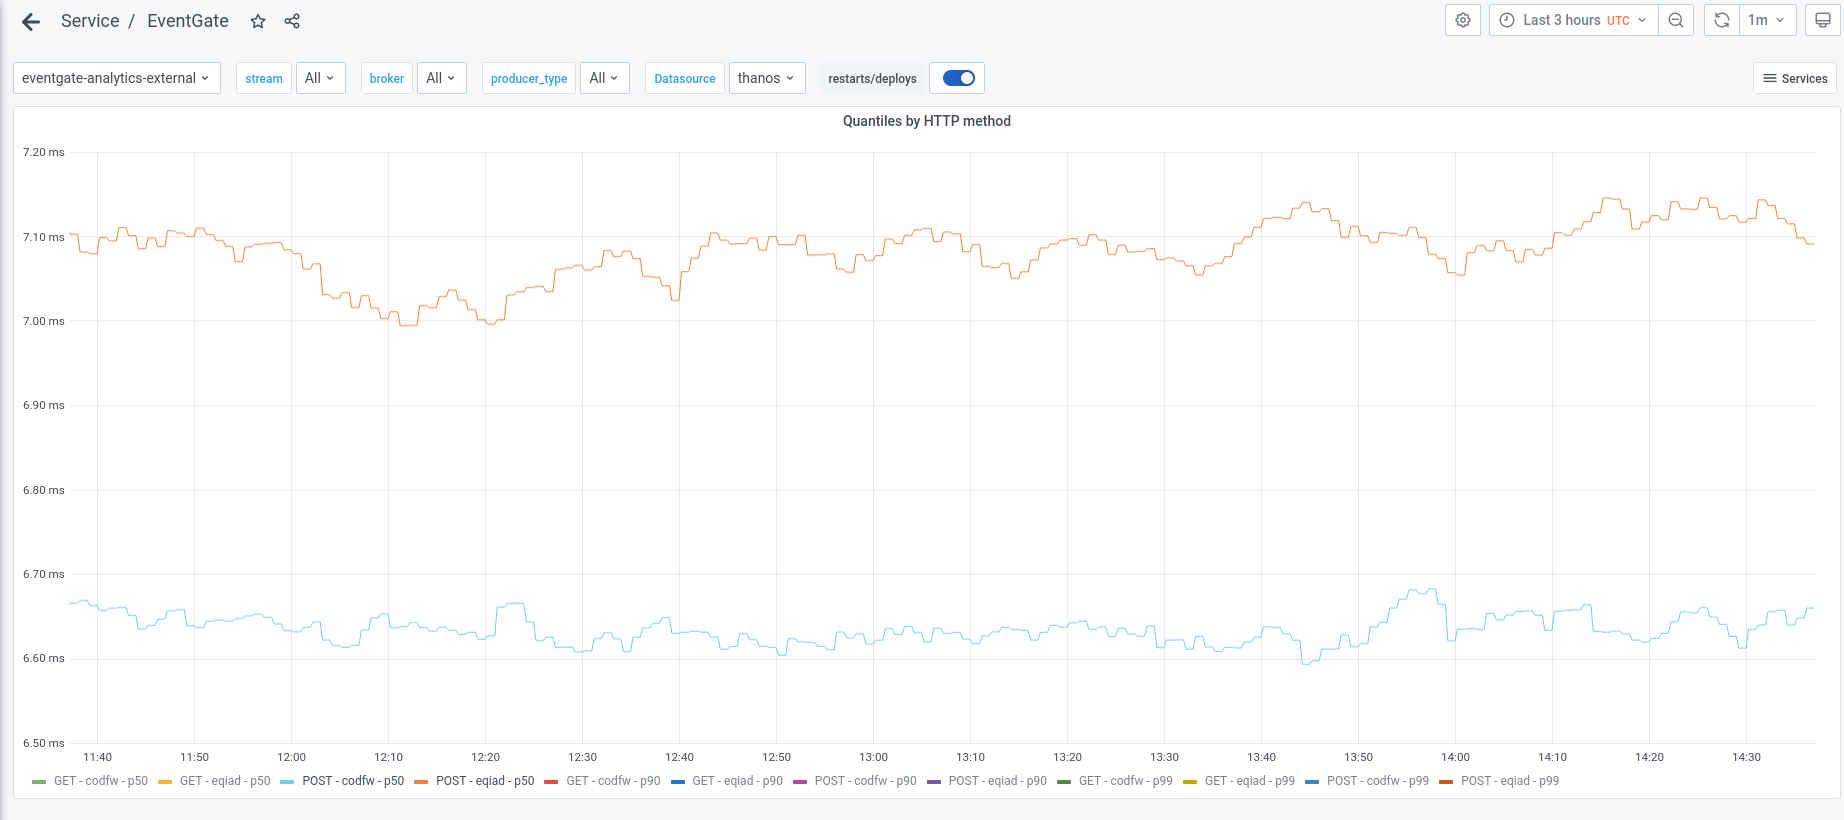
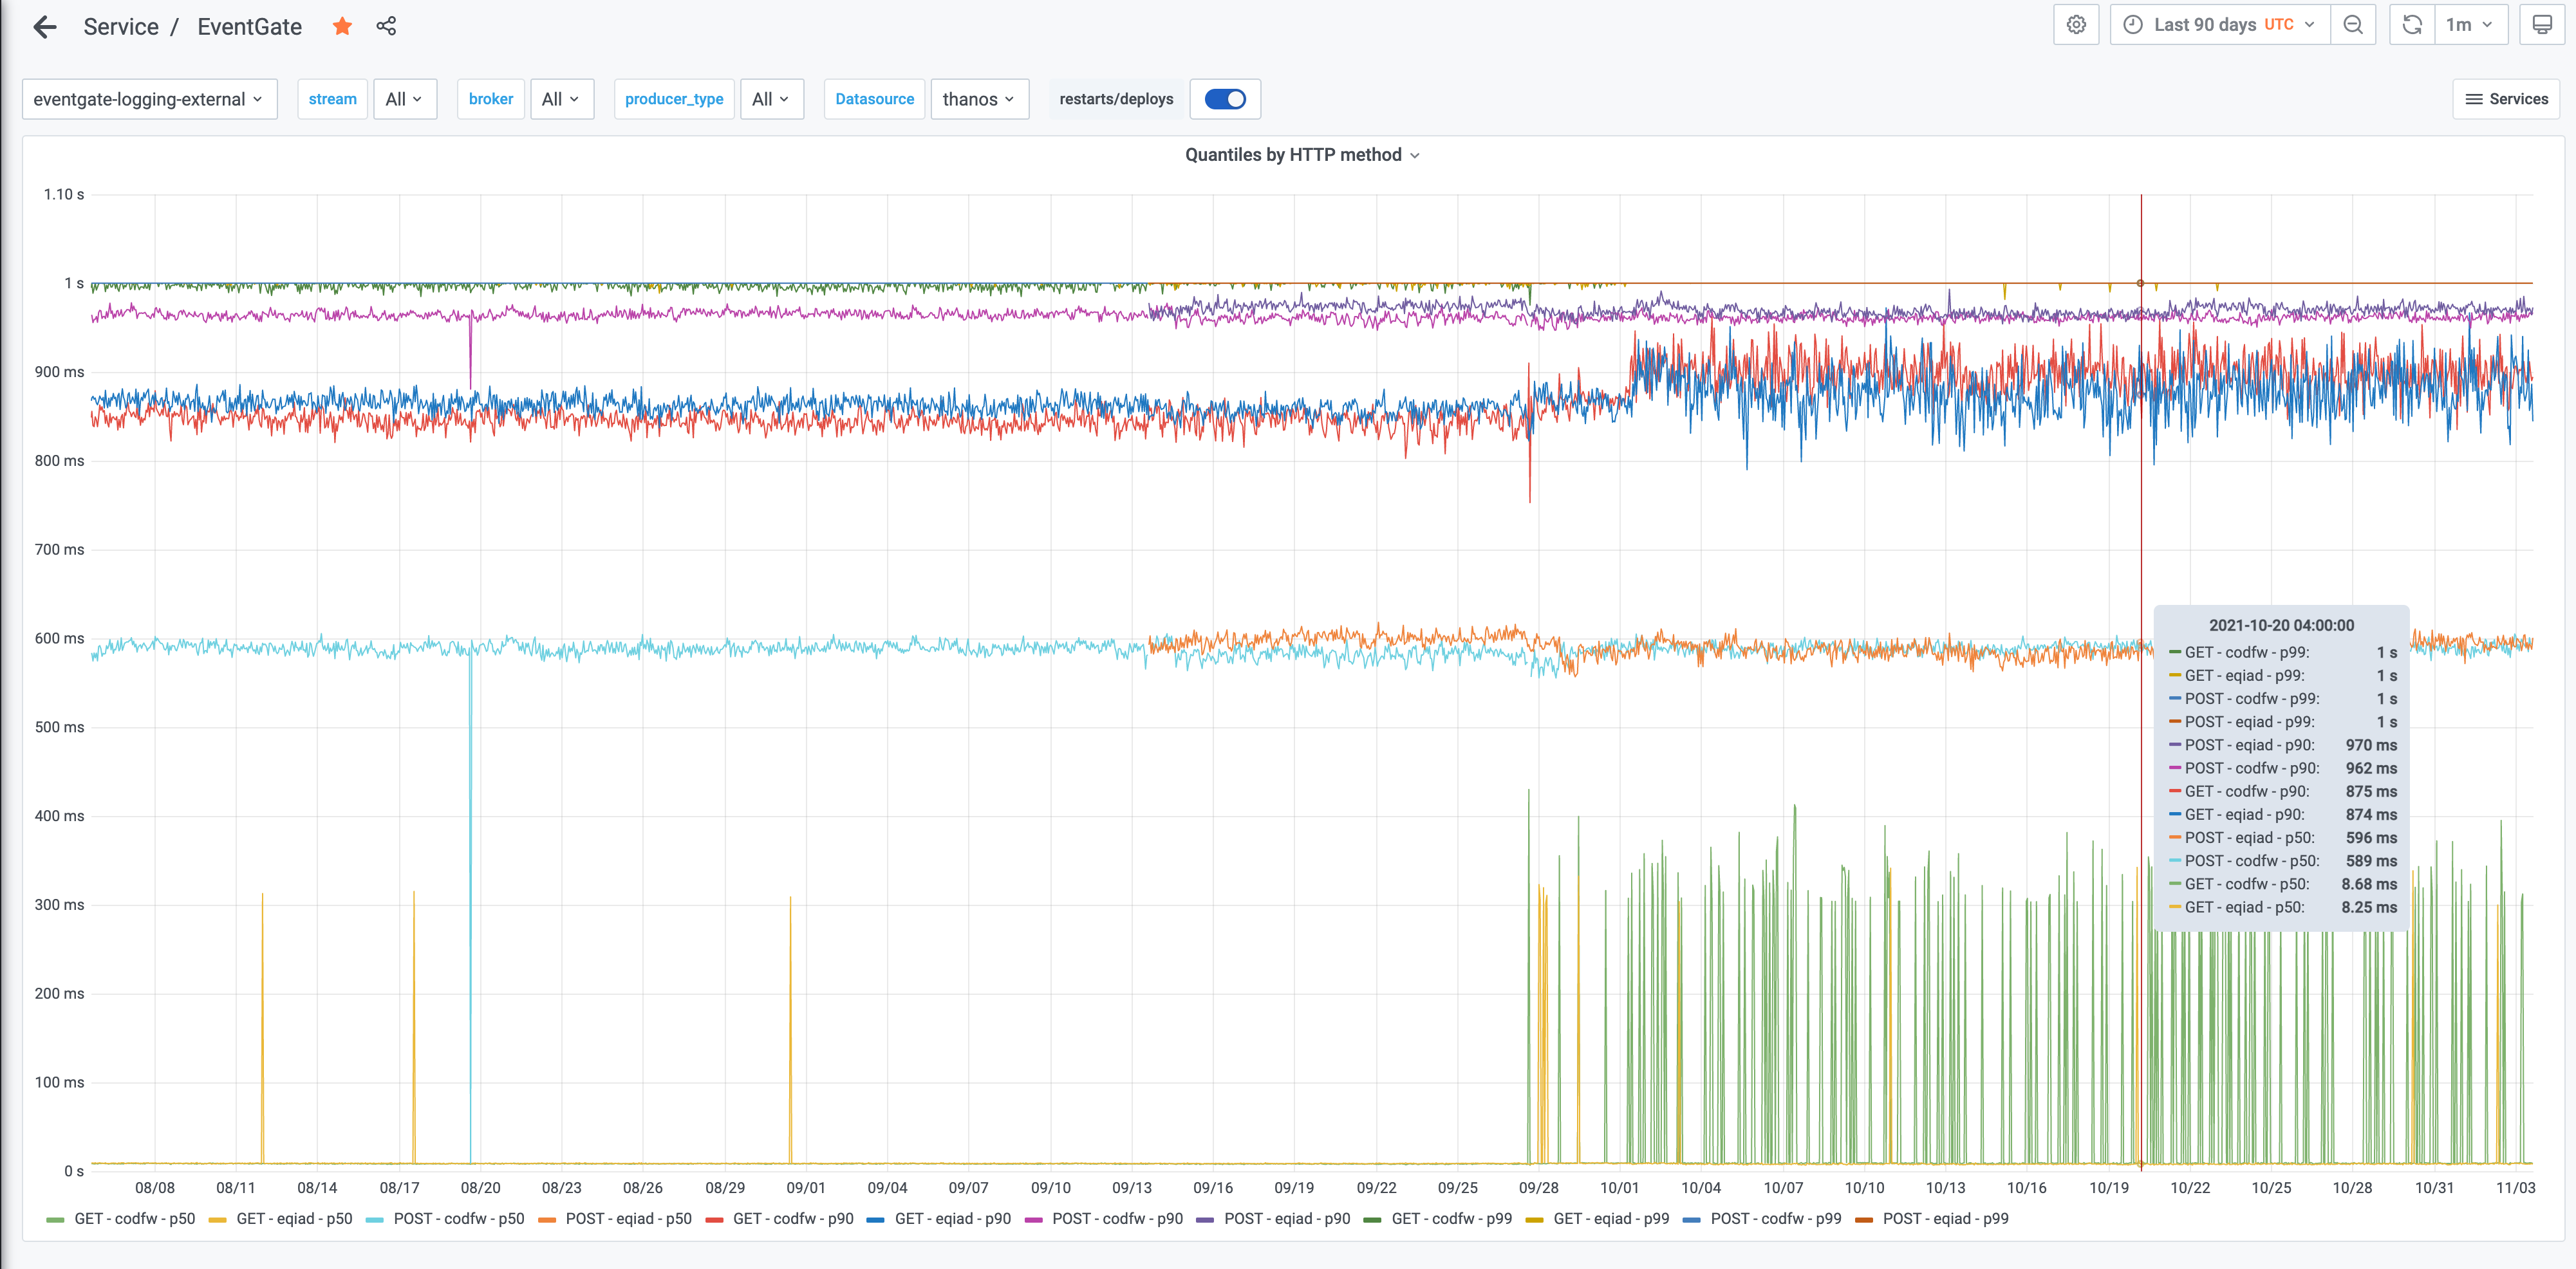
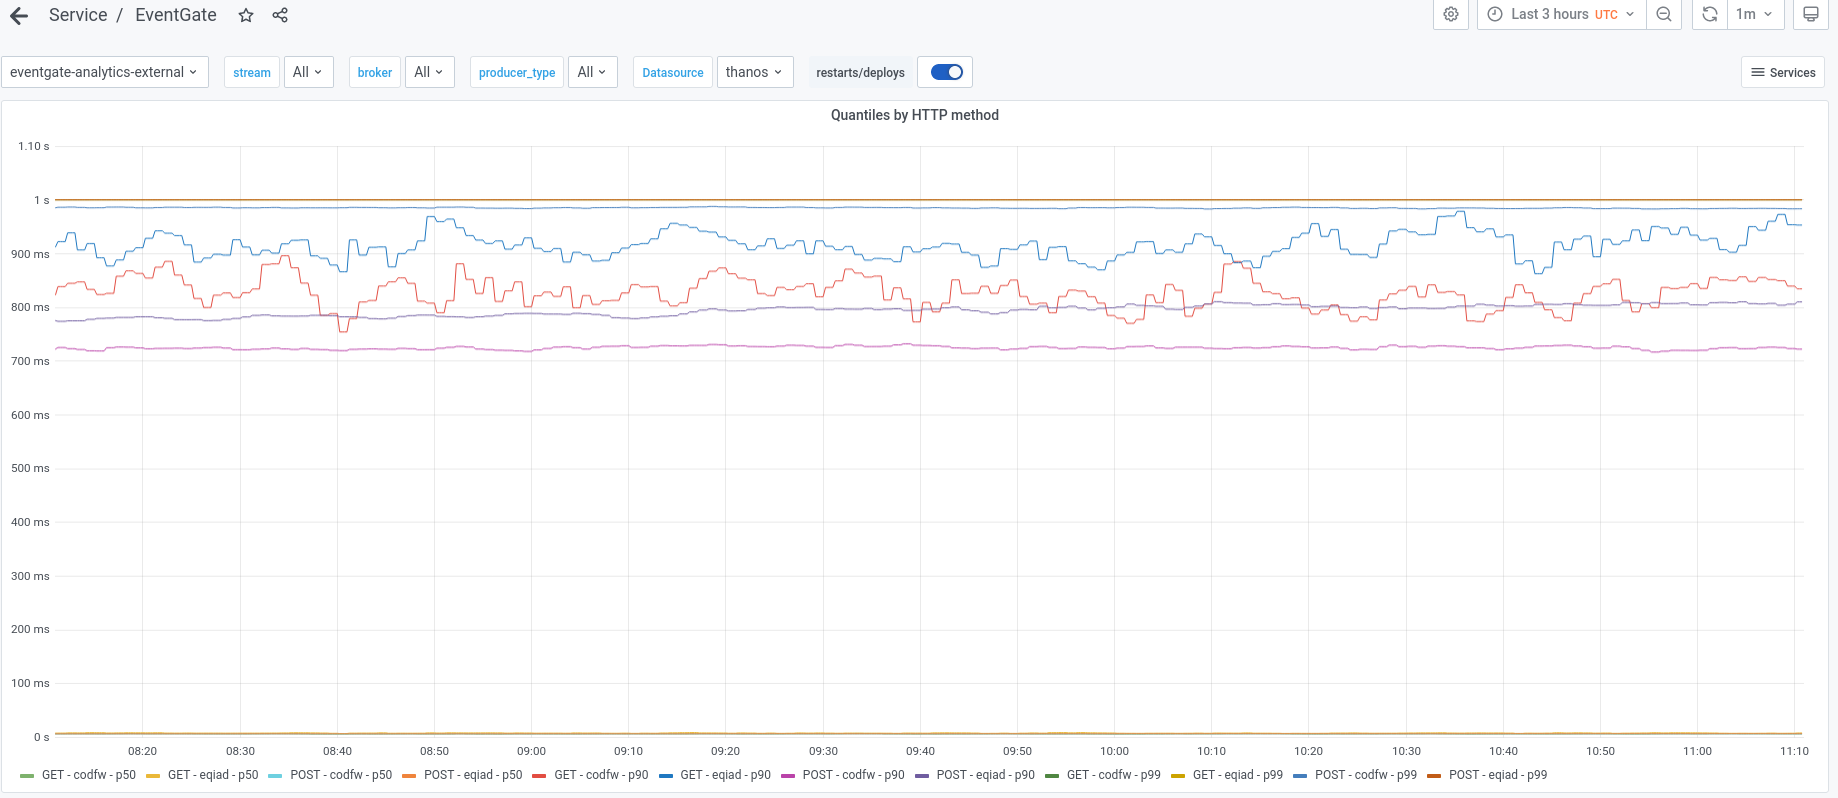
The Grafana dashboard tracking this received an update and that service_runner_request_duration_seconds:90pct5m metric, tracking the 90th centile latency is shown on a panel named Quantiles by HTTP method on the Latency row of the Eventgate dashboard here.

We can see from that graph that the 90th percentile values for that metric, including eqiad and codfw, POST and GET methods, are between 730ms and 950ms and have been for a long time.

image.png (798ร—1 px, 171 KB)

Currently the check in Icinga should issue a warning if the latency is above 500ms and a critical if it is above 1 second.

The Icinga check currently does not issue a warning because the set of values it returns is empty. See the following example for eqiad.

btullis@alert1001:~$ /usr/lib/nagios/plugins/check_prometheus_metric.py --debug --url 'http://prometheus.svc.eqiad.wmnet/k8s' -w '0.5' -c '1' -m 'ge' 'service_method:service_runner_request_duration_seconds:90pct5m{service="eventgate-logging-external"}'
DEBUG:urllib3.util.retry:Converted retries value: 2 -> Retry(total=2, connect=None, read=None, redirect=None, status=None)
DEBUG:__main__:Running 'service_method:service_runner_request_duration_seconds:90pct5m{service="eventgate-logging-external"}' on 'http://prometheus.svc.eqiad.wmnet/k8s/api/v1/query'
DEBUG:__main__:Checking vector data for []
All metrics within thresholds.

btullis@alert1001:~$ echo $?
0

If I change the prefix of the metric from service_runner_ to express_router_ and re-run the same check manually, then the check seems to the correct data and exits with a warning:

btullis@alert1001:~$ /usr/lib/nagios/plugins/check_prometheus_metric.py --debug --url 'http://prometheus.svc.eqiad.wmnet/k8s' -w '0.5' -c '1' -m 'ge' 'service_method:express_router_request_duration_seconds:90pct5m{service="eventgate-logging-external"}'
DEBUG:urllib3.util.retry:Converted retries value: 2 -> Retry(total=2, connect=None, read=None, redirect=None, status=None)
DEBUG:__main__:Running 'service_method:express_router_request_duration_seconds:90pct5m{service="eventgate-logging-external"}' on 'http://prometheus.svc.eqiad.wmnet/k8s/api/v1/query'
DEBUG:__main__:Checking vector data for [{'metric': {'__name__': 'service_method:express_router_request_duration_seconds:90pct5m', 'method': 'GET', 'service': 'eventgate-logging-external'}, 'value': [1635938600.36, '0.8878082191780825']}, {'metric': {'__name__': 'service_method:express_router_request_duration_seconds:90pct5m', 'method': 'POST', 'service': 'eventgate-logging-external'}, 'value': [1635938600.36, '0.9683779399837793']}]
method={GET,POST} service=eventgate-logging-external

btullis@alert1001:~$ echo $?
1

I'll tag this ticket with Data-Engineering but mention @Ottomata , @colewhite , @akosiaris, and @fgiunchedi because I believe that they may have insight into the issue and may know better than me how to investigate further.

Event Timeline

Restricted Application added a subscriber: Aklapper. ยท View Herald TranscriptNov 3 2021, 11:53 AM

Indeed, it looks like this alert was lost in the metric renaming. We should re-add it.

I'm surprised the latency is so high though. The throughput of eventgate-logging-external is very low. Even the p50 POST is high (600ms). I see some usages of the 'guaranteed' Kafka producer, but even the max Kafka produce round trip time is still low (~50ms). The eventgate-analytics-external latency quantiles look about the same. eventgate-main and eventgate-analytics (internal only) p50s are more sane (7ms).

Hm, I guess actually makes sense? Is 500ms+ request latency for external clients normlish sounding?

Thanks Andrew.

I'm confused by this comment though...

Even the p50 POST is high (600ms)

...because I can't see this from the graph.

Filtering for the p50 POST for eventgate-logging-external on that chart seems to show it at around 6.5 to 7.1 ms, unless I'm missing something.

image.png (820ร—1 px, 131 KB)

It's only in the 90th that I see this skew and the 99th, where 3 out of 4 are maxed out at 1s. Do we timeout after 1 second?

Change 736490 had a related patch set uploaded (by Btullis; author: Btullis):

[operations/alerts@master] Add the first eventgate alert to Alertmanager

https://gerrit.wikimedia.org/r/736490

The eventgate-analytics-external latency quantiles look about the same

Hm, I must have been looking at the wrong chart here, the p50 of eventgate-analytics-external does indeed look around ~7ms.

Your post shows eventgate-analytics-external. eventgate-logging-external does indeed show a POST p50 of almost 600ms.

Screen Shot 2021-11-03 at 11.36.48.png (1ร—4 px, 1 MB)

Also possibly related: T264021: > ~1 request/second to intake-logging.wikimedia.org times out at the traffic/service interface. Although, that timeout seems to be happening somewhere before eventgate.

Gah, I hadn't spotted the difference between eventgate-analytics-external and eventgate-logging-external.
Thanks for pointing that out.

The original alert was about eventgate-logging-external so you're completely right about the high P50 POST values. I will check my working and investigate thiat related ticket.

Change 736490 merged by jenkins-bot:

[operations/alerts@master] Add the first eventgate alert to Alertmanager

https://gerrit.wikimedia.org/r/736490

I have merged the change to the alerts repo and the alert did fire as expected.

image.png (408ร—471 px, 51 KB)

I can acknowledge it for now, but I think that the decision about wht to do, or who should handle it next is for Observability-Alerting to handle.

IIUC the other half of this task is to determine whether the alerting thresholds are appropriate. Given EventGate produces these metrics I'll tag Event Platform for review.

I'm going to spend some time investigating this warning, because I still think that there might be an underlying latency issue that would be helpful to find.

I think I have an understanding of why this is happening and what we should do about it.

The short version:

The increased latency is to be expected for a number of reasons. My recommendations are:

  1. We should increase the maximum timeout on the envoy TLS proxy for eventgate-logging-external, which is currently capped at 1 second. I propose 5 seconds.
  2. We should adjust the thresholds for monitoring this service, to take account of the increased latency.

The long version:

As we know, the primary use case for eventgate-logging-external is that of Network Error Logging (aka NEL). This NEL feature allows modern browsers, including many mobile device browsers to send details of any network errors to a specific logging endpoint. This reporting is done asynchronously and can be buffered by the browser until such a time that the network is available. The fact that many of the browsers sending these reports will be mobile browsers and may therefore be on relatively slow 2G/3G connections, means that we might well expect a significant proportion of these reports to be delivered slowly.

There is one other element to this, which is that the https://intake-logging.wikimedia.org endpoint deliberately selects the second-best PoP for the user, using a specific GeoDNS configuration mechanism.
This means that the path from the client to the endpoint is deliberately not a fast as it could be.

We can see the NEL Dashboard in logstash here, which shows a breakdown of the reports that were 1) submitted by browsers 2) passed the validation by eventgate 3) made it through Kafka and 4) were subsequently indexed by Logstash.
We can also see the number of HTTP requests per second arriving at eventgate-logging-external in Grafana.

This ticket was originally created because of the high value for the 90th percentile response time, but we can also see that somewhere between 1% and 9% of the reports are timing out at 1 second.

image.png (803ร—1 px, 86 KB)

If we look at the kubernetes application logs for the eventgate-logging-external applications label, we can see a number of 500 errors returned by the app, with BadRequestError: request aborted at IncomingMessage.onAborted messages. I believe that these may correlate with the reports that time out at 1 second, at which point envoy aborts the proxy attempt.

I believe that this 1 second timeout is due the connect_timeout value of 1 second in the eventgate-logging-external-tls-proxy envoy container within the pod.

btullis@deploy1002:/srv/deployment-charts/helmfile.d/services/eventgate-logging-external$ kubectl describe configmaps eventgate-logging-external-production-envoy-config-volume|tail -n +20|head -n 7
  clusters:
  - name: local_service
    common_http_protocol_options:
      # Idle timeout is the time a keepalive connection will stay idle before being
      # closed. It's important to keep it similar to the backend idle timeout.
      idle_timeout: 4.5s
    connect_timeout: 1.0s

Information on the envoy connect_timeout value is here and here.

It's configured within the helm chart here but is not currently configurable between different deployments of eventgate.

Given the above, I propose that we make this option a parameter and change the value for eventgate-logging-external to be 5 seconds.
In fact, there might also be a case for raising the value for the other externally facing endpoint (eventgate-analytics-external) to more than 1 second as well.

I'm tagging @CDanis who did a lot of the work on NEL and may well be able to validate or refute the above analysis.

Also, while I'm here, I think that the link to Logstash is incorrect on the Eventgate Grafana dashboard. Happy to try to fix it, but I thought it best to make a record of it.

image.png (372ร—1 px, 64 KB)

@BTullis I'm not fully convinced that slowness in connection to the edge would reflect in a longer connection timeout on the backend.

The connection from the client is with the edge caches, not with eventgate directly. The connection you want to add a connect_timeout is initiated by the caching backend in the datacenter receiving the network error reports. Unless the whole edge cache chain (so ats-tls, varnish, ats-be) does a completely transparent TCP proxying, which I don't think they do even when there is a passthrough logic, that wouldn't apply.

Add to this that we keep persistent connection between ATS and its backends and I think it's possible the cause needs to be searched elsewhere.

Having said that, I don't think raising the connection timeout will do us much harm in the short term, as the chances of exploiting it for DDOS sake are almost non-existent given the protections we have in front.

Change 748704 had a related patch set uploaded (by Btullis; author: Btullis):

[operations/alerts@master] Increase the threshold EventgateLoggingExternalLatency

https://gerrit.wikimedia.org/r/748704

Thanks for the feedback @Joe - I'm sure you're right.
I'll keep searching for the cause elsewhere then, but in the meantime I've made a CR to raise the warning threshold to 980 ms and I've also silenced the alert for 21 days.

As we know, the primary use case for eventgate-logging-external is that of Network Error Logging (aka NEL).

Just a clarification, the original use case for eventgate-logging-external was for mediawiki.client-error logging. Until I looked just now, I had assumed that this was also the majority of events here, but you are right, NEL is larger.

I think that the link to Logstash is incorrect on the Eventgate Grafana dashboard.

Please fix! :)

ย BadRequestError: request aborted at IncomingMessage.onAborted

https://github.com/expressjs/body-parser/blob/master/README.md#request-aborted

I've seen these errors before too, and I had assumed they were just clients closing the HTTP connection prematurely for some reason.

I have merged a change that will increase the threshold for alerting, so that the warnings do not trigger: https://gerrit.wikimedia.org/r/c/operations/alerts/+/748704

I'll continue to investigate the possible causes of the latency.

Change 748704 merged by jenkins-bot:

[operations/alerts@master] Increase the threshold EventgateLoggingExternalLatency

https://gerrit.wikimedia.org/r/748704

BTullis moved this task from In Progress to Done on the Data-Engineering-Kanban board.
BTullis removed a project: Data-Engineering-Kanban.

I don't have much more time to investigate this at the moment, so I'll unassigning myself for now and I'll leave it on the Event Platform backlog.
I still believe that there is some kind of latency issue to be found, but for now it is not going to trigger alerts unless in exceptional curcumstances.
If anyone else would lime my help to investigate, I'll be more than happy to help.

Change 785151 had a related patch set uploaded (by Btullis; author: Btullis):

[operations/deployment-charts@master] Increase the RAM request and limit for eventgate pods

https://gerrit.wikimedia.org/r/785151

Change 785151 merged by jenkins-bot:

[operations/deployment-charts@master] Increase the RAM request and limit for eventgate pods

https://gerrit.wikimedia.org/r/785151

Change 790289 had a related patch set uploaded (by Btullis; author: Btullis):

[operations/deployment-charts@master] Increase the connect_timeout for eventgate based services

https://gerrit.wikimedia.org/r/790289

Change 791320 had a related patch set uploaded (by Btullis; author: Btullis):

[operations/deployment-charts@master] Double the number of eventgate_analytics_external replicas

https://gerrit.wikimedia.org/r/791320

Change 791320 merged by jenkins-bot:

[operations/deployment-charts@master] Double the number of eventgate_analytics_external replicas

https://gerrit.wikimedia.org/r/791320

Change 791594 had a related patch set uploaded (by Alexandros Kosiaris; author: Alexandros Kosiaris):

[operations/deployment-charts@master] eventgate_analytics_external: Lower to 35 replicas

https://gerrit.wikimedia.org/r/791594

Change 791594 merged by Alexandros Kosiaris:

[operations/deployment-charts@master] eventgate_analytics_external: Lower to 35 replicas

https://gerrit.wikimedia.org/r/791594

Change 790289 abandoned by Btullis:

[operations/deployment-charts@master] Increase the connect_timeout for eventgate based services

Reason:

We don't think that it is this connect_timeout after all. Rethinking.

https://gerrit.wikimedia.org/r/790289

Change 803242 had a related patch set uploaded (by Btullis; author: Btullis):

[operations/deployment-charts@master] Use latest image version in all remaining eventgate services

https://gerrit.wikimedia.org/r/803242

Change 803483 had a related patch set uploaded (by Btullis; author: Btullis):

[operations/deployment-charts@master] Bump the eventgate image used by eventgate-analytics-external

https://gerrit.wikimedia.org/r/803483

With regard to this apparent latency, @akosiaris has identified the cause and provided the fix, so we're hopeful that this ticket can be closed as a result.
The key comment is here: T306181#7967495

Essentially, eventgate services have been generating timing metrics that are off by a factor of 1000 due to having omitted a change to the service-runner component.
Once we have deployed this update, the graphs should show much lower latency, which reflects reality.

It won't solve the fact that T306181: intake-analytics is responsible for up to a 85% of varnish backend fetch errors but it will help to make that issue more clear, if spurious timing values are removed from the mix.

Change 803483 merged by jenkins-bot:

[operations/deployment-charts@master] Bump the eventgate image used by eventgate-analytics-external

https://gerrit.wikimedia.org/r/803483

The update to service-runner worked as expected for eventgate-analytics-external.
Grafana link

image.png (755ร—1 px, 228 KB)

Now deploying that change to the other eventgate services.

Change 803242 merged by jenkins-bot:

[operations/deployment-charts@master] Use latest image version in all remaining eventgate services

https://gerrit.wikimedia.org/r/803242

BTullis claimed this task.

I'm going to mark this ticket as resolved now, but there is one more observation that is worth recording here.
Since the version bump of service-runner, which fixed the timings issue, the latency graphs show an interesting effect.

image.png (900ร—1 px, 328 KB)

Grafana link

Now the only endpoint which appears to take longer than all of the rest is the /v1/_test/events path. This is consistently much slower than all of the other endpoints, across all eventgate deployments.
I'll continue to bear this in mind when investigating T306181 and friends.

Strange! /v1/_test/events is used for the k8s readinessProbe. I could see this endpoint taking extra to respond on pod startup, but I don't know why it would consistently have longer latencies over time.

The code that handles this endpoint is every so slightly different than the rest. It does cloneDeep the test event each time it is called, but the test event is not large.

Now the only endpoint which appears to take longer than all of the rest is the /v1/_test/events path. This is consistently much slower than all of the other endpoints, across all eventgate deployments.

Please forgive my lack of knowledge in this area but AFAICT it's the deployment represented by the codfw/prometheus k8s-staging datasource that's slow:

Datasource
codfw/prometheus k8s
Screenshot 2022-06-13 at 12.22.04.png (1ร—2 px, 281 KB)
codfw/prometheus k8s-staging
Screenshot 2022-06-13 at 12.27.39.png (1ร—2 px, 580 KB)
eqiad/prometheus k8s
Screenshot 2022-06-13 at 12.22.13.png (1ร—2 px, 333 KB)
eqiad/prometheus k8s-staging
Screenshot 2022-06-13 at 12.22.22.png (1ร—2 px, 272 KB)

Thanks @phuedx - I think you're correct.
According to this information we shouldn't even have the application deployed to staging-codfw: https://wikitech.wikimedia.org/wiki/Kubernetes/Clusters#Datacenters_2
...so I will look into deleting the deployment.

Oh! its just k8s-staging! yes we do not need eventgate deployed to k8s-staging. Nice.