Page MenuHomePhabricator

Use static php array files for l10n cache at WMF (instead of CDB)
Open, HighPublic

Assigned To
None
Authored By
ori
May 19 2015, 11:21 PM
Referenced Files
F31804580: mw1407-latency.png
May 6 2020, 8:10 AM
F31804583: mw1407-memcached.png
May 6 2020, 8:10 AM
F31784384: nemico_pubblico_c25.png
Apr 28 2020, 2:19 PM
F31784369: obama_c25.png
Apr 28 2020, 2:19 PM
F31784390: load_c40.png
Apr 28 2020, 2:19 PM
F31784335: application-servers-red-dashboard-latency.png
Apr 28 2020, 1:57 PM
F31662255: opcache.php
Mar 4 2020, 5:02 PM
F175299: Screen Shot 2015-06-05 at 2.22.18 PM.png
Jun 5 2015, 9:23 PM
Tokens
"Yellow Medal" token, awarded by Florian."Barnstar" token, awarded by greg."Like" token, awarded by Ladsgroup."100" token, awarded by hashar."Like" token, awarded by mmodell.

Description

Facebook's Fred Emmott works on benchmarking HHVM's performance when running various open-source PHP frameworks. This puts him in contact with MediaWiki's codebase. He wrote in to suggest that we experiment with using plain PHP files instead of CDB for the l10n cache. We should try that and see whether it improves performance.


Deployment plan (see also T99740#5165753 by @Krinkle):

  1. Have Scap (also) generate l10n cache in the array format whenever it calls rebuildLocalisationCache.
  2. Enable array format for Beta Cluster wikis.
  3. Package new scap and have it deployed to production (T245530); then run a full scap.
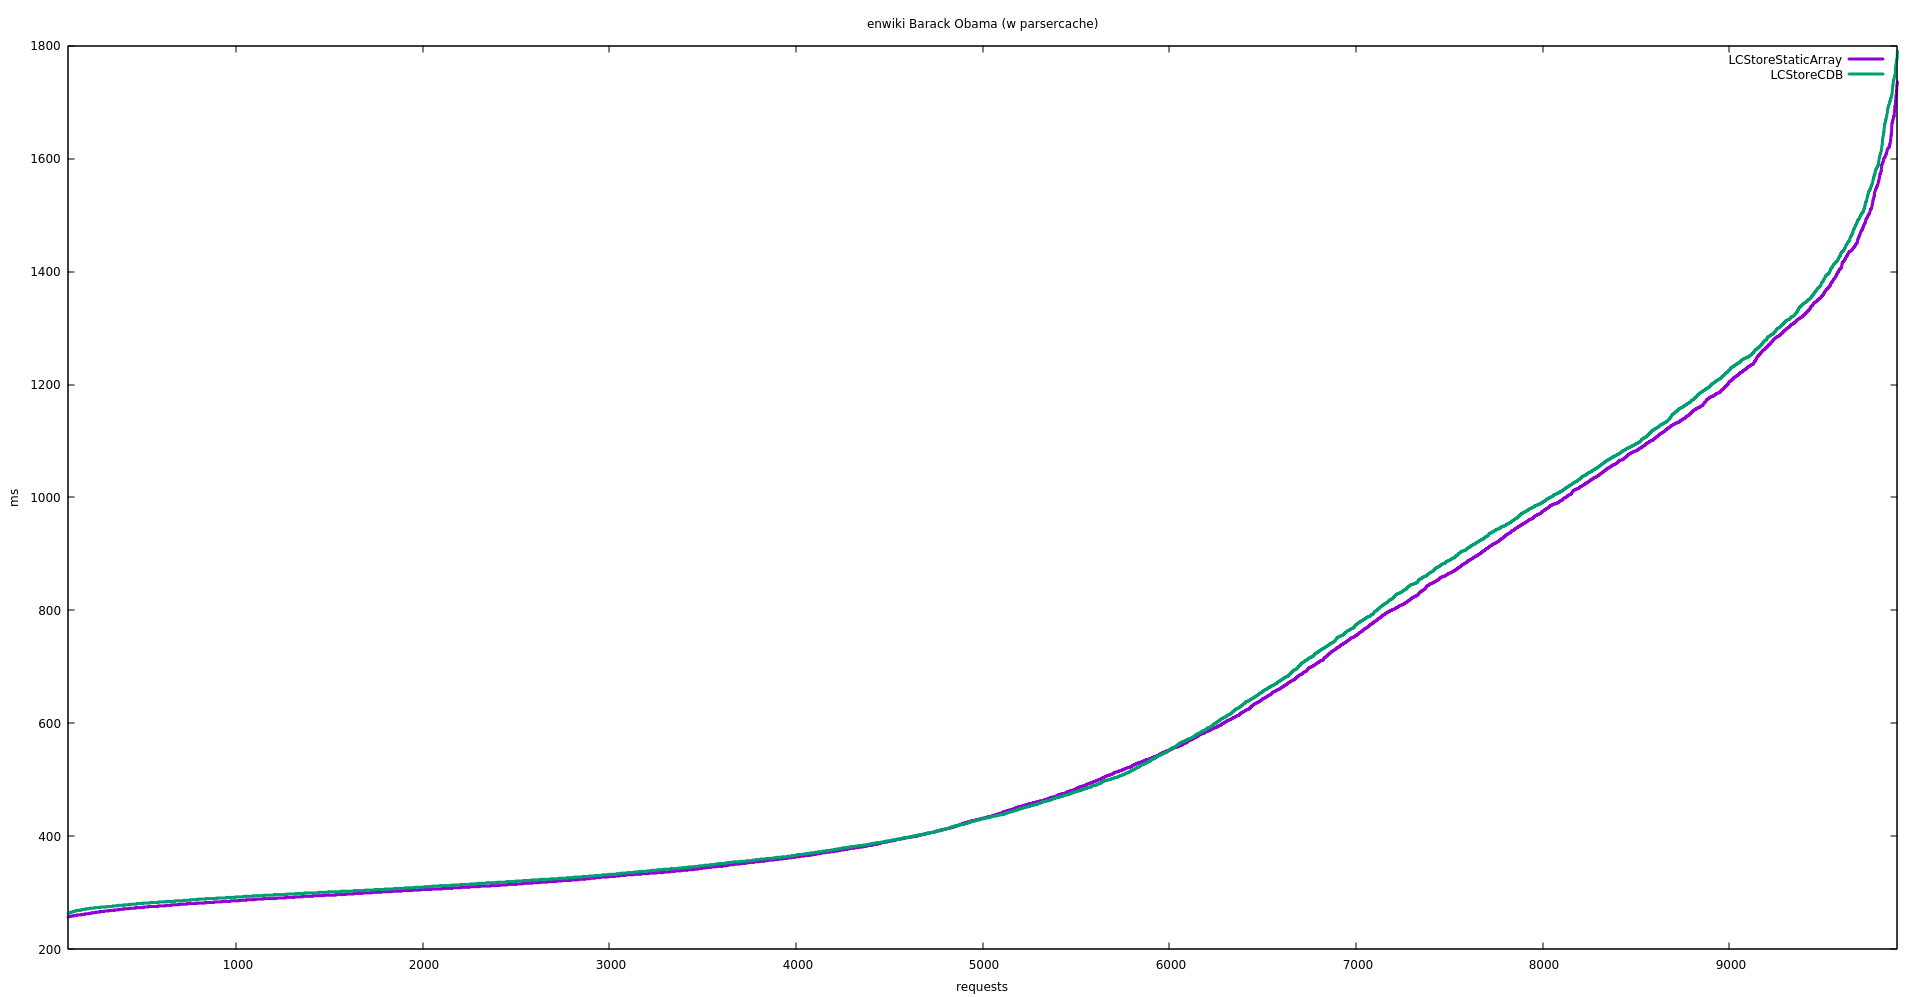
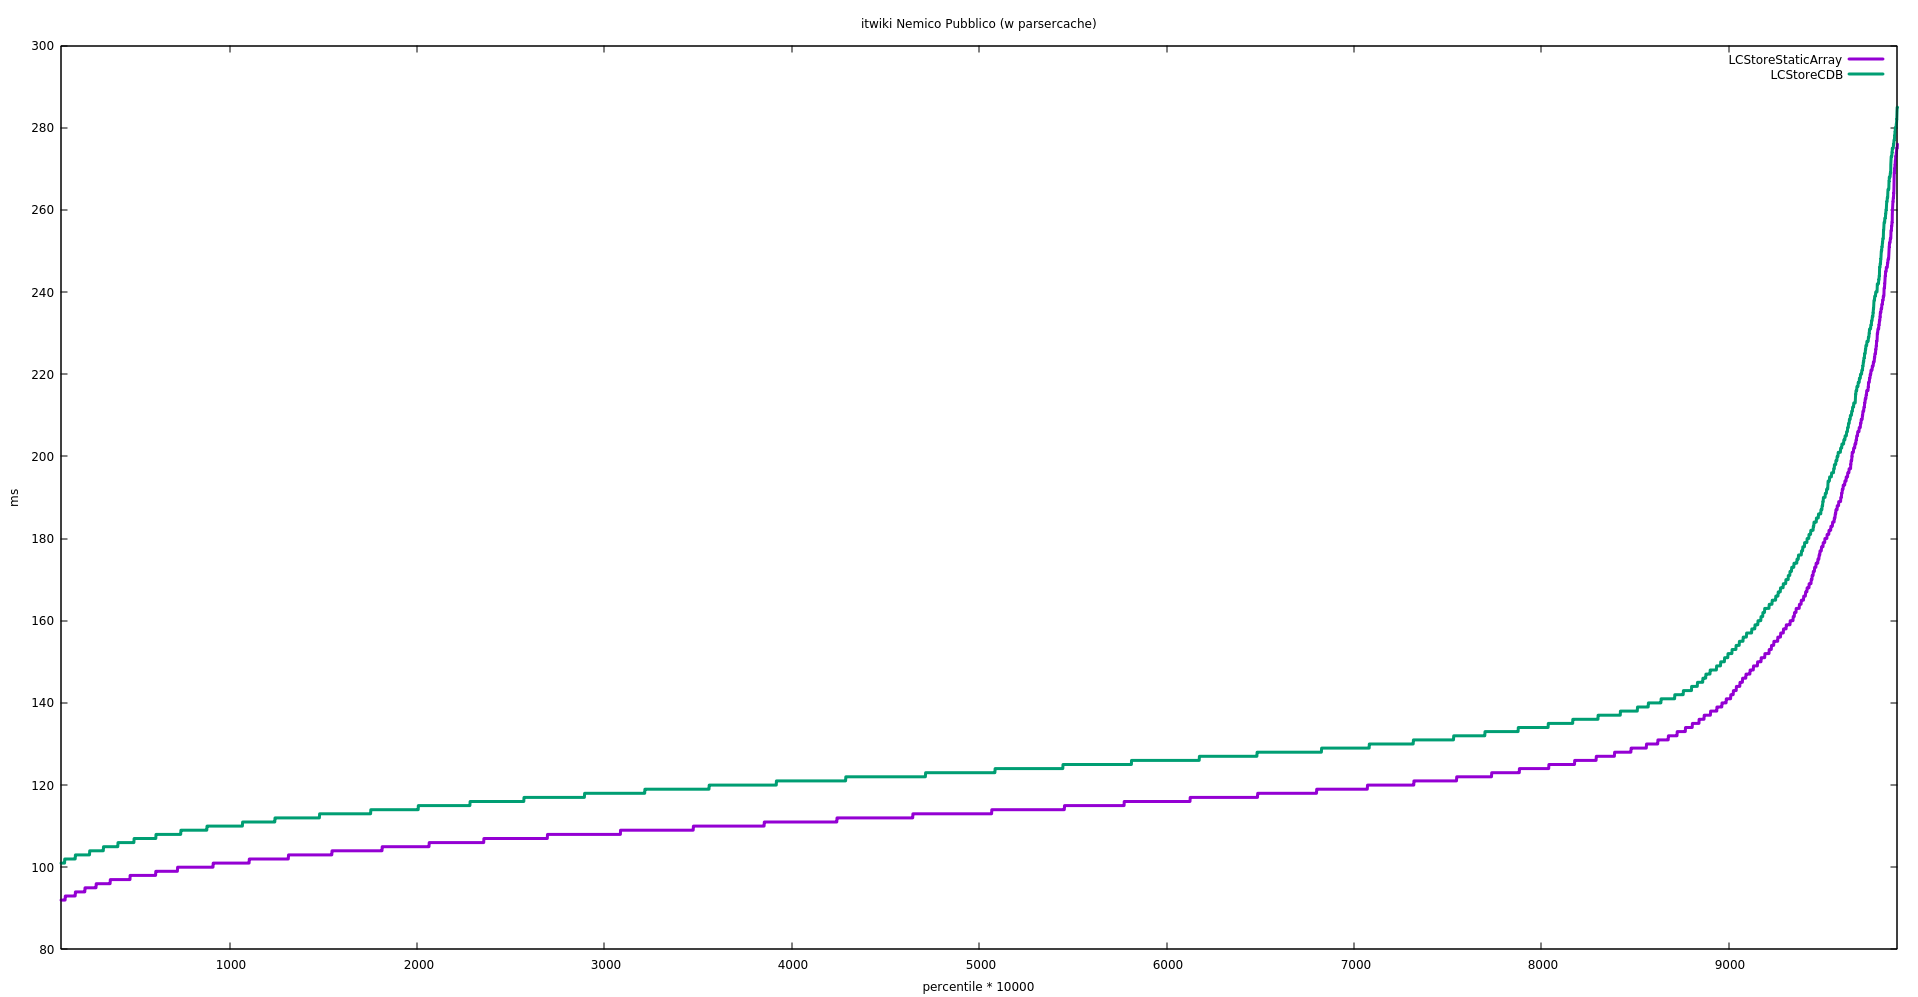
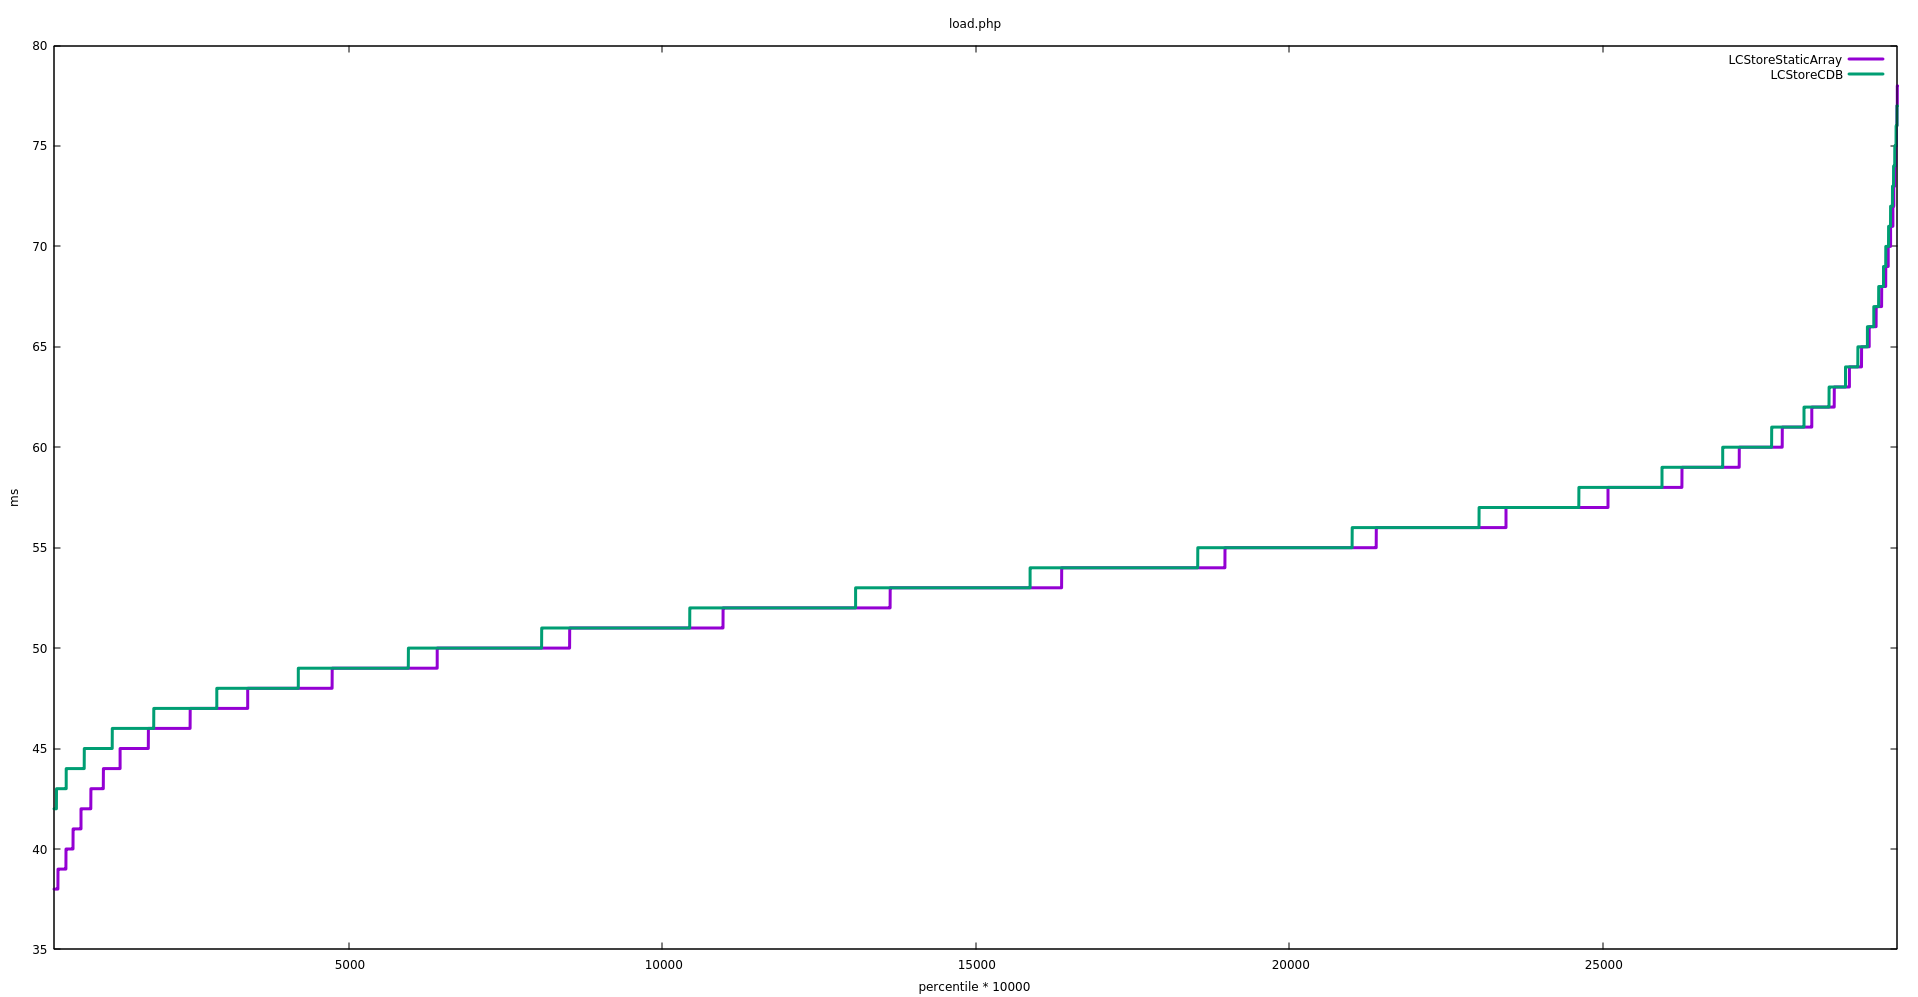
  4. Enable array format for mwdebug1001/mwdebug2001 for performance testing (establish baseline on x002, detect difference if any, confirm difference in other DC). This is temporary. Undo afterward to reduce differences between debug and prod.
  5. Enable array format for group0 (i.e. testwikis, closed, mw.org, office).
  6. Enable array format for wikidata.org in production.
  7. Enable array format for commons.wikimedia.org in production.
  8. Enable array format for group1 in production.
  9. Enable array format for group2 in production. (all wikis)
  10. Update Scap config to no longer generate the old cdb format via rebuildLocalisationCache.
  11. Remove config switch.

Details

SubjectRepoBranchLines +/-
operations/mediawiki-configmaster+15 -0
operations/mediawiki-configmaster+0 -15
mediawiki/tools/scapmaster+21 -3
operations/mediawiki-configmaster+2 -3
operations/mediawiki-configmaster+3 -2
operations/mediawiki-configmaster+3 -1
operations/mediawiki-configmaster+9 -1
operations/mediawiki-configmaster+1 -0
operations/mediawiki-configmaster+2 -0
operations/mediawiki-configmaster+5 -21
operations/mediawiki-configmaster+15 -0
mediawiki/corewmf/1.35.0-wmf.11+10 -0
mediawiki/coremaster+10 -0
mediawiki/coremaster+13 -1
operations/mediawiki-configmaster+1 -1
mediawiki/coremaster+21 -14
operations/mediawiki-configmaster+8 -0
operations/mediawiki-configmaster+5 -0
mediawiki/corewmf/1.26wmf9+147 -1
mediawiki/coremaster+147 -1
Show related patches Customize query in gerrit

Related Objects

Event Timeline

There are a very large number of changes, so older changes are hidden. Show Older Changes

@thcipriani mentioned this in T246577: Repeated deployment-mediawiki-07 socket timeouts

I'm blocking prod roll out pending investigation of this elevated memory use issue in Beta Cluster.

I'll enable it on a canary server for a while first, and work with SRE try to find any operational impact over a few hours time to see if we can find any notable differences and/or problems.

I haven't dug deep in it but I think the reason for memory usage in beta cluster is that they have more than 1000 extensions enabled (and thus they have waaay more i18n messages than in production), I doubt it would cause a big issue for production.

So it improves performance but it can't scale? Also, having the beta cluster permanently crippled is not acceptable IMHO.

I haven't dug deep in it but I think the reason for memory usage in beta cluster is that they have more than 1000 extensions enabled (and thus they have waaay more i18n messages than in production), I doubt it would cause a big issue for production.

I don't think that's the case? Beta only has a handful of extensions more than prod. It does have the meta-repo of 1000+ extensions present on disk, but afaik all setting-loading and l10n-loading stuff is just as explicit for Beta as for prod.

So it improves performance but it can't scale? Also, having the beta cluster permanently crippled is not acceptable IMHO.

The array-based approach scales quite well, but it requires a server configuration change. This is why it is not enabled for third parties by default. The server change is what we're doing in production right now, naturally ahead of it actually being enabled there.

For beta, the only impact of this change should be that it might have fewer opcache hits and recompile source code more often - untill we set the same confguration settings there.

I have yet to see aforementioned Beta issued be correlated strongly with this change. In any event, please continue that conversation on those tasks instead.

reedy@deploy1001:/srv/mediawiki-staging/php-1.35.0-wmf.22/cache/l10n$ du -h en.l10n.php 
3.7M	en.l10n.php
reedy@deploy1001:/srv/mediawiki-staging/php-1.35.0-wmf.22/cache/l10n$ du -h de.l10n.php 
4.1M	de.l10n.php
reedy@deployment-deploy01:/srv/mediawiki/php-master/cache/l10n$ du -h en.l10n.php 
3.9M	en.l10n.php
reedy@deployment-deploy01:/srv/mediawiki/php-master/cache/l10n$ du -h de.l10n.php 
4.3M	de.l10n.php

~0.2M larger on beta (per file, so it obviously adds up a bit)

reedy@deploy1001:/srv/mediawiki-staging/php-1.35.0-wmf.22/cache/l10n$ cat *.php | wc -c
1763198989
reedy@deployment-deploy01:/srv/mediawiki/php-master/cache/l10n$ cat *.php | wc -c
1838711618

It's less than 5% in total at least in disk space for the PHP files

Mentioned in SAL (#wikimedia-operations) [2020-03-17T21:54:49Z] <Krinkle> krinkle@mw2170$ disable-puppet (Testing for T99740)

In T99740#5941838, @ori wrote:

This might help:

<?php
/*
  Measure opcache memory cost of l10n cache


*/

Thanks Ori. I combined this with code from the php7adm metrics module that @Joe pointed me at (source), and ran it against an mwdebug server in Eqiad, and a (depooled) production server in Codfw.

The script includes some general MW setup to give it a more realistic base line (instead of completely empty opcache). I then executed the web request right after running php7adm /opcache-clear from the command-line. Source code at P10713.

mwdebug1001
### Initial
Opcache is enabled:     1
Opcache is full:        0
Opcache memory used:      132MB
Opcache memory free:      168MB
Opcache strings mem used: 3MB
Opcache strings mem free: 47MB
APCu mem used:          128MB
APCu mem free:          126MB

Found 836 files. Created 84 chunks of 10 files each.

### After chunk #0
Opcache memory used:     151MB / Opcache memory free:      149MB
Opcache strings mem used: 15MB / Opcache strings mem free:  35MB

### After chunk #1
Opcache memory used:     171MB / Opcache memory free:      129MB
Opcache strings mem used: 20MB / Opcache strings mem free:  30MB

### After chunk #2
Opcache memory used:     191MB / Opcache memory free:      109MB
Opcache strings mem used: 26MB / Opcache strings mem free:  24MB

### After chunk #3
Opcache memory used:     211MB / Opcache memory free:      89MB
Opcache strings mem used: 34MB / Opcache strings mem free:  16MB

### After chunk #4
Opcache memory used:     231MB / Opcache memory free:      69MB
Opcache strings mem used: 39MB / Opcache strings mem free:  11MB

### After chunk #5
Opcache memory used:     251MB / Opcache memory free:      49MB
Opcache strings mem used: 43MB / Opcache strings mem free:  7MB

### After chunk #6
Opcache memory used:     270MB / Opcache memory free:      30MB
Opcache strings mem used: 48MB / Opcache strings mem free: 2MB

### After chunk #7
Opcache memory used:     300MB / Opcache memory free:      45KB
Opcache strings mem used: 50MB / Opcache strings mem free:  32B

### After chunk #8
Opcache is full:         1 # <!--
Opcache memory used:     300MB / Opcache memory free:      45KB
Opcache strings mem used: 50MB / Opcache strings mem free:  32B

### After chunk #9
Opcache is full:         1 # <!--
Opcache memory used:     300MB / Opcache memory free:      45KB
Opcache strings mem used: 50MB / Opcache strings mem free:  32B

### After chunk #10
Opcache is full:         1 # <!--
Opcache memory used:     300MB / Opcache memory free:      45KB
Opcache strings mem used: 50MB / Opcache strings mem free:  32B

### After chunk #11
Opcache is full:         1 # <!--
Opcache memory used:     300MB / Opcache memory free:      45KB
Opcache strings mem used: 50MB / Opcache strings mem free:  32B

## After chunk #12 - 84…

This reached its limit after chunk 7/84. Upto that point, compiling 70 localisation files increased opcache mem by 168M (~2.4M per file), and string mem by 47M (~0.5M per file).

mw2170 (original)
$ php7adm /opcache-free
{"*":true}
$ curl mw2170.codfw.wmnet/w/krinkle.php -H 'Host: nl.wiktionary.org'

### Initial
Opcache is full: 0
Opcache memory used:     277MB / Opcache memory free:     747MB
Opcache strings mem used: 9MB / Opcache strings mem free: 87MB
APCu mem used:          6GB
APCu mem free:          6GB

Found 836 files. Created 84 chunks of 10 files each.

### After chunk #0
Opcache memory used:     297MB / Opcache memory free:     727MB
Opcache strings mem used: 21MB / Opcache strings mem free: 75MB

### After chunk #1
Opcache memory used:     317MB / Opcache memory free:     707MB
Opcache strings mem used: 26MB / Opcache strings mem free: 70MB

### After chunk #2
Opcache memory used:     337MB / Opcache memory free:     687MB
Opcache strings mem used: 32MB / Opcache strings mem free: 64MB

### After chunk #3
Opcache memory used:     357MB / Opcache memory free:     667MB
Opcache strings mem used: 40MB / Opcache strings mem free: 56MB

### After chunk #4
Opcache memory used:     376MB / Opcache memory free:     648MB
Opcache strings mem used: 45MB / Opcache strings mem free: 51MB

### After chunk #5
Opcache memory used:     396MB / Opcache memory free:     628MB
Opcache strings mem used: 49MB / Opcache strings mem free: 47MB

### After chunk #6
Opcache memory used:     416MB / Opcache memory free:     608MB
Opcache strings mem used: 54MB / Opcache strings mem free: 42MB

### After chunk #7
Opcache memory used:     436MB / Opcache memory free:     588MB
Opcache strings mem used: 59MB / Opcache strings mem free: 37MB

### After chunk #8
Opcache memory used:     455MB / Opcache memory free:     569MB
Opcache strings mem used: 63MB / Opcache strings mem free: 33MB

### After chunk #9
Opcache memory used:     475MB / Opcache memory free:     549MB
Opcache strings mem used: 66MB / Opcache strings mem free: 30MB

### After chunk #10
Opcache memory used:     495MB / Opcache memory free:     529MB
Opcache strings mem used: 70MB / Opcache strings mem free: 26MB

### After chunk #11
Opcache memory used:     515MB / Opcache memory free:     509MB
Opcache strings mem used: 76MB / Opcache strings mem free: 20MB

### After chunk #12
Opcache memory used:     535MB / Opcache memory free:     489MB
Opcache strings mem used: 79MB / Opcache strings mem free: 17MB

### After chunk #13
Opcache memory used:     554MB / Opcache memory free:     470MB
Opcache strings mem used: 84MB / Opcache strings mem free: 12MB

### After chunk #14
Opcache memory used:     574MB / Opcache memory free:     450MB
Opcache strings mem used: 88MB / Opcache strings mem free: 8MB

### After chunk #15
Opcache memory used:     594MB / Opcache memory free:     430MB
Opcache strings mem used: 91MB / Opcache strings mem free: 5MB

### After chunk #16
Opcache memory used:     613MB / Opcache memory free:     411MB
Opcache strings mem used: 96MB / Opcache strings mem free: 454KB

### After chunk #17
Opcache memory used:     637MB / Opcache memory free:     387MB
Opcache strings mem used: 96MB / Opcache strings mem free: 8B

### After chunk #18
Opcache memory used:     663MB / Opcache memory free:     361MB
Opcache strings mem used: 96MB / Opcache strings mem free: 8B

### After chunk #19
Opcache memory used:     687MB / Opcache memory free:     337MB
Opcache strings mem used: 96MB / Opcache strings mem free: 8B

### After chunk #20
Opcache memory used:     710MB / Opcache memory free:     314MB
Opcache strings mem used: 96MB / Opcache strings mem free: 8B

### After chunk #21
Opcache memory used:     736MB / Opcache memory free:     288MB
Opcache strings mem used: 96MB / Opcache strings mem free: 8B

### After chunk #22
Opcache memory used:     759MB / Opcache memory free:     265MB
Opcache strings mem used: 96MB / Opcache strings mem free: 8B

### After chunk #23
Opcache memory used:     786MB / Opcache memory free:     238MB
Opcache strings mem used: 96MB / Opcache strings mem free: 8B

### After chunk #24
Opcache memory used:     814MB / Opcache memory free:     210MB
Opcache strings mem used: 96MB / Opcache strings mem free: 8B

### After chunk #25
Opcache memory used:     839MB / Opcache memory free:     185MB
Opcache strings mem used: 96MB / Opcache strings mem free: 8B

### After chunk #26
Opcache memory used:     865MB / Opcache memory free:     159MB
Opcache strings mem used: 96MB / Opcache strings mem free: 8B

### After chunk #27
Opcache memory used:     887MB / Opcache memory free:     137MB
Opcache strings mem used: 96MB / Opcache strings mem free: 8B

### After chunk #28
Opcache memory used:     909MB / Opcache memory free:     115MB
Opcache strings mem used: 96MB / Opcache strings mem free: 8B

### After chunk #29
Opcache memory used:     935MB / Opcache memory free:     89MB
Opcache strings mem used: 96MB / Opcache strings mem free: 8B

### After chunk #30
Opcache memory used:     967MB / Opcache memory free:     57MB
Opcache strings mem used: 96MB / Opcache strings mem free: 8B

### After chunk #31
Opcache memory used:     991MB / Opcache memory free:     33MB
Opcache strings mem used: 96MB / Opcache strings mem free: 8B

### After chunk #32
Opcache memory used:     1016MB / Opcache memory free:     8MB
Opcache strings mem used: 96MB / Opcache strings mem free: 8B

### After chunk #33
Opcache memory used:     1023MB / Opcache memory free:     649KB
Opcache strings mem used: 96MB / Opcache strings mem free: 8B

### After chunk #34
Opcache memory used:     1023MB / Opcache memory free:     649KB
Opcache strings mem used: 96MB / Opcache strings mem free: 8B

This reached its limit after chunk 33/84. Upto that point, compiling 330 localisation files increased opcache mem by 746M (~2.2M per file), and string mem by 87M (~0.3M per file).

mw2170:/etc/php/7.2/fpm/php.ini (original)
opcache.enable = 1
opcache.interned_strings_buffer = 96
opcache.max_accelerated_files = 24000
opcache.max_wasted_percentage = 10
opcache.memory_consumption = 1024
opcache.revalidate_freq = 10
opcache.validate_timestamps = 1

I've locally bumped these to see how it would ideally consume

mw2170:/etc/php/7.2/fpm/php.ini (modified)
opcache.enable = 1
opcache.interned_strings_buffer = 960 # +800M (10x)
opcache.max_accelerated_files = 240000 # (10x)
opcache.max_wasted_percentage = 10
opcache.memory_consumption = 4096 # +3G (4x)
opcache.revalidate_freq = 10
opcache.validate_timestamps = 1
mw2170 (modified)
$ php7adm /opcache-free
{"*":true}
$ curl mw2170.codfw.wmnet/w/krinkle.php -H 'Host: nl.wiktionary.org'

### Initial
Opcache is enabled:     1
Opcache is full:        0
Opcache memory used:    2162MB / Opcache memory free:    1934MB
Opcache strings mem used:  9MB / Opcache strings mem free:  951MB

Found 836 files. Created 84 chunks of 10 files each.

### After chunk #0
Opcache memory used:     2182MB / Opcache memory free:     1914MB
Opcache strings mem used: 21MB / Opcache strings mem free: 939MB

### After chunk #1
Opcache memory used:     2201MB / Opcache memory free:     1895MB
Opcache strings mem used: 26MB / Opcache strings mem free: 934MB

### After chunk #2
Opcache memory used:     2221MB / Opcache memory free:     1875MB
Opcache strings mem used: 32MB / Opcache strings mem free: 928MB

### After chunk #3
Opcache memory used:     2241MB / Opcache memory free:     1855MB
Opcache strings mem used: 40MB / Opcache strings mem free: 920MB


### After chunk #80
Opcache memory used:     3766MB / Opcache memory free:     330MB
Opcache strings mem used: 202MB / Opcache strings mem free: 758MB

### After chunk #81
Opcache memory used:     3786MB / Opcache memory free:     310MB
Opcache strings mem used: 203MB / Opcache strings mem free: 757MB

### After chunk #82
Opcache memory used:     3806MB / Opcache memory free:     290MB
Opcache strings mem used: 203MB / Opcache strings mem free: 757MB

### After chunk #83
Opcache memory used:     3818MB / Opcache memory free:     278MB
Opcache strings mem used: 203MB / Opcache strings mem free: 757MB

This did not reach the limits. After compiling all 836 localisation files opcache mem increased by 1,656M (~2M per file), and string mem by 194M (~0.2M per file).

This seems really excessive, especially if we ever want to run in a containerized environment (where ideally we run multiple, smaller instances of php-fpm) and / or if we want to run a memcached instance on the same server where we're running php.

I'll run some numbers later today but this doesn't look acceptable at first sight.

In T99740#5977889, @Joe wrote:

This seems really excessive, especially if we ever want to run in a containerized environment (where ideally we run multiple […]

Note that I ran it based on two versions of MediaWiki. For the container, we'd only need half, or ~0.8G.

In T99740#5977889, @Joe wrote:

This seems really excessive, especially if we ever want to run in a containerized environment (where ideally we run multiple, smaller instances of php-fpm) and / or if we want to run a memcached instance on the same server where we're running php.

I'll run some numbers later today but this doesn't look acceptable at first sight.

The increase in opcache size doesn't tell us everything about overall impact on memory usage. Increasing the string buffer size can actually reduce overall memory usage, because the string buffer is shared. Most of the memory metrics exported by the kernel won't give you the full picture either. If you're worried about memory constraints, try gradually shrinking the total amount of memory available to PHP and see how low you can go before it starts paging heavily.

If this does reduce page serve time, it's going to be a bargain, even at the cost of some additional RAM.

Could this be causing T249018 on beta?

No, there is definitely no relation between the two. The opcache memory usage does not contribute to the memory calculated by php when checking the memory limit.

Is there a way to turn this function on for just a single application server? I would like to run some thorough performance tests with the two options to understand a bit better what's the real performance impact of this, and be able to give an opinion on the cost/benefits.

Specifically, I want to run tests on wiki pages and possibly shadowing real traffic.

In T99740#6031681, @Joe wrote:

Is there a way to turn this function on for just a single application server?

Yes, no problem. The cache acts standalone on each server, so there's no cross-server or split-brain concerns here. Totally fine to switch conditionally by hostname in wmf-config.

Change 587299 had a related patch set uploaded (by Krinkle; owner: Krinkle):
[operations/puppet@production] mediawiki: increase php7 opcache capacity on mw1407

https://gerrit.wikimedia.org/r/587299

Change 589674 had a related patch set uploaded (by Krinkle; owner: Krinkle):
[operations/mediawiki-config@master] Enable LCStoreStaticArray on depooled mw1407 for benchmarking

https://gerrit.wikimedia.org/r/589674

Mentioned in SAL (#wikimedia-operations) [2020-04-17T19:32:41Z] <Krinkle> Depool mw1407.eqiad.wmnet for opcache and LCStoreStaticArray testing. – T99740

Change 589674 merged by Krinkle:
[operations/mediawiki-config@master] Enable LCStoreStaticArray on depooled mw1407 for benchmarking

https://gerrit.wikimedia.org/r/589674

In T99740#6031681, @Joe wrote:

Specifically, I want to run tests on wiki pages and possibly shadowing real traffic.

I've depooled mw1407 and enabled LCStoreStaticArray in MediaWiki config there with host-specific condition (https://gerrit.wikimedia.org/r/589674). I don't want to disable puppet for several days there so whenever you're ready, apply https://gerrit.wikimedia.org/r/587299 via puppet or disable puppet and apply by hand in /etc/php/7.2/fpm/php.ini.

Confirmed via a local request and Logstash:

krinkle@mw1407:~$ curl 'http://mw1407.eqiad.wmnet/w/load.php' -H 'Host: aa.wikipedia.org' -H 'X-Wikimedia-Debug: 1; log'
Logstash
type:mediawiki host:mw1407 message:"LocalisationCache"

* DEBUG | LocalisationCache using store LCStoreStaticArray

.. which for all other hosts logs LocalisationCache using store LCStoreCDB.

Mentioned in SAL (#wikimedia-operations) [2020-04-27T11:20:59Z] <_joe_> restarted php-fpm on mw1407 to pick up enlarged opcache values, T99740

Mentioned in SAL (#wikimedia-operations) [2020-04-27T13:30:11Z] <_joe_> depooled mw1409 as well as mw1407 for further benchmarking, T99740

Mentioned in SAL (#wikimedia-operations) [2020-04-27T13:38:14Z] <_joe_> repooling both mw1407 and mw1409 for tesing T99740

After running a few benchmarks on mw1407 (where LCStoreStaticArray is used) vs mw1409 (which uses cdb files), it seemed the change made little to no difference for the following urls:

And I didn't find any significant difference in performance, so I decided to take a look at the performance of the server inside the serving pool for ~ 15 minutes. In this case, we see an improvement in performance between 1 and 5%.

quantileLCStoreArray (ms)LCStoreCDB (ms)
50153160
75219224
95495503
9916801711

Personally, if there isn't an external factor (as: better maintenance, ability to run static analysis on the code, etc), I don't consider this small performance gain to justify the changes we'd need to perform.

Namely, we will need to ensure that every full sync of the code causes a full fleet restart of php-fpm, as the 3 gb of memory we reserve for php-fpm are not enough to contain the code twice over.

Intersingly, other effect noticed:

  • CPU usage is slightly higher when using LCStoreArray
  • overall Memory usage is higher with LCStoreArray, but not significantly enough to be a worry in our current setup. Every php worker uses ~ 1 GB of memory at startup vs ~ 500k in the normal setup.

I think 5% is huge! As part of T233886 and T189966, I took many work-days to achieve similar gains, and even that is becoming harder and harder without it turning into weeks of multi-person/cross-team dependencies. These kinds of gain will decide how much work it is going to take to achieve certain consistent latencies on the new REST api for example, and also make latencies generally more consistent.

The l10n store win isn't a one-time cost difference, but it scales with call frequency (T99740#5929577). This is among the reasons why on cold cache performance varies so wildely because we have many layers of caching on top of l10n store. LocalisationCache is global per language, then MessageCache is per-wiki per-language (based on hooks and on-wiki overrides), and then there is MessageBlobStore for ResourceLoader on a per-module basis. Until recently MessageBlobStore had a dedicated DB table and nightly clean up cron. This might have been needed as much if base l10n performed better. Yet even with MessageBlobStore, the cache-miss experience is still pretty bad. The first cache miss for any module, in any language, on any wiki (1001 * 419 * 944), can currently takes upwards of 5 seconds to compute on-demand. And that's on an unstressed server. For a single JS resource. Not to mention end-user latency, HTML/wikitext processing, CSS, .. page load performance is lost before it even begins.

Aside from performance, this change also has benefits for the deployment process:

  • Generating the array files is about 4X faster than building the CDB binaries (4 min vs 1 min). – T218207#5138303
  • The arrays are about 10% smaller than CDB in terms of uncompressed file size (e.g. 3.7M per file instead of of 4.2M) . – T99740#4609279
  • When compressed as part of an image, they can presumably be much smaller still.

What we do today:

  • Scap invokes MediaWiki to gather the hundreds of i18n JSON files from core and extensions, and builds a set of large CDB binaries, one per language.
  • Scap converts CDB binaries to JSON files, with MD5 checksum files alongside them.
  • Scap rscyncs the JSON files (diff-only, compressible).
  • Scap instructs each app server to convert the JSON files back to CDB binaries, and verifies their MD5 checksum.

What we'll do instead:

  • Scap invokes MediaWiki to build a set of PHP array files.
  • Scap rsyncs the array files (diff-only, compressible).

I would expect deployments to be faster, with simpler tools. And for container images in the future to therefore be smaller and take less complexity/time to build.

In T99740#6085180, @Joe wrote:
  • overall Memory usage is higher with LCStoreArray, but not significantly enough to be a worry in our current setup. Every php worker uses ~ 1 GB of memory at startup vs ~ 500k in the normal setup.

We might be able to bring this down a bit. The opcache config I staged was optimised for benchmarking latency, not memory. I rounded the number up significantly to make sure it would definitely use opcache and not fallback to re-parsing disk reads. But, I don't know if all of that allocated space is actually needed. See https://gerrit.wikimedia.org/r/587299 and T99740#5977799.

I concur with Timo that this change does seem worthwhile from our perspective.

I think 5% is huge! As part of T233886 and T189966, I took many work-days to achieve similar gains, and even that is becoming harder and harder without it turning into weeks of multi-person/cross-team dependencies. These kinds of gain will decide how much work it is going to take to achieve certain consistent latencies on the new REST api for example, and also make latencies generally more consistent.

Let me note that the difference is well below 2% in most cases, and that it's much smaller than the variations in backend response times we see daily due to a variety of other effects, which can be in the range 5-10% or higher.

Moreover: a simple badly optimized database query costs us a 20% of performance for hours, easily, in terms of backend response times. And it doesn't require us to radically change our production environment.

I will run more extensive tests so I have more precise results, but in terms of performance evaluation, this gain is barely noticeable over a full day, and well below what we would consider significant.
It also makes the memory usage of the whole process about 3x what it is in normal operating conditions, and raises the CPU usage.

From the point of view of overall backend performance (that is what I'm talking about) this is a third-order optimization, notwithstanding whatever your perception of it is. Also, those figures above are quite un-scientific - I thought the result was lackluster enough not to justify further analysis. I'll post more precise numbers, testing over a full day on two servers restarted in the same second.

But this is not even my main reason of worry ( coming below).

The l10n store win isn't a one-time cost difference, but it scales with call frequency (T99740#5929577). This is among the reasons why on cold cache performance varies so wildely because we have many layers of caching on top of l10n store. LocalisationCache is global per language, then MessageCache is per-wiki per-language (based on hooks and on-wiki overrides), and then there is MessageBlobStore for ResourceLoader on a per-module basis. Until recently MessageBlobStore had a dedicated DB table and nightly clean up cron. This might have been needed as much if base l10n performed better. Yet even with MessageBlobStore, the cache-miss experience is still pretty bad. The first cache miss for any module, in any language, on any wiki (1001 * 419 * 944), can currently takes upwards of 5 seconds to compute on-demand. And that's on an unstressed server. For a single JS resource. Not to mention end-user latency, HTML/wikitext processing, CSS, .. page load performance is lost before it even begins.

We can't completely revisit how we deploy software for such a tail gain. I find it hard to believe that those 5 seconds are completely due to CDB files. Is that the case?
If so, I'm sure there are ways to keep that time down without polluting a single php-fpm cache with 2.5 GB of additional php data.

Aside from performance, this change also has benefits for the deployment process:

[CUT]

I would expect deployments to be faster, with simpler tools. And for container images in the future to therefore be smaller and take less complexity/time to build.

I don't think the two statements above are correct. And these are my main worries.

For scap deploys, we'll need to perform a full rolling restart of all appservers for every non sync-file change, as a single train deploy can fill the opcache up easily on a server using 3 GB of opcache.

When I proposed to do a full rolling restart at every release, it was deemed unpractical, dangerous and basically refused by the release engineering and performance teams. Let me note that this might allow us to go back to not validating opcache, which would make deployments much more atomic :)

A single deploy (for the train, but probably for most SWATs too) will require a restart, making it significantly slower than it is now. A full safe rolling restart of our application servers might take up to 5 minutes or more.

As for container images:

  • Why should they be smaller using php arrays isntead of cdb files? I would expect the opposite to be true (we're talking about compressed file sizes)
  • Having a 3 GB overhead of RAM usage would kill our ability to run much smaller installations of php-fpm in parallel, and force us to run "fat pods", which is decidedly suboptimal - kubernetes doesn't like to have to allocate very large chunks of one server's memory. Also, we'd get less available workers per server, because of the 2.5 GB memory overhead.

Basically for every pod we'd need a 3 GB opcache space + 3 GB apcu space *even before* we try to allocate workers. It's a 50% increase (from 4 GB to 6 GB) of the baseline occupied memory.

More in general, php-fpm performs better (much, much more than 1%) when you can keep its concurrency low - so much that we've discussed running multiple php-fpms with smaller footprint on a physical appserver even before we have moved to kubernetes. So increasing the memory footprint of the single daemon seems dangerous.

In T99740#6085180, @Joe wrote:
  • overall Memory usage is higher with LCStoreArray, but not significantly enough to be a worry in our current setup. Every php worker uses ~ 1 GB of memory at startup vs ~ 500k in the normal setup.

We might be able to bring this down a bit. The opcache config I staged was optimised for benchmarking latency, not memory. I rounded the number up significantly to make sure it would definitely use opcache and not fallback to re-parsing disk reads. But, I don't know if all of that allocated space is actually needed. See https://gerrit.wikimedia.org/r/587299 and T99740#5977799.

Also don't forget the 3 GB of opcache memory usage. I'll post more precise numbers in a followup.

If our problem is having a local, highly available cache of these data, we can explore other avenues, like storing those data into a local memcached on all servers, as we're thinking of installing it for other reasons. On one hand, that would make the cache be slower (possibly), but it will also allow the cache to be shared between php-fpm instances.

Anyways, given the gain seems significant, I'll run more precise tests today.

Mentioned in SAL (#wikimedia-operations) [2020-04-28T07:52:38Z] <_joe_> running benchmarks on mw1407 (LCStoreStaticArray) and mw1409 (LCStoreCDB) for T99740: restart php-fpm, pool for 5 minutes to warmup caches, then depool both servers.

Assuming we'll be ok with restarting php-fpm at every release, I reduced the amount of strings memory and opcache allocated on mw1407 from the values in the puppet patch. I am now using 300 MB of interned strings cache and 3.3 GB of opcache space. These figures can be reduced further probably.

I am now running the following tests:

  1. restart the appserver, run traffic through it for 30 minutes, evaluate if there is any significant performance gain over the whole period.
  2. run each test benchmark I listed before, in parallel on both servers (so that we can hope no external factors affect our results), with growing concurrency
  3. Repeat the above tests when reducing further the opcache usage on mw1407 *and* turning off opcache revalidation completely

First, the results of the real traffic test. These are averages over 10 minutes, starting after 20 minutes of having both servers pooled. This is an attempt at smoothing out the effects of very slow queries at higher percentiles, that can be traffic dependent.

metricLCStoreStaticArrayLCStoreCDBdiff
p50 (ms)142149-4.7%
p75 (ms)210213-1.4%
p95 (ms)462467-1.0%
rps97102-4.9%
CPU user (%)2222-
CPU system (%)32+1%
RSS (MB)*60.799+39%
Shared Mem (GB)**9.97.5+25%

* The memory used by php-fpm is measured by running:

$ ps -eo rss,command | awk 'BEGIN {mem=0} {if (/php-fpm/) { mem+=$1 }} END {print mem}'

** The shared memory is calculated by running:

master_pid=$(ps -eo pid,ppid,command | awk '{if (/php-fpm\:/ && $2 == 1) {print $1}}'); sudo pmap $master_pid | awk '{if ($4 == "zero") {c+=$2}} END {print c * 1024}'

My conclusion is that, while clearly slightly faster than LCStoreCDB, LCStoreStaticArray requires way more resources in terms of RAM usage, in particular for the shared memory that reaches almost 10 GB per php-fpm pool.

If we can tailor those numbers down a bit (for instance, reducing the size of the APC pool, and by programmatically restarting php-fpm at each release, thus removing the need for revalidating the opcache) I think the difference could be reduced to a smaller, more manageable number. I'm still unconvinced the perf gain would make it worthwile.

Joe removed Joe as the assignee of this task.Apr 28 2020, 1:57 PM

Just to be clearer: we achieved a much larger improvement in the average latency of requests by switching to persistent connections to our session storage:

application-servers-red-dashboard-latency.png (500×1 px, 24 KB)

(this is a picture from a blog post I should write about it).

With this I just mean there are easier, cheaper wins we can obtain if the goal is to improve performance. Frankly, none of the other benefits listed earlier can justify this switch IMO.

I'll report the results for the rest of the benchmarks below but I'm unassigning myself as owner of this task, and I oppose its deployment to production.

Some more data:

Rendering the enwiki Barack Obama page, with concurrency of 25, gives this response time distribution (over 10k requests - so the p99 can be found at 9900 requests):

obama_c25.png (997×1 px, 57 KB)

In this case, we don't see significant differences.

Same thing, for a lighter page (https://it.wikipedia.org/wiki/Nemico_pubblico_(film_1998))

nemico_pubblico_c25.png (997×1 px, 49 KB)

In this case, we have more differences, still well below 1% in p99

Finally, what happens when we try to load a resource via load.php, with concurrency of 40:

load_c40.png (997×1 px, 29 KB)

as you can see, differences are negligible here too.

In T99740#6089198, @Joe wrote:

Some more data:

Rendering the enwiki Barack Obama page, with concurrency of 25, gives this response time distribution (over 10k requests - so the p99 can be found at 9900 requests):

obama_c25.png (997×1 px, 57 KB)

In this case, we don't see significant differences.

Same thing, for a lighter page (https://it.wikipedia.org/wiki/Nemico_pubblico_(film_1998))

nemico_pubblico_c25.png (997×1 px, 49 KB)

In this case, we have more differences, still well below 1% in p99

Finally, what happens when we try to load a resource via load.php, with concurrency of 40:

load_c40.png (997×1 px, 29 KB)

as you can see, differences are negligible here too.

One rather random note and feel free to correct me if I'm wrong. Articles themselves are not heavy in using l10n (unless in multilingual projects like commons/wikidata). Checking Special pages or action history might yield a different result.

This is a valid point! I'll repeat the test on a special page. I focused on things that get requested the most (articles and load.php), but it makes sense we also try with a special page.

@Joe, I appreciate the effort you put in to evaluating this change! If you have the patience to put up with some more annoying kibitzing from me, I have a few questions :)

Hammering one or two pages may not be representative. The performance test should force MediaWiki to look up entries in the l10n cache at the same rate as production, and that may not happen if every request is a parser cache hit. (Timo, please correct me if I'm wrong.) It's the traffic test we ought to pay attention to.

In T99740#6088175, @Joe wrote:
metricLCStoreStaticArrayLCStoreCDBdiff
RSS (MB)*60.799+39%

Shouldn't this be -39%?

My conclusion is that, while clearly slightly faster than LCStoreCDB, LCStoreStaticArray requires way more resources in terms of RAM usage, in particular for the shared memory that reaches almost 10 GB per php-fpm pool.

A 5% improvement in p50 page load time looks pretty significant to me.

If we can tailor those numbers down a bit (for instance, reducing the size of the APC pool, and by programmatically restarting php-fpm at each release, thus removing the need for revalidating the opcache) I think the difference could be reduced to a smaller, more manageable number. I'm still unconvinced the perf gain would make it worthwile.

How do you weigh RAM vs. performance? How much RAM headroom do app servers have currently?

In T99740#6089095, @Joe wrote:

Just to be clearer: we achieved a much larger improvement in the average latency of requests by switching to persistent connections to our session storage:

application-servers-red-dashboard-latency.png (500×1 px, 24 KB)

I can't tell the effect size from this graph, and I'm not sure what point you're making. It's generally the case with performance tuning that over time you pay more for diminishing improvements, no? The opportunity cost for LCStoreStaticArray should be evaluated relative to other unrealized opportunities the Foundation could be pursuing with the same resources. If there are lower-hanging fruit, what are they?

This is a valid point! I'll repeat the test on a special page. I focused on things that get requested the most (articles and load.php), but it makes sense we also try with a special page.

Special pages with many messages, apart from Special:AllMessages of course, might be Special:Tags, Special:Gadgets and Special:Version. Pages with few messages repeated many times could be Special:SiteMatrix or any query page with high limit.

On Special:Log and the like, there can be higher variance due to things like querying for user preferences (grammatical gender especially), if I remember well from some work Tim did on it years ago.

In T99740#6089198, @Joe wrote:
  • Rendering the enwiki Barack Obama page, with concurrency of 25
  • load a resource via load.php, with concurrency of 40

I haven't confirmed it, but I suspect most interface messages used during page views are behind other layers of caching. The skin sidebar and wikitext parser both involve a good numebr of messages, but both have dedicated caches. The higher percentiles don't resemble the cache-miss scenarios per se either as these may've been warmed up in Memcached prior to the benchmark, but even if not, there is enough variance in these URLs from other factors that the outliers are likely extremes from other code paths, not LCStore.

ResourceLoader is possibly the largest consumer of interface messages (in terms of how many it fetches per http request, given it has to bundle them upfront). It has a dedicated cache and uses it for all interface messages fetched from its code paths (MessageBlobStore).

An isolated bench on the LCStore calls was already done at T99740#5929577 (see the far end of that comment), and in other comments and on other tasks. But if we want to do this with higher concurrency and in production, I'd recommend patching MW locally to disable part of Memcached.

For example, the most frequently used URL for ResourceLoader is https://en.wikipedia.org/w/load.php?modules=startup&lang=en&skin=vector&only=scripts. This is requested from every pageview in production, and requires thousands of messages (every message of every module, to determine each module URLs's version key). Below is from mwdebug1001 with an opcache patch applied, for the load.php?startup url, with 1 warmup, and 3 runs:

Scenariobackend-timing
MBS cache miss, l10n-cdb [status quo]D=1,233,018 µs, D=1,024,391 µs, D=1,022,317 µs (Grafana)
MBS cache miss, l10n-arrayD=1,005,511 µs, D=880,391 µs, D=795,582 µs

This 20%-reduced traffic is representative of the traffic we get after a new branch or other major deployment where we get these requests for each wiki/language/skin/platform combination to backfill caches (mobile/desktop * wikis * languages * skins = 2*940*310*5 = 2.9M) .

@ php-1.35.0-wmf.28/includes/resourceloader/MessageBlobStore.php
- $result = $cache->getMulti( array_values( $cacheKeys ), $curTTLs, $checkKeys );
+ $result = []; # $cache->getMulti( array_values( $cacheKeys ), $curTTLs, $checkKeys );

@ wmf-config/CommonSettings.php
- $wgLocalisationCacheConf['storeClass'] = LCStoreCDB::class;
+ $wgLocalisationCacheConf['storeClass'] = LCStoreStaticArray::class;

@Joe I admit I don't have a good understanding of the RAM cost and overhead we have. It would help to better quantify the budget/buffer/cost here.

At the risk of bringing more bad news.. The memory limit for MW web requests is 600M currently. This is set to 1.4G on Parsoid servers, and I believe the current expectation is that we'd need to apply this to other app servers before Parsoid can be used within MW. Would that be similarly concerning? Or less concerning (given per-request)?

Mentioned in SAL (#wikimedia-operations) [2020-05-06T08:02:46Z] <_joe_> restarted php-fpm with tweaked parameters on mw1407, now briefly pooling for traffic (T99740)

In T99740#6100595, @ori wrote:

@Joe, I appreciate the effort you put in to evaluating this change! If you have the patience to put up with some more annoying kibitzing from me, I have a few questions :)

Hammering one or two pages may not be representative. The performance test should force MediaWiki to look up entries in the l10n cache at the same rate as production, and that may not happen if every request is a parser cache hit. (Timo, please correct me if I'm wrong.) It's the traffic test we ought to pay attention to.

That's why I also ran a test of re-parsing where I got no big difference either, but I do agree - that's why I also ran some tests with actual production traffic.

In T99740#6088175, @Joe wrote:
metricLCStoreStaticArrayLCStoreCDBdiff
RSS (MB)*60.799+39%

Shouldn't this be -39%?

No, I twisted my fingers, it's using more memory, but it's not really relevant govien the actual numbers.

My conclusion is that, while clearly slightly faster than LCStoreCDB, LCStoreStaticArray requires way more resources in terms of RAM usage, in particular for the shared memory that reaches almost 10 GB per php-fpm pool.

A 5% improvement in p50 page load time looks pretty significant to me.

I don't think it is, given we have quite a few ongoing issues that cause the latency to spike up by more than 20% - for example, still unexplained surges in memcache request rate - for which we have no instrumentation nor - clearly - time for investigation.

See this for instance on mw1407 during a period where we had to re-pool it during a network outage that forced us to depool a whole rack of appservers:

mw1407-latency.png (795×1 px, 89 KB)

The mean latency had serveral spikes of 10-25%, and a sustained plateau, in correspondence of spikes in memcached request rates:

mw1407-memcached.png (779×1 px, 87 KB)

So: I think there are other areas we should focus on first. I would agree that in a void where we've repaired all of our larger culprits this would be a good perf gain, even if I would still be doubtful about its costs.

If we can tailor those numbers down a bit (for instance, reducing the size of the APC pool, and by programmatically restarting php-fpm at each release, thus removing the need for revalidating the opcache) I think the difference could be reduced to a smaller, more manageable number. I'm still unconvinced the perf gain would make it worthwile.

How do you weigh RAM vs. performance? How much RAM headroom do app servers have currently?

One thing all of my current and previous benchmarking has shown consistently is that php-fpm's performance degrades under higher concurrency, no matter the amount of cpu / ram /disk we throw at the problem. There are fundamental bottlenecks in php-fpm that are less severe when it's serving 50 req/s instead of 150. Being able to run 3 separated php-fpm instances on a single physical server would improve both our scalability and our latencies.

So, it's not just about where they are currently, it's where we want to get. Having such a huge memory requirement (basically, 8-10 GB for apc/lcstaticarray, plus the N GB to serve requests) would practically kill our ability to run mediawiki within kubernetes, or even to just run multiple instances per machine if we choose not to get there for some reason.

I have some ideas on how to overcome this - basically using a shared cache instead of a per-instance one, see also T244340 and T248005. but that would beg the question - is that faster than using CDB when accessing the data itself?

Anyways, this can be worked on further. Sadly, I have other priorities at the moment - but I'm happy to come back to the discussion once I have time for it again.

Basically, my precondition for seeing this in production right now would be:

  • Stop revalidating opcache (which seeems a good idea given the occasional corruptions we see anyways)
  • Rolling restart php-fpm with every scap run (this is currently supported in scap, but needs to be tested)
  • Set opcache to be what can contain one train release, not multiple ones like we do today
  • Make checks *pre-deploy* to ensure we don't get over said limit.

For instance, I was able to pool mw1407 with the following configuration:

opcache.validate_timestamps = 0
opcache.interned_strings_buffer = 300
opcache.max_accelerated_files = 15000
opcache.max_wasted_percentage = 10
opcache.memory_consumption = 2000

This would mean a 1GB increase in our current opcache memory usage, and would not impair any of our plans for containerization either, as we can probably compensate that by reducing the size of APCu anyways.

Last time I proposed to not revalidate cache and just roll-restart php-fpm everywhere there was some resistance from Release Engineering folks - but I see that as the best way forward if you want to see this to production.

Change 592867 had a related patch set uploaded (by Giuseppe Lavagetto; owner: Giuseppe Lavagetto):
[operations/mediawiki-config@master] Revert "Enable LCStoreStaticArray on depooled mw1407 for benchmarking"

https://gerrit.wikimedia.org/r/592867

Change 592867 merged by jenkins-bot:
[operations/mediawiki-config@master] Revert "Enable LCStoreStaticArray on depooled mw1407 for benchmarking"

https://gerrit.wikimedia.org/r/592867

Mentioned in SAL (#wikimedia-operations) [2020-05-06T08:43:54Z] <oblivian@deploy1001> Synchronized wmf-config/CommonSettings.php: Reverting change on mw1407 T99740 (duration: 01m 16s)

Change 630592 had a related patch set uploaded (by Thcipriani; owner: Thcipriani):
[mediawiki/tools/scap@master] Feature flag PHP L10n generation

https://gerrit.wikimedia.org/r/630592

Change 630592 merged by jenkins-bot:
[mediawiki/tools/scap@master] Feature flag PHP L10n generation

https://gerrit.wikimedia.org/r/630592

Change 651228 had a related patch set uploaded (by Ahmon Dancy; owner: Ahmon Dancy):
[operations/mediawiki-config@master] Disable PHP L10n in beta cluster

https://gerrit.wikimedia.org/r/651228

Change 651228 merged by jenkins-bot:
[operations/mediawiki-config@master] Disable PHP L10n in beta cluster

https://gerrit.wikimedia.org/r/651228

Krinkle changed the task status from Stalled to Open.Jul 28 2022, 4:05 AM
Krinkle removed Krinkle as the assignee of this task.

No longer stalled as T266055 is now resolved for prod. Un-assinging for now until it comes around as a scheduled goal.

Change 883707 had a related patch set uploaded (by Ladsgroup; author: Ladsgroup):

[operations/mediawiki-config@master] Revert "Disable PHP L10n in beta cluster"

https://gerrit.wikimedia.org/r/883707

This is somewhat important for mw-on-k8s so even if the perf gains are small, it's still a good cause to see done.

This is somewhat important for mw-on-k8s so even if the perf gains are small, it's still a good cause to see done.

Can you expand on what makes this important for mw-on-k8s?

I can't find it but I had it somewhere that serviceops mentioned this, in one of their slides as part of mw-on-k8s challenges because cdb files are too big for images and harder to maintain and build. Can't find it though :/