Page MenuHomePhabricator

MahimaSinghal (Mahima Agarwal)
User

Projects

User does not belong to any projects.

Today

  • Clear sailing ahead.

Tomorrow

  • Clear sailing ahead.

Wednesday

  • Clear sailing ahead.

User Details

User Since
Mar 5 2024, 3:51 AM (12 w, 6 d)
Availability
Available
LDAP User
Unknown
MediaWiki User
MahimaSinghal [ Global Accounts ]

Recent Activity

Yesterday

Maryann-Onyinye awarded T365487: Progress: Build a data visualization tool for the evolution of Wikipedia articles maintained by WikiProjects a Like token.
Sun, Jun 2, 8:37 PM · Outreachy (Round 28), Outreach-Programs-Projects

Wed, May 29

MahimaSinghal added a comment to T365487: Progress: Build a data visualization tool for the evolution of Wikipedia articles maintained by WikiProjects.

Week 1 : Onboarding and Readings

Wed, May 29, 11:24 AM · Outreachy (Round 28), Outreach-Programs-Projects
MahimaSinghal updated the task description for T365487: Progress: Build a data visualization tool for the evolution of Wikipedia articles maintained by WikiProjects.
Wed, May 29, 9:32 AM · Outreachy (Round 28), Outreach-Programs-Projects

Thu, May 23

MahimaSinghal updated the task description for T365487: Progress: Build a data visualization tool for the evolution of Wikipedia articles maintained by WikiProjects.
Thu, May 23, 5:32 PM · Outreachy (Round 28), Outreach-Programs-Projects
MahimaSinghal updated the task description for T365487: Progress: Build a data visualization tool for the evolution of Wikipedia articles maintained by WikiProjects.
Thu, May 23, 5:30 PM · Outreachy (Round 28), Outreach-Programs-Projects
MahimaSinghal updated the task description for T365487: Progress: Build a data visualization tool for the evolution of Wikipedia articles maintained by WikiProjects.
Thu, May 23, 5:23 PM · Outreachy (Round 28), Outreach-Programs-Projects

Apr 3 2024

MahimaSinghal added a comment to T358095: Outreachy Application Task: Tutorial for Wikipedia language-agnostic article quality modeling data.

Given that we can still edit the submitted notebook, would it be advisable to make further edits directly to it? Alternatively, if we intend to incorporate additional content beyond the original submission, should we create a new notebook for these purposes? Your guidance on the preferred approach would be appreciated.

Apr 3 2024, 9:24 AM · Outreachy (Round 28)

Mar 31 2024

MahimaSinghal added a comment to T358095: Outreachy Application Task: Tutorial for Wikipedia language-agnostic article quality modeling data.

Hey! Can someone help me with this, actually while fetching page count data, I'm getting error with yearly and weekly tags? So can only the monthly page view count be retrieved?

Mar 31 2024, 7:07 AM · Outreachy (Round 28)

Mar 26 2024

MahimaSinghal added a comment to T358095: Outreachy Application Task: Tutorial for Wikipedia language-agnostic article quality modeling data.

hello, I am not able to upload the link to my paws notebook can anyone helpme

Mar 26 2024, 11:23 AM · Outreachy (Round 28)
MahimaSinghal added a comment to T358095: Outreachy Application Task: Tutorial for Wikipedia language-agnostic article quality modeling data.

Please how do we go about recording the contribution and submitting a final application

Mar 26 2024, 11:21 AM · Outreachy (Round 28)

Mar 25 2024

MahimaSinghal added a comment to T356498: Outreachy Project: Build a data visualization tool for the evolution of Wikipedia articles maintained by WikiProjects.
Mar 25 2024, 5:34 PM · Outreachy (Round 28), Outreach-Programs-Projects
MahimaSinghal added a comment to T356498: Outreachy Project: Build a data visualization tool for the evolution of Wikipedia articles maintained by WikiProjects.

Message from the project mentors regarding submission

  • The project already has strong applicants and we will no longer provide feedback to any more applicants.
  • We are working on the feedback to applicants that shared their notebook with us by last Friday’s deadline.
  • If you have received feedback from the mentors, we recommend that you include a section in your final notebook briefly listing all the changes you made to address our comments.
  • Please remember that April 2, 2024 4pm UTC is the deadline for ALL applicants to record contributions and create a final application.

Thank you, @Pablo, for the valuable information. I would like to clarify whether we should include the feedback received and how we addressed it in the contributions recorded on the Outreachy website, or if it should only be documented in the final notebook.

@MahimaSinghal: briefly listing in your final notebook all the changes you made to address our feeback is enough.

Mar 25 2024, 5:08 PM · Outreachy (Round 28), Outreach-Programs-Projects
MahimaSinghal added a comment to T356498: Outreachy Project: Build a data visualization tool for the evolution of Wikipedia articles maintained by WikiProjects.

Message from the project mentors regarding submission

  • The project already has strong applicants and we will no longer provide feedback to any more applicants.
  • We are working on the feedback to applicants that shared their notebook with us by last Friday’s deadline.
  • If you have received feedback from the mentors, we recommend that you include a section in your final notebook briefly listing all the changes you made to address our comments.
  • Please remember that April 2, 2024 4pm UTC is the deadline for ALL applicants to record contributions and create a final application.
Mar 25 2024, 5:01 PM · Outreachy (Round 28), Outreach-Programs-Projects

Mar 23 2024

MahimaSinghal added a comment to T358412: Create tool for informative infographics from structured information from Wikimedia projects - Task A.

@Ederporto, When can we expect to receive feedback on the public-paws-notebook submission?

You all should receive the feedback via email in less than 2 hours (at 21 UTC). Sorry for the delay, we had too many applicants to review the code and could not finish yesterday.

Mar 23 2024, 7:49 PM · Outreach-Programs-Projects, Developer-Outreach, Outreachy (Round 28)
MahimaSinghal added a comment to T358412: Create tool for informative infographics from structured information from Wikimedia projects - Task A.

@Ederporto, When can we expect to receive feedback on the public-paws-notebook submission?

Mar 23 2024, 11:33 AM · Outreach-Programs-Projects, Developer-Outreach, Outreachy (Round 28)

Mar 21 2024

MahimaSinghal added a comment to T356498: Outreachy Project: Build a data visualization tool for the evolution of Wikipedia articles maintained by WikiProjects.

Hi @Pablo @Isaac @CMyrick-WMF
I hope you're all doing well. I've been working on the microtask T358095 and I'm now at the stage where I need to submit my work for review. Could you please let me know where I can submit my work for review?

Just to provide some context, here's an overview of the work I've done:

  1. Extracted page view counts for Wikipedia articles.
  2. Explored and visualized the evolution of individual articles and a sample of Climate change articles by visualizing feature values and quality scores over time.
  3. Analyzed the distribution of quality scores by year using boxplots.

I'm looking forward to receiving feedback on my work.

Thank you!
Mahima Agarwal

Hello @MahimaSinghal
Could you walk me through how you were able to complete your task?
I have extracted relevant data from the wikipedia articles now I need to visualize it. That's were I'm having challenges. Thanks.

i am also confused on what to do, can anyone wth any insight help me out please

Mar 21 2024, 3:03 PM · Outreachy (Round 28), Outreach-Programs-Projects
MahimaSinghal added a comment to T358095: Outreachy Application Task: Tutorial for Wikipedia language-agnostic article quality modeling data.

While using the mviews.api for getting the page views, I'm getting error while fetching the data for some dates. Can you please mention the exact year from which the page views data are provided?

According to the mentors, data is available as from July 2015 onwards.

Mar 21 2024, 7:02 AM · Outreachy (Round 28)

Mar 20 2024

MahimaSinghal added a comment to T358095: Outreachy Application Task: Tutorial for Wikipedia language-agnostic article quality modeling data.

Also please help me with the future analyses like do we need to write the proper code for it?

Mar 20 2024, 5:58 PM · Outreachy (Round 28)
MahimaSinghal added a comment to T358095: Outreachy Application Task: Tutorial for Wikipedia language-agnostic article quality modeling data.

While using the mviews.api for getting the page views, I'm getting error while fetching the data for some dates. Can you please mention the exact year from which the page views data are provided?

Mar 20 2024, 5:39 PM · Outreachy (Round 28)
MahimaSinghal added a comment to T358095: Outreachy Application Task: Tutorial for Wikipedia language-agnostic article quality modeling data.

Hi, are we allowed to manipulate the data for part 2? If I wanted to display page_lengths with granularity monthly, can I group page_lengths as an average for a given month? For example, a bar chart for page_lengths for 2021 with granularity monthly. X axis would be months and Y axis would be average page lengths for a given month.

Mar 20 2024, 4:28 AM · Outreachy (Round 28)

Mar 19 2024

MahimaSinghal added a comment to T358095: Outreachy Application Task: Tutorial for Wikipedia language-agnostic article quality modeling data.

Can anyone help with the image file mentioned in the given notebook, I'm not able to open it.

Hi @Gungun_Singh , please tell which image?

Screenshot (72).png (868×1 px, 128 KB)

The image file given here

Ok So this the image you are looking at:

Can anyone help with the image file mentioned in the given notebook, I'm not able to open it.

Hi @Gungun_Singh , Which image file are you talking about? Is it this?

image.png (529×1 px, 70 KB)

yes, this one only. Thanks but why isn't it showing in mine?

Mar 19 2024, 11:52 AM · Outreachy (Round 28)
MahimaSinghal added a comment to T358095: Outreachy Application Task: Tutorial for Wikipedia language-agnostic article quality modeling data.

Can anyone help with the image file mentioned in the given notebook, I'm not able to open it.

Hi @Gungun_Singh , please tell which image?

Screenshot (72).png (868×1 px, 128 KB)

The image file given here

Mar 19 2024, 11:21 AM · Outreachy (Round 28)
MahimaSinghal added a comment to T358095: Outreachy Application Task: Tutorial for Wikipedia language-agnostic article quality modeling data.

Can anyone help with the image file mentioned in the given notebook, I'm not able to open it.

Mar 19 2024, 9:42 AM · Outreachy (Round 28)
MahimaSinghal added a comment to T358095: Outreachy Application Task: Tutorial for Wikipedia language-agnostic article quality modeling data.

Hi all , I am also getting the same as @Jane_Ngethe was getting. Am i going in right direction that i am just dismissing those messages and waiting for it to complete?

Hi @Komalverma148 If you are encountering that error and just dismissing those messages, probably your file won't be saved. You will have to look at what is occupying the unnecessary space in your paws folder structure and have to remove the unnecessary files.

If you could please tell me that do i only have to look on pageviews data for Wikipedia articles from July 2015 onwards or pageviews from February 2024 only?

Mar 19 2024, 9:37 AM · Outreachy (Round 28)
MahimaSinghal added a comment to T358095: Outreachy Application Task: Tutorial for Wikipedia language-agnostic article quality modeling data.

Hi all , I am also getting the same as @Jane_Ngethe was getting. Am i going in right direction that i am just dismissing those messages and waiting for it to complete?

Mar 19 2024, 9:23 AM · Outreachy (Round 28)

Mar 18 2024

MahimaSinghal added a comment to T358095: Outreachy Application Task: Tutorial for Wikipedia language-agnostic article quality modeling data.

Screenshot from 2024-03-18 12-57-49.png (173×432 px, 17 KB)

Please, someone help me. Am getting this error whenever I try to save my changes. What could be the problem? Has anybody encountered the same?

Hi @Jane_Ngethe The error you are seeing is because the the size of your file has increased the server's file size limit.

OK. What can I do?

Mar 18 2024, 12:22 PM · Outreachy (Round 28)
MahimaSinghal added a comment to T358095: Outreachy Application Task: Tutorial for Wikipedia language-agnostic article quality modeling data.

Screenshot from 2024-03-18 12-57-49.png (173×432 px, 17 KB)

Please, someone help me. Am getting this error whenever I try to save my changes. What could be the problem? Has anybody encountered the same?

Mar 18 2024, 10:10 AM · Outreachy (Round 28)

Mar 17 2024

MahimaSinghal added a comment to T358095: Outreachy Application Task: Tutorial for Wikipedia language-agnostic article quality modeling data.

@MahimaSinghal can you assist me please?

Mar 17 2024, 3:10 PM · Outreachy (Round 28)
MahimaSinghal added a comment to T358095: Outreachy Application Task: Tutorial for Wikipedia language-agnostic article quality modeling data.

@MahimaSinghal

Have you submitted your notebook for review and feedback? We need to record it in our final application in order to get it reviewed by mentors?

@Shruti799 , In order to get our notebook reviewed by the mentors , we have to mail it to them.

Mar 17 2024, 3:07 PM · Outreachy (Round 28)

Mar 16 2024

MahimaSinghal added a comment to T358095: Outreachy Application Task: Tutorial for Wikipedia language-agnostic article quality modeling data.

@MahimaSinghal

TO DO task asked us to visualize data for feature values and quality score using different charts. I have done it using box plots. Do we need to create multiple charts like(bar charts, pie charts etc) for all the values and scores?

Mar 16 2024, 2:59 PM · Outreachy (Round 28)
MahimaSinghal added a comment to T358095: Outreachy Application Task: Tutorial for Wikipedia language-agnostic article quality modeling data.

Hello Everyone!! I'm having an error with one date :

image.png (25×720 px, 4 KB)

I tried setting the start and end dates after (2010-06-07) but still it throws the same error. I have also tried to print the output for different articles but the issue persists. Can someone please have a look at this?

What exactly are your start and end dates?

Hey Shruti, I made changes to the code and tried running for specific articles and got this as an output:

image.png (224×496 px, 8 KB)

can you please verify the pageview counts for these articles for the date specified by running your code?

Mar 16 2024, 9:38 AM · Outreachy (Round 28)

Mar 15 2024

MahimaSinghal added a comment to T358095: Outreachy Application Task: Tutorial for Wikipedia language-agnostic article quality modeling data.

@MahimaSinghal

We need to create data visualizations(box plots and charts or bars) individually for different values and scores(page_length, num_refs, num_wikilinks, num_categories, num_media, num_headings, pred_qual) by choosing any time granularity other than yearly. Am I right?

Yeah we need to create visualizations for features_values (page_length, num_refs, num_wikilinks, num_categories, num_media, num_headings) and quality scores (pred_qual). By choosing different granularities.

So, we can choose different granularities for different scores and values or do we need to create visualizations for every granularity for all the values and scores? And we can create these visualizations for any article or for all the articles?

It all depends on us whether to choose one article, all articles, one granularity, or every granularity. It is entirely our choice.

Okay. Thanks:)

Mar 15 2024, 2:02 PM · Outreachy (Round 28)
MahimaSinghal added a comment to T358095: Outreachy Application Task: Tutorial for Wikipedia language-agnostic article quality modeling data.

@MahimaSinghal

We need to create data visualizations(box plots and charts or bars) individually for different values and scores(page_length, num_refs, num_wikilinks, num_categories, num_media, num_headings, pred_qual) by choosing any time granularity other than yearly. Am I right?

Yeah we need to create visualizations for features_values (page_length, num_refs, num_wikilinks, num_categories, num_media, num_headings) and quality scores (pred_qual). By choosing different granularities.

So, we can choose different granularities for different scores and values or do we need to create visualizations for every granularity for all the values and scores? And we can create these visualizations for any article or for all the articles?

Mar 15 2024, 1:55 PM · Outreachy (Round 28)
MahimaSinghal added a comment to T358412: Create tool for informative infographics from structured information from Wikimedia projects - Task A.

Not able to generate video from the data frame? What might the reason be? As we have 7k+ columns and it's taking time can we generate a bar chart race video of only a few columns as an example?
And I read in the documentation that we should have 'ffmpeg' installed on our device as I am working on web paws Jupyter notebook and not locally do I also have to install 'ffmpeg'?

Download latest FFmpeg static build.

exist = !which ffmpeg
if not exist:

!curl https://johnvansickle.com/ffmpeg/releases/ffmpeg-release-amd64-static.tar.xz -o ffmpeg.tar.xz \
   && tar -xf ffmpeg.tar.xz && rm ffmpeg.tar.xz
ffmdir = !find . -iname ffmpeg-*-static
path = %env PATH
path = path + ':' + ffmdir[0]
%env PATH $path

!which ffmpeg
Add this code to your notebook , and you will be good to go.

Getting same error again.

Can you share the exact error, What are the errors you are getting Exactly?

KeyError Traceback (most recent call last)
File /srv/paws/lib/python3.10/site-packages/PIL/Image.py:2416, in Image.save(self, fp, format, **params)

2415 try:

-> 2416 format = EXTENSION[ext]

2417 except KeyError as e:

KeyError: '.mp4'

The above exception was the direct cause of the following exception:

ValueError Traceback (most recent call last)
File /srv/paws/lib/python3.10/site-packages/bar_chart_race/_make_chart.py:435, in _BarChartRace.make_animation(self)

434     else:

--> 435 ret_val = anim.save(self.filename, fps=self.fps, writer=self.writer)

436 except Exception as e:

File /srv/paws/lib/python3.10/site-packages/matplotlib/animation.py:1089, in Animation.save(self, filename, writer, fps, dpi, codec, bitrate, extra_args, metadata, extra_anim, savefig_kwargs, progress_callback)

1086 # canvas._is_saving = True makes the draw_event animation-starting
1087 # callback a no-op; canvas.manager = None prevents resizing the GUI
1088 # widget (both are likewise done in savefig()).

-> 1089 with writer.saving(self._fig, filename, dpi), \

1090      cbook._setattr_cm(self._fig.canvas, _is_saving=True, manager=None):
1091     for anim in all_anim:

File /usr/lib/python3.10/contextlib.py:142, in _GeneratorContextManager.exit(self, typ, value, traceback)

141 try:

--> 142 next(self.gen)

143 except StopIteration:

File /srv/paws/lib/python3.10/site-packages/matplotlib/animation.py:245, in AbstractMovieWriter.saving(self, fig, outfile, dpi, *args, **kwargs)

244 finally:

--> 245 self.finish()

File /srv/paws/lib/python3.10/site-packages/matplotlib/animation.py:515, in PillowWriter.finish(self)

514 def finish(self):

--> 515 self._frames[0].save(

516         self.outfile, save_all=True, append_images=self._frames[1:],
517         duration=int(1000 / self.fps), loop=0)

File /srv/paws/lib/python3.10/site-packages/PIL/Image.py:2419, in Image.save(self, fp, format, **params)

2418         msg = f"unknown file extension: {ext}"

-> 2419 raise ValueError(msg) from e

2421 if format.upper() not in SAVE:

ValueError: unknown file extension: .mp4

During handling of the above exception, another exception occurred:

Exception Traceback (most recent call last)
Cell In[8], line 11

 4     bcr.bar_chart_race(
 5         df=df,
 6         filename='AnalysisVideo.mp4',  
 7         title='Bar Chart Race',
 8         writer='matplotlib'
 9     )
10     return 'AnalysisVideo.mp4'

---> 11 video = dataframe_to_race_chart(first_20)

12 Video(video, embed=True)

Cell In[8], line 4, in dataframe_to_race_chart(df)

3 def dataframe_to_race_chart(df):

----> 4 bcr.bar_chart_race(

 5         df=df,
 6         filename='AnalysisVideo.mp4',  
 7         title='Bar Chart Race',
 8         writer='matplotlib'
 9     )
10     return 'AnalysisVideo.mp4'

File /srv/paws/lib/python3.10/site-packages/bar_chart_race/_make_chart.py:783, in bar_chart_race(df, filename, orientation, sort, n_bars, fixed_order, fixed_max, steps_per_period, period_length, interpolate_period, label_bars, bar_size, period_label, period_fmt, period_summary_func, perpendicular_bar_func, figsize, cmap, title, title_size, bar_label_size, tick_label_size, shared_fontdict, scale, writer, fig, dpi, bar_kwargs, filter_column_colors)

 461 '''
 462 Create an animated bar chart race using matplotlib. Data must be in 
 463 'wide' format where each row represents a single time period and each 
(...)
 776 These sizes are relative to plt.rcParams['font.size'].
 777 '''
 778 bcr = _BarChartRace(df, filename, orientation, sort, n_bars, fixed_order, fixed_max,
 779                     steps_per_period, period_length, interpolate_period, label_bars, bar_size, 
 780                     period_label, period_fmt, period_summary_func, perpendicular_bar_func, 
 781                     figsize, cmap, title, title_size, bar_label_size, tick_label_size, 
 782                     shared_fontdict, scale, writer, fig, dpi, bar_kwargs, filter_column_colors)

--> 783 return bcr.make_animation()

File /srv/paws/lib/python3.10/site-packages/bar_chart_race/_make_chart.py:446, in _BarChartRace.make_animation(self)

444     else:
445         message = str(e)

--> 446 raise Exception(message)

447 finally:
448     plt.rcParams = self.orig_rcParams

Exception: You do not have ffmpeg installed on your machine. Download

ffmpeg from here: https://www.ffmpeg.org/download.html.

Matplotlib's original error message below:

unknown file extension: .mp4

What output do you get after running this code, specific to this code block:

image.png (274×1 px, 25 KB)

If the code I provided would have executed correctly, then you should have a folder named ffmpeg in your home folder.

% Total % Received % Xferd Average Speed Time Time Time Current

Dload  Upload   Total   Spent    Left  Speed

100 39.4M 100 39.4M 0 0 144M 0 --:--:-- --:--:-- --:--:-- 145M
env: PATH=/srv/paws/pwb:/srv/paws/bin:/srv/paws:/usr/local/sbin:/usr/local/bin:/usr/sbin:/usr/bin:/sbin:/bin:/srv/openrefine:/srv/julia/bin:./ffmpeg-6.1-amd64-static
./ffmpeg-6.1-amd64-static/ffmpeg

I got this.

So this implies, you must be having a folder named ffmpeg-6.1-amd64-static in your home folder.
{F42634524}

I am only able to find ffmpeg-6.1.1 folder and I added its path to environment variable still not able to get the video. Can you please guide me step by step of installing ffmpeg again? I installed it from this link:
https://www.ffmpeg.org/download.html
Then extracted it and i got files on my laptop and then moved them to Local Disc C and then finally went to ffmpeg-6.1.1 copied its path added to environment variable right? Anything else we had to do?

If this method is not working you can try the steps mentioned by me to install ffmpeg.

Mar 15 2024, 1:53 PM · Outreach-Programs-Projects, Developer-Outreach, Outreachy (Round 28)
MahimaSinghal added a comment to T358412: Create tool for informative infographics from structured information from Wikimedia projects - Task A.

Not able to generate video from the data frame? What might the reason be? As we have 7k+ columns and it's taking time can we generate a bar chart race video of only a few columns as an example?
And I read in the documentation that we should have 'ffmpeg' installed on our device as I am working on web paws Jupyter notebook and not locally do I also have to install 'ffmpeg'?

Download latest FFmpeg static build.

exist = !which ffmpeg
if not exist:

!curl https://johnvansickle.com/ffmpeg/releases/ffmpeg-release-amd64-static.tar.xz -o ffmpeg.tar.xz \
   && tar -xf ffmpeg.tar.xz && rm ffmpeg.tar.xz
ffmdir = !find . -iname ffmpeg-*-static
path = %env PATH
path = path + ':' + ffmdir[0]
%env PATH $path

!which ffmpeg
Add this code to your notebook , and you will be good to go.

Getting same error again.

Can you share the exact error, What are the errors you are getting Exactly?

KeyError Traceback (most recent call last)
File /srv/paws/lib/python3.10/site-packages/PIL/Image.py:2416, in Image.save(self, fp, format, **params)

2415 try:

-> 2416 format = EXTENSION[ext]

2417 except KeyError as e:

KeyError: '.mp4'

The above exception was the direct cause of the following exception:

ValueError Traceback (most recent call last)
File /srv/paws/lib/python3.10/site-packages/bar_chart_race/_make_chart.py:435, in _BarChartRace.make_animation(self)

434     else:

--> 435 ret_val = anim.save(self.filename, fps=self.fps, writer=self.writer)

436 except Exception as e:

File /srv/paws/lib/python3.10/site-packages/matplotlib/animation.py:1089, in Animation.save(self, filename, writer, fps, dpi, codec, bitrate, extra_args, metadata, extra_anim, savefig_kwargs, progress_callback)

1086 # canvas._is_saving = True makes the draw_event animation-starting
1087 # callback a no-op; canvas.manager = None prevents resizing the GUI
1088 # widget (both are likewise done in savefig()).

-> 1089 with writer.saving(self._fig, filename, dpi), \

1090      cbook._setattr_cm(self._fig.canvas, _is_saving=True, manager=None):
1091     for anim in all_anim:

File /usr/lib/python3.10/contextlib.py:142, in _GeneratorContextManager.exit(self, typ, value, traceback)

141 try:

--> 142 next(self.gen)

143 except StopIteration:

File /srv/paws/lib/python3.10/site-packages/matplotlib/animation.py:245, in AbstractMovieWriter.saving(self, fig, outfile, dpi, *args, **kwargs)

244 finally:

--> 245 self.finish()

File /srv/paws/lib/python3.10/site-packages/matplotlib/animation.py:515, in PillowWriter.finish(self)

514 def finish(self):

--> 515 self._frames[0].save(

516         self.outfile, save_all=True, append_images=self._frames[1:],
517         duration=int(1000 / self.fps), loop=0)

File /srv/paws/lib/python3.10/site-packages/PIL/Image.py:2419, in Image.save(self, fp, format, **params)

2418         msg = f"unknown file extension: {ext}"

-> 2419 raise ValueError(msg) from e

2421 if format.upper() not in SAVE:

ValueError: unknown file extension: .mp4

During handling of the above exception, another exception occurred:

Exception Traceback (most recent call last)
Cell In[8], line 11

 4     bcr.bar_chart_race(
 5         df=df,
 6         filename='AnalysisVideo.mp4',  
 7         title='Bar Chart Race',
 8         writer='matplotlib'
 9     )
10     return 'AnalysisVideo.mp4'

---> 11 video = dataframe_to_race_chart(first_20)

12 Video(video, embed=True)

Cell In[8], line 4, in dataframe_to_race_chart(df)

3 def dataframe_to_race_chart(df):

----> 4 bcr.bar_chart_race(

 5         df=df,
 6         filename='AnalysisVideo.mp4',  
 7         title='Bar Chart Race',
 8         writer='matplotlib'
 9     )
10     return 'AnalysisVideo.mp4'

File /srv/paws/lib/python3.10/site-packages/bar_chart_race/_make_chart.py:783, in bar_chart_race(df, filename, orientation, sort, n_bars, fixed_order, fixed_max, steps_per_period, period_length, interpolate_period, label_bars, bar_size, period_label, period_fmt, period_summary_func, perpendicular_bar_func, figsize, cmap, title, title_size, bar_label_size, tick_label_size, shared_fontdict, scale, writer, fig, dpi, bar_kwargs, filter_column_colors)

 461 '''
 462 Create an animated bar chart race using matplotlib. Data must be in 
 463 'wide' format where each row represents a single time period and each 
(...)
 776 These sizes are relative to plt.rcParams['font.size'].
 777 '''
 778 bcr = _BarChartRace(df, filename, orientation, sort, n_bars, fixed_order, fixed_max,
 779                     steps_per_period, period_length, interpolate_period, label_bars, bar_size, 
 780                     period_label, period_fmt, period_summary_func, perpendicular_bar_func, 
 781                     figsize, cmap, title, title_size, bar_label_size, tick_label_size, 
 782                     shared_fontdict, scale, writer, fig, dpi, bar_kwargs, filter_column_colors)

--> 783 return bcr.make_animation()

File /srv/paws/lib/python3.10/site-packages/bar_chart_race/_make_chart.py:446, in _BarChartRace.make_animation(self)

444     else:
445         message = str(e)

--> 446 raise Exception(message)

447 finally:
448     plt.rcParams = self.orig_rcParams

Exception: You do not have ffmpeg installed on your machine. Download

ffmpeg from here: https://www.ffmpeg.org/download.html.

Matplotlib's original error message below:

unknown file extension: .mp4

What output do you get after running this code, specific to this code block:

image.png (274×1 px, 25 KB)

If the code I provided would have executed correctly, then you should have a folder named ffmpeg in your home folder.

% Total % Received % Xferd Average Speed Time Time Time Current

Dload  Upload   Total   Spent    Left  Speed

100 39.4M 100 39.4M 0 0 144M 0 --:--:-- --:--:-- --:--:-- 145M
env: PATH=/srv/paws/pwb:/srv/paws/bin:/srv/paws:/usr/local/sbin:/usr/local/bin:/usr/sbin:/usr/bin:/sbin:/bin:/srv/openrefine:/srv/julia/bin:./ffmpeg-6.1-amd64-static
./ffmpeg-6.1-amd64-static/ffmpeg

I got this.

So this implies, you must be having a folder named ffmpeg-6.1-amd64-static in your home folder.
{F42634524}

I am only able to find ffmpeg-6.1.1 folder and I added its path to environment variable still not able to get the video. Can you please guide me step by step of installing ffmpeg again? I installed it from this link:
https://www.ffmpeg.org/download.html
Then extracted it and i got files on my laptop and then moved them to Local Disc C and then finally went to ffmpeg-6.1.1 copied its path added to environment variable right? Anything else we had to do?

Mar 15 2024, 1:51 PM · Outreach-Programs-Projects, Developer-Outreach, Outreachy (Round 28)
MahimaSinghal added a comment to T358095: Outreachy Application Task: Tutorial for Wikipedia language-agnostic article quality modeling data.

@MahimaSinghal

We need to create data visualizations(box plots and charts or bars) individually for different values and scores(page_length, num_refs, num_wikilinks, num_categories, num_media, num_headings, pred_qual) by choosing any time granularity other than yearly. Am I right?

Mar 15 2024, 1:38 PM · Outreachy (Round 28)
MahimaSinghal added a comment to T358095: Outreachy Application Task: Tutorial for Wikipedia language-agnostic article quality modeling data.

@MahimaSinghal Can you please help me with how page views API is being used for this task?

Hi @Mitumoni_kalita ,Yeah Sure. I am more than willing to help.
PageViews API will be used in the very first TODO of this microtask. Where you have to use the API to gather pageviews count in the time period each revision was made.
You can refer to the documentation of the API here : mwviews documentation: https://github.com/mediawiki-utilities/python-mwviews.

image.png (396×1 px, 134 KB)

The above image is of the sample example given in the Notebook on how can we use the API.

The function "article_views" under PageviewsClient class already have used the pageviews count API and did all the implementation right to show pageview count of any article in the time period each revision was made ; so I didn't understand what actually we need to do under this TODO of the Microtask ? @MahimaSinghal

That is just an example, we have to do it for a sample of articles other than the two given, and we have to calculate the pageview count for every revision_timestamp.

Then what is the use of article_views function? It does the same thing right , that we are asked to do!

Mar 15 2024, 1:29 PM · Outreachy (Round 28)
MahimaSinghal added a comment to T358095: Outreachy Application Task: Tutorial for Wikipedia language-agnostic article quality modeling data.

@MahimaSinghal Can you please help me with how page views API is being used for this task?

Hi @Mitumoni_kalita ,Yeah Sure. I am more than willing to help.
PageViews API will be used in the very first TODO of this microtask. Where you have to use the API to gather pageviews count in the time period each revision was made.
You can refer to the documentation of the API here : mwviews documentation: https://github.com/mediawiki-utilities/python-mwviews.

image.png (396×1 px, 134 KB)

The above image is of the sample example given in the Notebook on how can we use the API.

The function "article_views" under PageviewsClient class already have used the pageviews count API and did all the implementation right to show pageview count of any article in the time period each revision was made ; so I didn't understand what actually we need to do under this TODO of the Microtask ? @MahimaSinghal

Mar 15 2024, 8:54 AM · Outreachy (Round 28)
MahimaSinghal added a comment to T358095: Outreachy Application Task: Tutorial for Wikipedia language-agnostic article quality modeling data.
Mar 15 2024, 8:21 AM · Outreachy (Round 28)
MahimaSinghal added a comment to T356498: Outreachy Project: Build a data visualization tool for the evolution of Wikipedia articles maintained by WikiProjects.

Hi @Pablo @Isaac @CMyrick-WMF , can you please help with how to get started with the tasks on the project. Thanks

Mar 15 2024, 8:11 AM · Outreachy (Round 28), Outreach-Programs-Projects
MahimaSinghal added a comment to T358095: Outreachy Application Task: Tutorial for Wikipedia language-agnostic article quality modeling data.

@MahimaSinghal Can you please help me with how page views API is being used for this task?

Mar 15 2024, 8:09 AM · Outreachy (Round 28)
MahimaSinghal added a comment to T358412: Create tool for informative infographics from structured information from Wikimedia projects - Task A.

Not able to generate video from the data frame? What might the reason be? As we have 7k+ columns and it's taking time can we generate a bar chart race video of only a few columns as an example?
And I read in the documentation that we should have 'ffmpeg' installed on our device as I am working on web paws Jupyter notebook and not locally do I also have to install 'ffmpeg'?

Download latest FFmpeg static build.

exist = !which ffmpeg
if not exist:

!curl https://johnvansickle.com/ffmpeg/releases/ffmpeg-release-amd64-static.tar.xz -o ffmpeg.tar.xz \
   && tar -xf ffmpeg.tar.xz && rm ffmpeg.tar.xz
ffmdir = !find . -iname ffmpeg-*-static
path = %env PATH
path = path + ':' + ffmdir[0]
%env PATH $path

!which ffmpeg
Add this code to your notebook , and you will be good to go.

Getting same error again.

Can you share the exact error, What are the errors you are getting Exactly?

KeyError Traceback (most recent call last)
File /srv/paws/lib/python3.10/site-packages/PIL/Image.py:2416, in Image.save(self, fp, format, **params)

2415 try:

-> 2416 format = EXTENSION[ext]

2417 except KeyError as e:

KeyError: '.mp4'

The above exception was the direct cause of the following exception:

ValueError Traceback (most recent call last)
File /srv/paws/lib/python3.10/site-packages/bar_chart_race/_make_chart.py:435, in _BarChartRace.make_animation(self)

434     else:

--> 435 ret_val = anim.save(self.filename, fps=self.fps, writer=self.writer)

436 except Exception as e:

File /srv/paws/lib/python3.10/site-packages/matplotlib/animation.py:1089, in Animation.save(self, filename, writer, fps, dpi, codec, bitrate, extra_args, metadata, extra_anim, savefig_kwargs, progress_callback)

1086 # canvas._is_saving = True makes the draw_event animation-starting
1087 # callback a no-op; canvas.manager = None prevents resizing the GUI
1088 # widget (both are likewise done in savefig()).

-> 1089 with writer.saving(self._fig, filename, dpi), \

1090      cbook._setattr_cm(self._fig.canvas, _is_saving=True, manager=None):
1091     for anim in all_anim:

File /usr/lib/python3.10/contextlib.py:142, in _GeneratorContextManager.exit(self, typ, value, traceback)

141 try:

--> 142 next(self.gen)

143 except StopIteration:

File /srv/paws/lib/python3.10/site-packages/matplotlib/animation.py:245, in AbstractMovieWriter.saving(self, fig, outfile, dpi, *args, **kwargs)

244 finally:

--> 245 self.finish()

File /srv/paws/lib/python3.10/site-packages/matplotlib/animation.py:515, in PillowWriter.finish(self)

514 def finish(self):

--> 515 self._frames[0].save(

516         self.outfile, save_all=True, append_images=self._frames[1:],
517         duration=int(1000 / self.fps), loop=0)

File /srv/paws/lib/python3.10/site-packages/PIL/Image.py:2419, in Image.save(self, fp, format, **params)

2418         msg = f"unknown file extension: {ext}"

-> 2419 raise ValueError(msg) from e

2421 if format.upper() not in SAVE:

ValueError: unknown file extension: .mp4

During handling of the above exception, another exception occurred:

Exception Traceback (most recent call last)
Cell In[8], line 11

 4     bcr.bar_chart_race(
 5         df=df,
 6         filename='AnalysisVideo.mp4',  
 7         title='Bar Chart Race',
 8         writer='matplotlib'
 9     )
10     return 'AnalysisVideo.mp4'

---> 11 video = dataframe_to_race_chart(first_20)

12 Video(video, embed=True)

Cell In[8], line 4, in dataframe_to_race_chart(df)

3 def dataframe_to_race_chart(df):

----> 4 bcr.bar_chart_race(

 5         df=df,
 6         filename='AnalysisVideo.mp4',  
 7         title='Bar Chart Race',
 8         writer='matplotlib'
 9     )
10     return 'AnalysisVideo.mp4'

File /srv/paws/lib/python3.10/site-packages/bar_chart_race/_make_chart.py:783, in bar_chart_race(df, filename, orientation, sort, n_bars, fixed_order, fixed_max, steps_per_period, period_length, interpolate_period, label_bars, bar_size, period_label, period_fmt, period_summary_func, perpendicular_bar_func, figsize, cmap, title, title_size, bar_label_size, tick_label_size, shared_fontdict, scale, writer, fig, dpi, bar_kwargs, filter_column_colors)

 461 '''
 462 Create an animated bar chart race using matplotlib. Data must be in 
 463 'wide' format where each row represents a single time period and each 
(...)
 776 These sizes are relative to plt.rcParams['font.size'].
 777 '''
 778 bcr = _BarChartRace(df, filename, orientation, sort, n_bars, fixed_order, fixed_max,
 779                     steps_per_period, period_length, interpolate_period, label_bars, bar_size, 
 780                     period_label, period_fmt, period_summary_func, perpendicular_bar_func, 
 781                     figsize, cmap, title, title_size, bar_label_size, tick_label_size, 
 782                     shared_fontdict, scale, writer, fig, dpi, bar_kwargs, filter_column_colors)

--> 783 return bcr.make_animation()

File /srv/paws/lib/python3.10/site-packages/bar_chart_race/_make_chart.py:446, in _BarChartRace.make_animation(self)

444     else:
445         message = str(e)

--> 446 raise Exception(message)

447 finally:
448     plt.rcParams = self.orig_rcParams

Exception: You do not have ffmpeg installed on your machine. Download

ffmpeg from here: https://www.ffmpeg.org/download.html.

Matplotlib's original error message below:

unknown file extension: .mp4

What output do you get after running this code, specific to this code block:

image.png (274×1 px, 25 KB)

If the code I provided would have executed correctly, then you should have a folder named ffmpeg in your home folder.

% Total % Received % Xferd Average Speed Time Time Time Current

Dload  Upload   Total   Spent    Left  Speed

100 39.4M 100 39.4M 0 0 144M 0 --:--:-- --:--:-- --:--:-- 145M
env: PATH=/srv/paws/pwb:/srv/paws/bin:/srv/paws:/usr/local/sbin:/usr/local/bin:/usr/sbin:/usr/bin:/sbin:/bin:/srv/openrefine:/srv/julia/bin:./ffmpeg-6.1-amd64-static
./ffmpeg-6.1-amd64-static/ffmpeg

I got this.

Mar 15 2024, 3:31 AM · Outreach-Programs-Projects, Developer-Outreach, Outreachy (Round 28)
MahimaSinghal added a comment to T358412: Create tool for informative infographics from structured information from Wikimedia projects - Task A.

Not able to generate video from the data frame? What might the reason be? As we have 7k+ columns and it's taking time can we generate a bar chart race video of only a few columns as an example?
And I read in the documentation that we should have 'ffmpeg' installed on our device as I am working on web paws Jupyter notebook and not locally do I also have to install 'ffmpeg'?

Download latest FFmpeg static build.

exist = !which ffmpeg
if not exist:

!curl https://johnvansickle.com/ffmpeg/releases/ffmpeg-release-amd64-static.tar.xz -o ffmpeg.tar.xz \
   && tar -xf ffmpeg.tar.xz && rm ffmpeg.tar.xz
ffmdir = !find . -iname ffmpeg-*-static
path = %env PATH
path = path + ':' + ffmdir[0]
%env PATH $path

!which ffmpeg
Add this code to your notebook , and you will be good to go.

Getting same error again.

Can you share the exact error, What are the errors you are getting Exactly?

KeyError Traceback (most recent call last)
File /srv/paws/lib/python3.10/site-packages/PIL/Image.py:2416, in Image.save(self, fp, format, **params)

2415 try:

-> 2416 format = EXTENSION[ext]

2417 except KeyError as e:

KeyError: '.mp4'

The above exception was the direct cause of the following exception:

ValueError Traceback (most recent call last)
File /srv/paws/lib/python3.10/site-packages/bar_chart_race/_make_chart.py:435, in _BarChartRace.make_animation(self)

434     else:

--> 435 ret_val = anim.save(self.filename, fps=self.fps, writer=self.writer)

436 except Exception as e:

File /srv/paws/lib/python3.10/site-packages/matplotlib/animation.py:1089, in Animation.save(self, filename, writer, fps, dpi, codec, bitrate, extra_args, metadata, extra_anim, savefig_kwargs, progress_callback)

1086 # canvas._is_saving = True makes the draw_event animation-starting
1087 # callback a no-op; canvas.manager = None prevents resizing the GUI
1088 # widget (both are likewise done in savefig()).

-> 1089 with writer.saving(self._fig, filename, dpi), \

1090      cbook._setattr_cm(self._fig.canvas, _is_saving=True, manager=None):
1091     for anim in all_anim:

File /usr/lib/python3.10/contextlib.py:142, in _GeneratorContextManager.exit(self, typ, value, traceback)

141 try:

--> 142 next(self.gen)

143 except StopIteration:

File /srv/paws/lib/python3.10/site-packages/matplotlib/animation.py:245, in AbstractMovieWriter.saving(self, fig, outfile, dpi, *args, **kwargs)

244 finally:

--> 245 self.finish()

File /srv/paws/lib/python3.10/site-packages/matplotlib/animation.py:515, in PillowWriter.finish(self)

514 def finish(self):

--> 515 self._frames[0].save(

516         self.outfile, save_all=True, append_images=self._frames[1:],
517         duration=int(1000 / self.fps), loop=0)

File /srv/paws/lib/python3.10/site-packages/PIL/Image.py:2419, in Image.save(self, fp, format, **params)

2418         msg = f"unknown file extension: {ext}"

-> 2419 raise ValueError(msg) from e

2421 if format.upper() not in SAVE:

ValueError: unknown file extension: .mp4

During handling of the above exception, another exception occurred:

Exception Traceback (most recent call last)
Cell In[8], line 11

 4     bcr.bar_chart_race(
 5         df=df,
 6         filename='AnalysisVideo.mp4',  
 7         title='Bar Chart Race',
 8         writer='matplotlib'
 9     )
10     return 'AnalysisVideo.mp4'

---> 11 video = dataframe_to_race_chart(first_20)

12 Video(video, embed=True)

Cell In[8], line 4, in dataframe_to_race_chart(df)

3 def dataframe_to_race_chart(df):

----> 4 bcr.bar_chart_race(

 5         df=df,
 6         filename='AnalysisVideo.mp4',  
 7         title='Bar Chart Race',
 8         writer='matplotlib'
 9     )
10     return 'AnalysisVideo.mp4'

File /srv/paws/lib/python3.10/site-packages/bar_chart_race/_make_chart.py:783, in bar_chart_race(df, filename, orientation, sort, n_bars, fixed_order, fixed_max, steps_per_period, period_length, interpolate_period, label_bars, bar_size, period_label, period_fmt, period_summary_func, perpendicular_bar_func, figsize, cmap, title, title_size, bar_label_size, tick_label_size, shared_fontdict, scale, writer, fig, dpi, bar_kwargs, filter_column_colors)

 461 '''
 462 Create an animated bar chart race using matplotlib. Data must be in 
 463 'wide' format where each row represents a single time period and each 
(...)
 776 These sizes are relative to plt.rcParams['font.size'].
 777 '''
 778 bcr = _BarChartRace(df, filename, orientation, sort, n_bars, fixed_order, fixed_max,
 779                     steps_per_period, period_length, interpolate_period, label_bars, bar_size, 
 780                     period_label, period_fmt, period_summary_func, perpendicular_bar_func, 
 781                     figsize, cmap, title, title_size, bar_label_size, tick_label_size, 
 782                     shared_fontdict, scale, writer, fig, dpi, bar_kwargs, filter_column_colors)

--> 783 return bcr.make_animation()

File /srv/paws/lib/python3.10/site-packages/bar_chart_race/_make_chart.py:446, in _BarChartRace.make_animation(self)

444     else:
445         message = str(e)

--> 446 raise Exception(message)

447 finally:
448     plt.rcParams = self.orig_rcParams

Exception: You do not have ffmpeg installed on your machine. Download

ffmpeg from here: https://www.ffmpeg.org/download.html.

Matplotlib's original error message below:

unknown file extension: .mp4
Mar 15 2024, 3:23 AM · Outreach-Programs-Projects, Developer-Outreach, Outreachy (Round 28)
MahimaSinghal added a comment to T358412: Create tool for informative infographics from structured information from Wikimedia projects - Task A.

Not able to generate video from the data frame? What might the reason be? As we have 7k+ columns and it's taking time can we generate a bar chart race video of only a few columns as an example?
And I read in the documentation that we should have 'ffmpeg' installed on our device as I am working on web paws Jupyter notebook and not locally do I also have to install 'ffmpeg'?

Download latest FFmpeg static build.

exist = !which ffmpeg
if not exist:

!curl https://johnvansickle.com/ffmpeg/releases/ffmpeg-release-amd64-static.tar.xz -o ffmpeg.tar.xz \
   && tar -xf ffmpeg.tar.xz && rm ffmpeg.tar.xz
ffmdir = !find . -iname ffmpeg-*-static
path = %env PATH
path = path + ':' + ffmdir[0]
%env PATH $path

!which ffmpeg
Add this code to your notebook , and you will be good to go.

Getting same error again.

Mar 15 2024, 2:59 AM · Outreach-Programs-Projects, Developer-Outreach, Outreachy (Round 28)
MahimaSinghal added a comment to T358412: Create tool for informative infographics from structured information from Wikimedia projects - Task A.

Actually one more problem is there, memory of the paws notebook is fixed 3GB and this work is requiring more how to increase that limit? Have all of you done without increasing the memory?

Mar 15 2024, 2:56 AM · Outreach-Programs-Projects, Developer-Outreach, Outreachy (Round 28)
MahimaSinghal added a comment to T358412: Create tool for informative infographics from structured information from Wikimedia projects - Task A.

Not able to generate video from the data frame? What might the reason be? As we have 7k+ columns and it's taking time can we generate a bar chart race video of only a few columns as an example?
And I read in the documentation that we should have 'ffmpeg' installed on our device as I am working on web paws Jupyter notebook and not locally do I also have to install 'ffmpeg'?

Mar 15 2024, 1:16 AM · Outreach-Programs-Projects, Developer-Outreach, Outreachy (Round 28)

Mar 14 2024

MahimaSinghal added a comment to T358412: Create tool for informative infographics from structured information from Wikimedia projects - Task A.

Are you including all the 7519 columns in your video 😅?

Screenshot 2024-03-14 222908.png (435×1 px, 40 KB)

This is the dataframe structure that I have generated of the cumulative sum which is sent to the bar_chart_race function, please confirm me if this is the correct structure that i have generated. let me know if I have made any error

Thank you so much to all, It worked.

How should I proceed?

Hmm, if you're including 7519 columns, it will take time. For now, just add 5 rows and 5 columns, or 10 rows by 10 columns. I think I read in the bar chart documentation that the more rows and columns you have, the longer it takes to render.Since, it generates frame by frame something like that. Also, only play the video after your cell is done running.

Great 🥳

What should I do next? record this as a contribution or send PAWS link to @Ederporto

check this message https://phabricator.wikimedia.org/T358412#9628885 by @Ederporto

Hey @Abishek_Das and @all, can someone clarify this statement made by @Ederporto, "You all have to make at least a draft proposal in the Outreachy platform by March 17th, as we will close new applications in the 18th, you can update it later, but your draft needs to be up by then."

Is it just to record a contribution or apply for the project (which comes after you've recorded your contribution).

Mar 14 2024, 8:59 PM · Outreach-Programs-Projects, Developer-Outreach, Outreachy (Round 28)
MahimaSinghal added a comment to T358412: Create tool for informative infographics from structured information from Wikimedia projects - Task A.

Screenshot 2024-03-14 at 20.49.06.png (1×1 px, 371 KB)
pls can anyone help me with this error

Can you share the code , what you wrote inside function which you are calling?

Thanks, I've fixed it. I'd restarted my kernel and forgot to rerun the imports

Mar 14 2024, 8:23 PM · Outreach-Programs-Projects, Developer-Outreach, Outreachy (Round 28)
MahimaSinghal added a comment to T358412: Create tool for informative infographics from structured information from Wikimedia projects - Task A.

Screenshot 2024-03-14 at 20.49.06.png (1×1 px, 371 KB)
pls can anyone help me with this error

Mar 14 2024, 8:08 PM · Outreach-Programs-Projects, Developer-Outreach, Outreachy (Round 28)
MahimaSinghal added a comment to T358412: Create tool for informative infographics from structured information from Wikimedia projects - Task A.

I have generated both data frames of monthly as well as daily report of January and February. But don't know the process of removing false positives. How to proceed with this?

Mar 14 2024, 8:01 PM · Outreach-Programs-Projects, Developer-Outreach, Outreachy (Round 28)
MahimaSinghal added a comment to T358412: Create tool for informative infographics from structured information from Wikimedia projects - Task A.
Mar 14 2024, 6:24 PM · Outreach-Programs-Projects, Developer-Outreach, Outreachy (Round 28)
MahimaSinghal added a comment to T358412: Create tool for informative infographics from structured information from Wikimedia projects - Task A.

Hi, I found some good examples of project timelines from past Wikimedia Outreachy interns, which may help. You can take a look at the links below:

https://phabricator.wikimedia.org/T161670
https://phabricator.wikimedia.org/T177507
https://phabricator.wikimedia.org/T333790

Mar 14 2024, 2:37 PM · Outreach-Programs-Projects, Developer-Outreach, Outreachy (Round 28)
MahimaSinghal added a comment to T358412: Create tool for informative infographics from structured information from Wikimedia projects - Task A.

@Ederporto Could you please provide a timeline of the work we plan to accomplish on the project, outlining the tasks we will complete at each step.

Mar 14 2024, 12:44 PM · Outreach-Programs-Projects, Developer-Outreach, Outreachy (Round 28)
MahimaSinghal added a comment to T358412: Create tool for informative infographics from structured information from Wikimedia projects - Task A.

@Mitumoni_kalita
If displaying the graph is taking too much time, you can expedite the process by using a shorter dataframe. You can achieve this by utilizing the cum_sum_df.iloc[:,:20] slice, limiting the dataframe to the first 20 columns. This adjustment should streamline the graph generation process and allow for quicker visualization.

Mar 14 2024, 12:04 PM · Outreach-Programs-Projects, Developer-Outreach, Outreachy (Round 28)
MahimaSinghal added a comment to T358412: Create tool for informative infographics from structured information from Wikimedia projects - Task A.

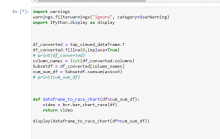
import warnings
warnings.filterwarnings("ignore", category=UserWarning)
import IPython.display as display

df_converted = top_viewed_dataframe.T
df_converted.fillna(0,inplace=True)

print(df_converted)

column_names = list(df_converted.columns)
Subsetdf = df_converted[column_names]
cum_sum_df = Subsetdf.cumsum(axis=0)

print(cum_sum_df)

def dataframe_to_race_chart(df=cum_sum_df):

video = bcr.bar_chart_race(df)
return video

dataframe_to_race_chart(df=cum_sum_df)

Mar 14 2024, 11:53 AM · Outreach-Programs-Projects, Developer-Outreach, Outreachy (Round 28)
MahimaSinghal added a comment to T358412: Create tool for informative infographics from structured information from Wikimedia projects - Task A.
Mar 14 2024, 10:41 AM · Outreach-Programs-Projects, Developer-Outreach, Outreachy (Round 28)
MahimaSinghal added a comment to T358412: Create tool for informative infographics from structured information from Wikimedia projects - Task A.

Screenshot 2024-03-14 160452.png (398×819 px, 23 KB)

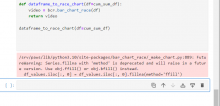
While implementing the same code in PAWS, I encountered this warning.

Mar 14 2024, 10:38 AM · Outreach-Programs-Projects, Developer-Outreach, Outreachy (Round 28)
MahimaSinghal added a comment to T358412: Create tool for informative infographics from structured information from Wikimedia projects - Task A.

Screenshot 2024-03-14 154850.png (485×767 px, 29 KB)

Please help me out, unable to get it correct!

Mar 14 2024, 10:21 AM · Outreach-Programs-Projects, Developer-Outreach, Outreachy (Round 28)
MahimaSinghal added a comment to T358412: Create tool for informative infographics from structured information from Wikimedia projects - Task A.

No

Mar 14 2024, 10:16 AM · Outreach-Programs-Projects, Developer-Outreach, Outreachy (Round 28)
MahimaSinghal added a comment to T358412: Create tool for informative infographics from structured information from Wikimedia projects - Task A.

No

Mar 14 2024, 10:15 AM · Outreach-Programs-Projects, Developer-Outreach, Outreachy (Round 28)
MahimaSinghal added a comment to T358412: Create tool for informative infographics from structured information from Wikimedia projects - Task A.

But still unable to get the video

Mar 14 2024, 9:58 AM · Outreach-Programs-Projects, Developer-Outreach, Outreachy (Round 28)
MahimaSinghal added a comment to T358412: Create tool for informative infographics from structured information from Wikimedia projects - Task A.

Screenshot 2024-03-14 143830.png (511×1 px, 36 KB)

I have tried implementing bar-chart-race locally on my machine as well as also tried on PAWS as one of the applicant advised above , but unable to play the video. Can anyone here help me with this issue and rectify my error?
@Ederporto

You will have to return the video from the function, and then when you will call the function, video will display.

I think it is not due to any error, but you will have to return the video from the function.

Screenshot 2024-03-14 143830.png (511×1 px, 36 KB)

I have tried implementing bar-chart-race locally on my machine as well as also tried on PAWS as one of the applicant advised above , but unable to play the video. Can anyone here help me with this issue and rectify my error?
@Ederporto

You will have to return the video from the function, and then when you will call the function, video will display.

Videos don't need to be returned, with the function bcr.bar_chart_race(…), the video is created automatically in the current directory

Yeah but if you want to display it on jupyter notebook, and if you have made a function, then you will have to return it. This is what worked for me.

That's interesting, any code example

Simply save the video in a variable and return it.

Mar 14 2024, 9:57 AM · Outreach-Programs-Projects, Developer-Outreach, Outreachy (Round 28)
MahimaSinghal added a comment to T358412: Create tool for informative infographics from structured information from Wikimedia projects - Task A.

Screenshot 2024-03-14 143830.png (511×1 px, 36 KB)

I have tried implementing bar-chart-race locally on my machine as well as also tried on PAWS as one of the applicant advised above , but unable to play the video. Can anyone here help me with this issue and rectify my error?
@Ederporto

You will have to return the video from the function, and then when you will call the function, video will display.

I think it is not due to any error, but you will have to return the video from the function.

Screenshot 2024-03-14 143830.png (511×1 px, 36 KB)

I have tried implementing bar-chart-race locally on my machine as well as also tried on PAWS as one of the applicant advised above , but unable to play the video. Can anyone here help me with this issue and rectify my error?
@Ederporto

You will have to return the video from the function, and then when you will call the function, video will display.

Videos don't need to be returned, with the function bcr.bar_chart_race(…), the video is created automatically in the current directory

Yeah but if you want to display it on jupyter notebook, and if you have made a function, then you will have to return it. This is what worked for me.

That's interesting, any code example

Simply save the video in a variable and return it.

Mar 14 2024, 9:48 AM · Outreach-Programs-Projects, Developer-Outreach, Outreachy (Round 28)
MahimaSinghal added a comment to T358412: Create tool for informative infographics from structured information from Wikimedia projects - Task A.

Screenshot 2024-03-14 143830.png (511×1 px, 36 KB)

I have tried implementing bar-chart-race locally on my machine as well as also tried on PAWS as one of the applicant advised above , but unable to play the video. Can anyone here help me with this issue and rectify my error?
@Ederporto

You will have to return the video from the function, and then when you will call the function, video will display.

Mar 14 2024, 9:43 AM · Outreach-Programs-Projects, Developer-Outreach, Outreachy (Round 28)
MahimaSinghal added a comment to T358412: Create tool for informative infographics from structured information from Wikimedia projects - Task A.

Screenshot 2024-03-14 143830.png (511×1 px, 36 KB)

I have tried implementing bar-chart-race locally on my machine as well as also tried on PAWS as one of the applicant advised above , but unable to play the video. Can anyone here help me with this issue and rectify my error?
@Ederporto

You will have to return the video from the function, and then when you will call the function, video will display.

Mar 14 2024, 9:35 AM · Outreach-Programs-Projects, Developer-Outreach, Outreachy (Round 28)
MahimaSinghal added a comment to T358412: Create tool for informative infographics from structured information from Wikimedia projects - Task A.

Screenshot 2024-03-14 143830.png (511×1 px, 36 KB)

I have tried implementing bar-chart-race locally on my machine as well as also tried on PAWS as one of the applicant advised above , but unable to play the video. Can anyone here help me with this issue and rectify my error?
@Ederporto

Mar 14 2024, 9:31 AM · Outreach-Programs-Projects, Developer-Outreach, Outreachy (Round 28)

Mar 13 2024

MahimaSinghal added a comment to T358095: Outreachy Application Task: Tutorial for Wikipedia language-agnostic article quality modeling data.

I changed the time granularity from monthly to daily but still no data found and error message was displayed.

Screenshot 2024-03-12 212902.png (258×1 px, 84 KB)

Is data not available for revision timestamps? Because whenever I manually enter the start and end dates for some recent years, then the page views count is displayed. This is the screenshot for manually entered time frame.

Screenshot 2024-03-12 214107.png (630×797 px, 103 KB)

I suggest fetching data from the Wikimedia API by providing two consecutive revision timestamps: one as the start timestamp and the other as the end timestamp. Set the granularity to daily and check if data is available. You may not receive data for the first two timestamps, but you can attempt retrieval for subsequent timestamps.

I tried it for the same two articles but still got the same error as above. Fetched the timestamps, sorted it to check for two consecutive timestamps but still no data was displayed.

You'll need to run a loop and check; eventually, you'll get data for some timestamps. For instance, when I was fetching pageviews count for the article "100% Renewable Energy," I didn't receive data for many starting revision timestamps—approximately 50-60 timestamps or even more. However, continuing the loop for each revision timestamp will eventually yield data.

I ran a loop and got this.

Screenshot 2024-03-12 225120.png (151×1 px, 48 KB)

Yes, if you use a try-catch block, your code won't halt upon encountering such errors; it will handle them and proceed to the next timestamp. Even if you receive the same traceback for multiple timestamps, the loop shouldn't terminate prematurely due to errors. By handling errors appropriately, the loop will continue execution, eventually retrieving data for some timestamps. From the screenshot you shared, it seems like your loop terminated at the first timestamp due to an unhandled error.

I have used try-catch block inside my loop for each iteration, but the output shows error message for all the dates, loop did continue execution as I have got a lot of error messages for dates starting from year 2001 to 2007, but it didn't find any data as the count is not displayed anywhere in my output.

If the code continues execution after encountering errors within the try-catch block, it implies that the errors are being caught and handled properly, allowing the loop to proceed to the next iteration. However, if you're not seeing any output or results, it suggests that there might be issues with how you're handling the data or storing the page views count.
Insert print statements within the try block to print out the page views count or any relevant variables before and after the code that might be causing errors. This will help you verify whether the code within the try block is executing as expected and whether any data is being retrieved.

I was not getting any data at all for the two articles(Albedo and Agriculture), so I tried for other articles and finally got some data for certain timestamps. Thank you:)
{F42602865}

Mar 13 2024, 7:15 PM · Outreachy (Round 28)
MahimaSinghal added a comment to T358095: Outreachy Application Task: Tutorial for Wikipedia language-agnostic article quality modeling data.

I changed the time granularity from monthly to daily but still no data found and error message was displayed.

Screenshot 2024-03-12 212902.png (258×1 px, 84 KB)

Is data not available for revision timestamps? Because whenever I manually enter the start and end dates for some recent years, then the page views count is displayed. This is the screenshot for manually entered time frame.

Screenshot 2024-03-12 214107.png (630×797 px, 103 KB)

I suggest fetching data from the Wikimedia API by providing two consecutive revision timestamps: one as the start timestamp and the other as the end timestamp. Set the granularity to daily and check if data is available. You may not receive data for the first two timestamps, but you can attempt retrieval for subsequent timestamps.

I tried it for the same two articles but still got the same error as above. Fetched the timestamps, sorted it to check for two consecutive timestamps but still no data was displayed.

You'll need to run a loop and check; eventually, you'll get data for some timestamps. For instance, when I was fetching pageviews count for the article "100% Renewable Energy," I didn't receive data for many starting revision timestamps—approximately 50-60 timestamps or even more. However, continuing the loop for each revision timestamp will eventually yield data.

I ran a loop and got this.

Screenshot 2024-03-12 225120.png (151×1 px, 48 KB)

Yes, if you use a try-catch block, your code won't halt upon encountering such errors; it will handle them and proceed to the next timestamp. Even if you receive the same traceback for multiple timestamps, the loop shouldn't terminate prematurely due to errors. By handling errors appropriately, the loop will continue execution, eventually retrieving data for some timestamps. From the screenshot you shared, it seems like your loop terminated at the first timestamp due to an unhandled error.

I have used try-catch block inside my loop for each iteration, but the output shows error message for all the dates, loop did continue execution as I have got a lot of error messages for dates starting from year 2001 to 2007, but it didn't find any data as the count is not displayed anywhere in my output.

Mar 13 2024, 4:53 PM · Outreachy (Round 28)
MahimaSinghal added a comment to T358412: Create tool for informative infographics from structured information from Wikimedia projects - Task A.

@all project 2 microtask A, I am not able to execute the second command to find "A function to get a dataframe of the most viewed articles in the Portuguese Wikipedia for the period of January 1st, 2024 and February 29th, 2024"
As we have API's of finding most viewed articles per day , or for the whole month combined. How to get so many top viewed articles for everyday in January and February?
Mentor @Ederporto please help me out.

Mar 13 2024, 12:36 PM · Outreach-Programs-Projects, Developer-Outreach, Outreachy (Round 28)
MahimaSinghal added a comment to T358412: Create tool for informative infographics from structured information from Wikimedia projects - Task A.

#TODO: add parameters as necessary
def most_viewed_ptwiki_jan():

  1. return a sorted list of the most viewed articles in the Portuguese Wikipedia from the top to the bottom url = "https://wikimedia.org/api/rest_v1/metrics/pageviews/top/pt.wikipedia.org/all-access/2024/01/all-days" headers = { "User-Agent": user_agent } try: response = requests.get(url, headers=headers) response.raise_for_status() # Raise an exception for 4xx or 5xx status codes data = response.json() articles = [article['article'] for article in data['items'][0]['articles']] return articles[:num_articles] except requests.RequestException as e: print("Error making request:", e) except ValueError as e: print("Error decoding JSON response:", e) print("Response content:", response.text)

wrote this function for getting most views in january but its giving error since yesterday and I am not able to understand my mistake.

The error might be due to the inclusion of the word "all-days" in the URL. This part is not required as it's not a valid parameter for the endpoint you are trying to access. Can you please share the documentation from where yo read to give this as a parameter .

the all-days word is valid if you want to get views for a whole month.

You have a quotation mark at the end of your URL. Remove it and you will get the results. This is how your link appears in my browser https://wikimedia.org/api/rest_v1/metrics/pageviews/top/pt.wikipedia.org/all-access/2024/01/all-days%22. the %22 is a quotation mark

Mar 13 2024, 5:01 AM · Outreach-Programs-Projects, Developer-Outreach, Outreachy (Round 28)
MahimaSinghal added a comment to T358412: Create tool for informative infographics from structured information from Wikimedia projects - Task A.

#TODO: add parameters as necessary
def most_viewed_ptwiki_jan():

  1. return a sorted list of the most viewed articles in the Portuguese Wikipedia from the top to the bottom url = "https://wikimedia.org/api/rest_v1/metrics/pageviews/top/pt.wikipedia.org/all-access/2024/01/all-days"
Mar 13 2024, 4:59 AM · Outreach-Programs-Projects, Developer-Outreach, Outreachy (Round 28)
MahimaSinghal added a comment to T358412: Create tool for informative infographics from structured information from Wikimedia projects - Task A.

#TODO: add parameters as necessary
def most_viewed_ptwiki_jan():

  1. return a sorted list of the most viewed articles in the Portuguese Wikipedia from the top to the bottom url = "https://wikimedia.org/api/rest_v1/metrics/pageviews/top/pt.wikipedia.org/all-access/2024/01/all-days" headers = { "User-Agent": user_agent } try: response = requests.get(url, headers=headers) response.raise_for_status() # Raise an exception for 4xx or 5xx status codes data = response.json() articles = [article['article'] for article in data['items'][0]['articles']] return articles[:num_articles] except requests.RequestException as e: print("Error making request:", e) except ValueError as e: print("Error decoding JSON response:", e) print("Response content:", response.text)

wrote this function for getting most views in january but its giving error since yesterday and I am not able to understand my mistake.

The error might be due to the inclusion of the word "all-days" in the URL. This part is not required as it's not a valid parameter for the endpoint you are trying to access. Can you please share the documentation from where yo read to give this as a parameter .

the all-days word is valid if you want to get views for a whole month.

Mar 13 2024, 4:47 AM · Outreach-Programs-Projects, Developer-Outreach, Outreachy (Round 28)
MahimaSinghal added a comment to T358412: Create tool for informative infographics from structured information from Wikimedia projects - Task A.

#TODO: add parameters as necessary
def most_viewed_ptwiki_jan():

  1. return a sorted list of the most viewed articles in the Portuguese Wikipedia from the top to the bottom url = "https://wikimedia.org/api/rest_v1/metrics/pageviews/top/pt.wikipedia.org/all-access/2024/01/all-days" headers = { "User-Agent": user_agent } try: response = requests.get(url, headers=headers) response.raise_for_status() # Raise an exception for 4xx or 5xx status codes data = response.json() articles = [article['article'] for article in data['items'][0]['articles']] return articles[:num_articles] except requests.RequestException as e: print("Error making request:", e) except ValueError as e: print("Error decoding JSON response:", e) print("Response content:", response.text)

wrote this function for getting most views in january but its giving error since yesterday and I am not able to understand my mistake.

Mar 13 2024, 3:15 AM · Outreach-Programs-Projects, Developer-Outreach, Outreachy (Round 28)

Mar 12 2024

MahimaSinghal added a comment to T358412: Create tool for informative infographics from structured information from Wikimedia projects - Task A.

Had a doubt, I was asked to complete task T358412 , when i landed on this page I found the task T357409 and after learning and research I have done most part of it. Am I in the right direction or not? Mentor @Ederporto please help me.

Mar 12 2024, 5:38 PM · Outreach-Programs-Projects, Developer-Outreach, Outreachy (Round 28)
MahimaSinghal added a comment to T358095: Outreachy Application Task: Tutorial for Wikipedia language-agnostic article quality modeling data.

I changed the time granularity from monthly to daily but still no data found and error message was displayed.

Screenshot 2024-03-12 212902.png (258×1 px, 84 KB)

Is data not available for revision timestamps? Because whenever I manually enter the start and end dates for some recent years, then the page views count is displayed. This is the screenshot for manually entered time frame.

Screenshot 2024-03-12 214107.png (630×797 px, 103 KB)

I suggest fetching data from the Wikimedia API by providing two consecutive revision timestamps: one as the start timestamp and the other as the end timestamp. Set the granularity to daily and check if data is available. You may not receive data for the first two timestamps, but you can attempt retrieval for subsequent timestamps.

I tried it for the same two articles but still got the same error as above. Fetched the timestamps, sorted it to check for two consecutive timestamps but still no data was displayed.

You'll need to run a loop and check; eventually, you'll get data for some timestamps. For instance, when I was fetching pageviews count for the article "100% Renewable Energy," I didn't receive data for many starting revision timestamps—approximately 50-60 timestamps or even more. However, continuing the loop for each revision timestamp will eventually yield data.

I ran a loop and got this.

Screenshot 2024-03-12 225120.png (151×1 px, 48 KB)

Yes, if you use a try-catch block, your code won't halt upon encountering such errors; it will handle them and proceed to the next timestamp. Even if you receive the same traceback for multiple timestamps, the loop shouldn't terminate prematurely due to errors. By handling errors appropriately, the loop will continue execution, eventually retrieving data for some timestamps. From the screenshot you shared, it seems like your loop terminated at the first timestamp due to an unhandled error.

Mar 12 2024, 5:31 PM · Outreachy (Round 28)
MahimaSinghal added a comment to T358095: Outreachy Application Task: Tutorial for Wikipedia language-agnostic article quality modeling data.

I changed the time granularity from monthly to daily but still no data found and error message was displayed.

Screenshot 2024-03-12 212902.png (258×1 px, 84 KB)

Is data not available for revision timestamps? Because whenever I manually enter the start and end dates for some recent years, then the page views count is displayed. This is the screenshot for manually entered time frame.

Mar 12 2024, 4:47 PM · Outreachy (Round 28)
MahimaSinghal added a comment to T356498: Outreachy Project: Build a data visualization tool for the evolution of Wikipedia articles maintained by WikiProjects.

Hi @Pablo @Isaac @CMyrick-WMF
I hope you're all doing well. I've been working on the microtask T358095 and I'm now at the stage where I need to submit my work for review. Could you please let me know where I can submit my work for review?

Just to provide some context, here's an overview of the work I've done:

  1. Extracted page view counts for Wikipedia articles.
  2. Explored and visualized the evolution of individual articles and a sample of Climate change articles by visualizing feature values and quality scores over time.
  3. Analyzed the distribution of quality scores by year using boxplots.

I'm looking forward to receiving feedback on my work.

Thank you!
Mahima Agarwal

Hello @MahimaSinghal
Could you walk me through how you were able to complete your task?
I have extracted relevant data from the wikipedia articles now I need to visualize it. That's were I'm having challenges. Thanks.

Hello ,

Of course, I'd be happy to help!

Firstly, could you please provide me with more details about the data you've extracted? And the challenges you are facing.
It would be helpful to know which specific features or metrics you're looking to visualize.

Once I have a better understanding of what challenges are facing you exactly, I can suggest something better.
Feel free to ask any questions along the way, and I'll do my best to help you!

Thankyou!
Mahima.

Hey Mahima,
Trust you're doing okay?
So regarding my progress on this task, this is where I'm at right now. Here: https://public-paws.wmcloud.org/User:Victor%20Ebuka96/Project1(T358095).ipynb

I need help on how to proceed with visualizing this data.

Any tip will be highly appreciated.

I think you are missing on first TODO , before proceeding to Data Visualization there is the task of using API to gather pageviews count for all revision timestamps.

Hi,
Oh, yes. I missed out on that.
Could you put me through how to go about it? That is using the API to gather pageviews count in the time period each revision was made.

Mar 12 2024, 4:26 PM · Outreachy (Round 28), Outreach-Programs-Projects
MahimaSinghal added a comment to T358095: Outreachy Application Task: Tutorial for Wikipedia language-agnostic article quality modeling data.

I changed the time granularity from monthly to daily but still no data found and error message was displayed.

Screenshot 2024-03-12 212902.png (258×1 px, 84 KB)

Is data not available for revision timestamps? Because whenever I manually enter the start and end dates for some recent years, then the page views count is displayed. This is the screenshot for manually entered time frame.

Screenshot 2024-03-12 214107.png (630×797 px, 103 KB)

I suggest fetching data from the Wikimedia API by providing two consecutive revision timestamps: one as the start timestamp and the other as the end timestamp. Set the granularity to daily and check if data is available. You may not receive data for the first two timestamps, but you can attempt retrieval for subsequent timestamps.

Mar 12 2024, 4:21 PM · Outreachy (Round 28)
MahimaSinghal added a comment to T358095: Outreachy Application Task: Tutorial for Wikipedia language-agnostic article quality modeling data.

question.PNG (435×1 px, 47 KB)
Hello everyone. Please can anyone explain the idea or logic of having a revision for an article on the same day within short time intervals?
Could it be that it was reviewed then updated and reviewed again?

Could be. or different editors reviewed it.

Even if the revision for an article was on the same day within short time intervals , it might have significant changes in the feature values like num_ref or num_wikilinks and other features as well.

Mar 12 2024, 7:33 AM · Outreachy (Round 28)
MahimaSinghal added a comment to T358095: Outreachy Application Task: Tutorial for Wikipedia language-agnostic article quality modeling data.

question.PNG (435×1 px, 47 KB)
Hello everyone. Please can anyone explain the idea or logic of having a revision for an article on the same day within short time intervals?
Could it be that it was reviewed then updated and reviewed again?

Could be. or different editors reviewed it.

Even if the revision for an article was on the same day within short time intervals , it might have significant changes in the feature values like num_ref or num_wikilinks and other features as well.

Mar 12 2024, 7:32 AM · Outreachy (Round 28)

Mar 11 2024

MahimaSinghal added a comment to T358095: Outreachy Application Task: Tutorial for Wikipedia language-agnostic article quality modeling data.

Hi, I keep having error with my try-except code. Is like basically every date in the revision_timestamp returns an error.
This is despite me converting the column to a date_time and then string format to make the API call ready for comparison.
The date displayed on the screenshot are outside the date range included in the API call function.

Screenshot1_error_try-catch.png (256×623 px, 6 KB)

Mar 11 2024, 8:58 PM · Outreachy (Round 28)
MahimaSinghal added a comment to T358095: Outreachy Application Task: Tutorial for Wikipedia language-agnostic article quality modeling data.

I manually set the start and end dates for the year 2022 for two articles just to check whether my code is displaying the page views count or not and it did display the counts. But the task was to fetch start and end dates from revision_timestamps, so when I modified my code accordingly, it didn't fetch data and displayed the above error message in the screenshot. Is there data available for the dates mentioned in revision timestamps?

Thanks for the explanation. The error means that they don't have any data within a specified timeframe("20030601 and 20060331", "20030301 and 20030331" in this case). On the other hand, they have some data within the timeframe of your manual request. That's why you get data on your manual request.

Ok. I checked for just two articles. Should I check for all the articles in order to know whether there is any data available for all the revision_timestamps of different articles? And what if no data is available for the dates mentioned in revision_timestamps?

Mar 11 2024, 8:28 PM · Outreachy (Round 28)

Mar 9 2024

MahimaSinghal added a comment to T358095: Outreachy Application Task: Tutorial for Wikipedia language-agnostic article quality modeling data.

Also, I’m a little unclear about what the first task is asking us to do. We need to use the API to return views for revision_timestamps? For every article? Or?
I mean what is the output going to be here.

Mar 9 2024, 5:39 AM · Outreachy (Round 28)

Mar 8 2024

MahimaSinghal added a comment to T356498: Outreachy Project: Build a data visualization tool for the evolution of Wikipedia articles maintained by WikiProjects.

Hi @Pablo @Isaac @CMyrick-WMF
I hope you're all doing well. I've been working on the microtask T358095 and I'm now at the stage where I need to submit my work for review. Could you please let me know where I can submit my work for review?

Just to provide some context, here's an overview of the work I've done:

  1. Extracted page view counts for Wikipedia articles.
  2. Explored and visualized the evolution of individual articles and a sample of Climate change articles by visualizing feature values and quality scores over time.
  3. Analyzed the distribution of quality scores by year using boxplots.

I'm looking forward to receiving feedback on my work.

Thank you!
Mahima Agarwal

Hello @MahimaSinghal
Could you walk me through how you were able to complete your task?
I have extracted relevant data from the wikipedia articles now I need to visualize it. That's were I'm having challenges. Thanks.

Hello ,

Of course, I'd be happy to help!

Firstly, could you please provide me with more details about the data you've extracted? And the challenges you are facing.
It would be helpful to know which specific features or metrics you're looking to visualize.

Once I have a better understanding of what challenges are facing you exactly, I can suggest something better.
Feel free to ask any questions along the way, and I'll do my best to help you!

Thankyou!
Mahima.

Hey Mahima,
Trust you're doing okay?
So regarding my progress on this task, this is where I'm at right now. Here: https://public-paws.wmcloud.org/User:Victor%20Ebuka96/Project1(T358095).ipynb

I need help on how to proceed with visualizing this data.

Any tip will be highly appreciated.

Mar 8 2024, 3:08 PM · Outreachy (Round 28), Outreach-Programs-Projects

Mar 7 2024

MahimaSinghal added a comment to T356498: Outreachy Project: Build a data visualization tool for the evolution of Wikipedia articles maintained by WikiProjects.

Hi @Pablo @Isaac @CMyrick-WMF. I'm Shruti an Outreachy applicant who is new to open source contribution. I am interested in learning about this project and contributing to it. I would like to know how to get started.

Regards,
Shruti

Mar 7 2024, 6:20 PM · Outreachy (Round 28), Outreach-Programs-Projects
MahimaSinghal added a comment to T358412: Create tool for informative infographics from structured information from Wikimedia projects - Task A.

Hello, @Ederporto

I have a question about visualisation step. On the notebook task we have to do our graphics with the previous result dataframe (top_view_dataframe). According to bar_chart_race documentation, the dataframe to use should have a date on row and different categories of articles on columns but top_view_dataframe is the opposite. My question is can we use different approach instead of top_view_dataframe, for exemple prepare our dataset with the build in method in bar_chart_race release for that goal?

Thank you

Yes, same issue. I find it hard to visualize it with the current state of our data frame. In the documentation, it's specified that every row must represent a single period, which is the exact opposite in ours.

@Ederporto would drop more insights.

Mar 7 2024, 6:16 PM · Outreach-Programs-Projects, Developer-Outreach, Outreachy (Round 28)
MahimaSinghal added a comment to T358095: Outreachy Application Task: Tutorial for Wikipedia language-agnostic article quality modeling data.

Hello Everyone!!
While performing the first task I got some queries:

  1. Do we need to extract pageview counts for some selected articles?
  2. Or can we randomly choose any article to demonstrate and extract counts?

any help or clarification will prove to be beneficial for me.
Thank You.

Mar 7 2024, 1:26 PM · Outreachy (Round 28)
MahimaSinghal added a comment to T358095: Outreachy Application Task: Tutorial for Wikipedia language-agnostic article quality modeling data.

Hi @Pablo @Isaac @CMyrick-WMF
I hope you're all doing well. I've been working on the microtask T358095 and I'm now at the stage where I need to submit my work for review. Could you please let me know where I can submit my work for review?

Just to provide some context, here's an overview of the work I've done:

  1. Extracted page view counts for Wikipedia articles.
  2. Explored and visualized the evolution of individual articles and a sample of Climate change articles by visualizing feature values and quality scores over time.
  3. Analyzed the distribution of quality scores by year using boxplots.

I'm looking forward to receiving feedback on my work.

Thank you!
Mahima Agarwal

weldone, The details how to send are explicit in the task description.

It is mentioned to mail the mentors directly. However, I realized that I don't have access to the email addresses of the mentors to send my submission.

Would it be possible for someone to provide me with the email addresses of the mentors? I would greatly appreciate it.

The email addresses are provided on the project idea page of outreachy. You can contact them through there.

Mar 7 2024, 1:18 PM · Outreachy (Round 28)
MahimaSinghal added a comment to T358095: Outreachy Application Task: Tutorial for Wikipedia language-agnostic article quality modeling data.

Hi Everyone. Please I am stuck at the FORK instruction of "Get the URL of another public PAWS notebook" and "Add ?format=raw" to download a raw .ipynb file. Where am I to get another public PAWS notebook? Do I just get any random PAWS notebook? Also, when I tried using the PAWS notebook example that was given in the instruction, I wasn't getting the option to download the raw file. Please help

Mar 7 2024, 12:44 PM · Outreachy (Round 28)
MahimaSinghal added a comment to T358095: Outreachy Application Task: Tutorial for Wikipedia language-agnostic article quality modeling data.

Hi @Pablo @Isaac @CMyrick-WMF
I hope you're all doing well. I've been working on the microtask T358095 and I'm now at the stage where I need to submit my work for review. Could you please let me know where I can submit my work for review?

Just to provide some context, here's an overview of the work I've done:

  1. Extracted page view counts for Wikipedia articles.
  2. Explored and visualized the evolution of individual articles and a sample of Climate change articles by visualizing feature values and quality scores over time.
  3. Analyzed the distribution of quality scores by year using boxplots.

I'm looking forward to receiving feedback on my work.

Thank you!
Mahima Agarwal

weldone, The details how to send are explicit in the task description.

Mar 7 2024, 12:36 PM · Outreachy (Round 28)
MahimaSinghal added a comment to T356498: Outreachy Project: Build a data visualization tool for the evolution of Wikipedia articles maintained by WikiProjects.

Hi @Pablo @Isaac @CMyrick-WMF
I hope you're all doing well. I've been working on the microtask T358095 and I'm now at the stage where I need to submit my work for review. Could you please let me know where I can submit my work for review?

Just to provide some context, here's an overview of the work I've done:

  1. Extracted page view counts for Wikipedia articles.
  2. Explored and visualized the evolution of individual articles and a sample of Climate change articles by visualizing feature values and quality scores over time.
  3. Analyzed the distribution of quality scores by year using boxplots.

I'm looking forward to receiving feedback on my work.

Thank you!
Mahima Agarwal

Hello @MahimaSinghal
Could you walk me through how you were able to complete your task?
I have extracted relevant data from the wikipedia articles now I need to visualize it. That's were I'm having challenges. Thanks.

Mar 7 2024, 12:33 PM · Outreachy (Round 28), Outreach-Programs-Projects
MahimaSinghal added a comment to T356498: Outreachy Project: Build a data visualization tool for the evolution of Wikipedia articles maintained by WikiProjects.

Hi @Pablo @Isaac @CMyrick-WMF
I hope you're all doing well. I've been working on the microtask T358095 and I'm now at the stage where I need to submit my work for review. Could you please let me know where I can submit my work for review?

Mar 7 2024, 10:18 AM · Outreachy (Round 28), Outreach-Programs-Projects
MahimaSinghal added a comment to T358095: Outreachy Application Task: Tutorial for Wikipedia language-agnostic article quality modeling data.

Hi @Pablo @Isaac @CMyrick-WMF
I hope you're all doing well. I've been working on the microtask T358095 and I'm now at the stage where I need to submit my work for review. Could you please let me know where I can submit my work for review?

Mar 7 2024, 9:57 AM · Outreachy (Round 28)