Page MenuHomePhabricator

Icinga should alert on free disk space < 15% (now < 12%) on Elasticsearch hosts
Closed, ResolvedPublic

Description

Elasticsearch logs warnings when trying to allocate and free disk space is below cluster.routing.allocation.disk.watermark.low. This creates much unnecessary logging traffic to logstash and is the sign of an unablanced cluster, which leads to much variance in query time. In that case, cluster should be rebalanced by lowering cluster.routing.allocation.disk.watermark.high to force moving shards or by manually moving shards around.

Having an early warning as an Icinga alert would enable us to react appropriately.
Event Timeline

It currently alerts by default at 6% / 3%

# nrpe_check_disk_options   - Default options for checking disks.  Defaults to checking
#                             all disks and warning at < 6% and critical at < 3% free.

class base::monitoring::host

$nrpe_check_disk_options = '-w 6% -c 3% -l -e -A -i "/srv/sd[a-b][1-3]" --exclude-type=tracefs',

This can be overridden in hiera, for example: labs nfs servers have different values from this:

hieradata/role/common/labs/nfs/fileserver.yaml:base::monitoring::host::nrpe_check_disk_options: -w 10% -c 5% -l -e -A -i /run/lock/storage-replicate-.*/snapshot -i /exp/.*

Dzahn renamed this task from Icinga should alert on free disk space < 15% to Icinga should alert on free disk space < 15% on Elasticsearch hosts.Mar 29 2016, 10:56 PM
Dzahn claimed this task.

Change 280343 had a related patch set uploaded (by Dzahn):
elastic: change disk space monitoring to alert at 15%

https://gerrit.wikimedia.org/r/280343

Thanks @Dzahn ! I had this on my not too urgent todo list, but you've been much faster than me! Great!

Change 280343 merged by Dzahn:
elastic: change disk space monitoring to alert at 15%

https://gerrit.wikimedia.org/r/280343

needs confirmation on neon itself, in the generated icinga config.. don't see it just yet

Dzahn triaged this task as Medium priority.Mar 30 2016, 7:34 PM
Dzahn removed a project: Patch-For-Review.

on the elastic hosts, the local NRPE command is adjusted:

root@elastic1001:/etc/nagios/nrpe.d# cat check_disk_space.cfg 
# File generated by puppet. DO NOT edit by hand
command[check_disk_space]=/usr/lib/nagios/plugins/check_disk -w 18% -c 15% ....

on neon we have, generated in /etc/icinga/puppet_services.cfg

99341 define service {
99342 # --PUPPET_NAME-- elastic1001 disk_space
99343     active_checks_enabled          1
99344     check_command                  nrpe_check!check_disk_space!10

10 is the timeout. check_disk_space is the command on the host itself, above

< ebernhardson> mutante: thanks for the ping, but in general you don't have to worry about elasticsearch diskspace too much, the clustering will handle shuffling data from full machine to less full machines, the thing is the alert and the moment it starts auto-fixing are both 85%...

< ebernhardson> there was T136702 to change it, but never made a decision...


In that context above, i found this ticket again where i already set it to 15% specifically.

Re-opening. Should we simly change the numbers here?

it's -w 18% -c 15% now, what should we set it to instead to fix "the alert and the moment it starts auto-fixing are both 85%..."

Change 321913 had a related patch set uploaded (by Dzahn):
icinga/cirrus: lower disk space crit threshold to 12%

https://gerrit.wikimedia.org/r/321913

Change 321913 merged by Dzahn:
icinga/cirrus: lower disk space crit threshold to 12%

https://gerrit.wikimedia.org/r/321913

Dzahn renamed this task from Icinga should alert on free disk space < 15% on Elasticsearch hosts to Icinga should alert on free disk space < 15% (now < 12%) on Elasticsearch hosts.Nov 16 2016, 7:08 PM
Dzahn closed this task as Resolved.

Lowered alert threshold from 15% to 12% to avoid "the thing is the alert and the moment it starts auto-fixing are both 85%...". and re-closing again.

fgiunchedi subscribed.

reopening as I think this is happening again, low disk space alert fired and auto resolved 10 min later

12:40 -icinga-wm:#wikimedia-operations- PROBLEM - Disk space on elastic1025 is 
          CRITICAL: DISK CRITICAL - free space: /srv 18812 MB (3% inode=99%): 
          https://wikitech.wikimedia.org/wiki/Monitoring/Disk_space 
https://grafana.wikimedia.org/dashboard/db/host-overview?var-server=elastic1025&var-datasource=eqiad+prometheus/ops
12:50 -icinga-wm:#wikimedia-operations- RECOVERY - Disk space on elastic1025 is 
          OK: DISK OK https://wikitech.wikimedia.org/wiki/Monitoring/Disk_space 
https://grafana.wikimedia.org/dashboard/db/host-overview?var-server=elastic1025&var-datasource=eqiad+prometheus/ops

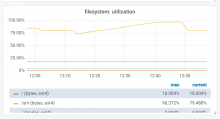
2019-08-27-145807_1188x646_scrot.png (646×1 px, 68 KB)

Should we up it to 20% or what is a reasonable number?

Still ongoing from time to time (e.g. in september)

#wikimedia-operations_2019-09.log:2019-09-07T22:29:13 -icinga-wm:#wikimedia-operations- PROBLEM - Disk space on elastic1018 is CRITICAL: DISK CRITICAL - free space: /srv 23774 MB (4% inode=99%): https://wikitech.wikimedia.org/wiki/Monitoring/Disk_space https://grafana.wikimedia.org/dashboard/db/host-overview?var-server=elastic1018&var-datasource=eqiad+prometheus/ops
#wikimedia-operations_2019-09.log:2019-09-07T22:46:35 -icinga-wm:#wikimedia-operations- RECOVERY - Disk space on elastic1018 is OK: DISK OK https://wikitech.wikimedia.org/wiki/Monitoring/Disk_space https://grafana.wikimedia.org/dashboard/db/host-overview?var-server=elastic1018&var-datasource=eqiad+prometheus/ops
#wikimedia-operations_2019-09.log:2019-09-24T20:25:28 -icinga-wm:#wikimedia-operations- PROBLEM - Disk space on elastic1025 is CRITICAL: DISK CRITICAL - free space: /srv 27490 MB (5% inode=99%): https://wikitech.wikimedia.org/wiki/Monitoring/Disk_space https://grafana.wikimedia.org/dashboard/db/host-overview?var-server=elastic1025&var-datasource=eqiad+prometheus/ops
#wikimedia-operations_2019-09.log:2019-09-24T21:09:26 -icinga-wm:#wikimedia-operations- RECOVERY - Disk space on elastic1025 is OK: DISK OK https://wikitech.wikimedia.org/wiki/Monitoring/Disk_space https://grafana.wikimedia.org/dashboard/db/host-overview?var-server=elastic1025&var-datasource=eqiad+prometheus/ops
#wikimedia-operations_2019-09.log:2019-09-25T11:54:45 -icinga-wm:#wikimedia-operations- PROBLEM - Disk space on elastic1025 is CRITICAL: DISK CRITICAL - free space: /srv 28154 MB (5% inode=99%): https://wikitech.wikimedia.org/wiki/Monitoring/Disk_space https://grafana.wikimedia.org/dashboard/db/host-overview?var-server=elastic1025&var-datasource=eqiad+prometheus/ops
#wikimedia-operations_2019-09.log:2019-09-25T12:13:51 -icinga-wm:#wikimedia-operations- RECOVERY - Disk space on elastic1025 is OK: DISK OK https://wikitech.wikimedia.org/wiki/Monitoring/Disk_space https://grafana.wikimedia.org/dashboard/db/host-overview?var-server=elastic1025&var-datasource=eqiad+prometheus/ops
#wikimedia-operations_2019-09.log:2019-09-26T12:15:26 -icinga-wm:#wikimedia-operations- PROBLEM - Disk space on elastic1025 is CRITICAL: DISK CRITICAL - free space: /srv 27452 MB (5% inode=99%): https://wikitech.wikimedia.org/wiki/Monitoring/Disk_space https://grafana.wikimedia.org/dashboard/db/host-overview?var-server=elastic1025&var-datasource=eqiad+prometheus/ops
#wikimedia-operations_2019-09.log:2019-09-26T12:33:02 -icinga-wm:#wikimedia-operations- RECOVERY - Disk space on elastic1025 is OK: DISK OK https://wikitech.wikimedia.org/wiki/Monitoring/Disk_space https://grafana.wikimedia.org/dashboard/db/host-overview?var-server=elastic1025&var-datasource=eqiad+prometheus/ops
#wikimedia-operations_2019-09.log:2019-09-26T13:11:30 -icinga-wm:#wikimedia-operations- PROBLEM - Disk space on elastic1025 is CRITICAL: DISK CRITICAL - free space: /srv 27115 MB (5% inode=99%): https://wikitech.wikimedia.org/wiki/Monitoring/Disk_space https://grafana.wikimedia.org/dashboard/db/host-overview?var-server=elastic1025&var-datasource=eqiad+prometheus/ops

From the paste above it looks like this was already set to the default alerting threshold at 5%.

We really need to figure out what to do with the elastic1025 alert, it has been alerting even more aggressively lately I think

All we can really do is wait for the servers that are replacing these. They were racked up just this week and should hopefully be added to the cluster soon: T230746

We can just set a really long downtime on them if we don't want to see the alerts until the server s are decom'ed.

These servers (elastic1017-31) no longer have any data on them and are being decomissioned. The elasticsearch servers are now all under 50% disk used