Page MenuHomePhabricator

Compare usage of collapsed and uncollapsed section view on mobile web
Closed, ResolvedPublic

Assigned To
Authored By
Tbayer
Mar 1 2016, 11:33 PM

Description

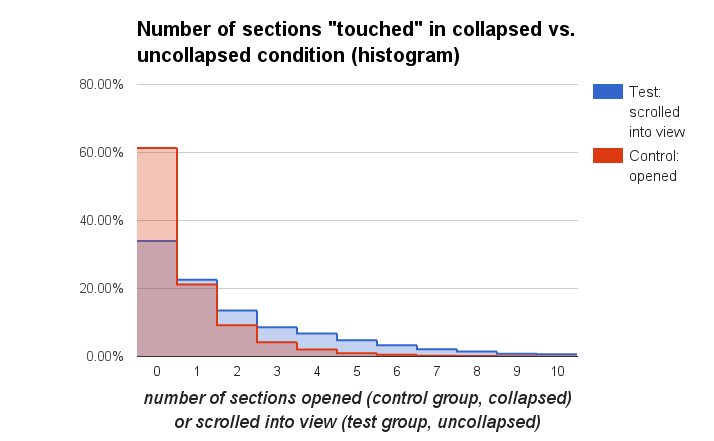
Examine the data from the experiment set up in T120292 , where 0.05% of mobile web users were shown all pages with every section expanded on initial load, alongside a control group of 0.05% that kept seeing the standard view where all sections all initially collapsed. (For the most part this is not an A/B test in a strict sense, because we are not comparing the same metric for both groups.) This is a followup to T118041, which preceded that experiment.
The goal is to inform the discussion about the tradeoffs of collapsing sections by default on mobile.

  • 1. Compare (in a suitable sense) how many sections are scrolled into view in the uncollapsed view with how many are opened in the collapsed view
  • --> result
  • 2. compare the time readers spent reading vs. navigating on a page in both conditions, interpreting scroll/open events that are not followed by another event within the next 5 seconds as the start of a period of focused reading
  • --> result
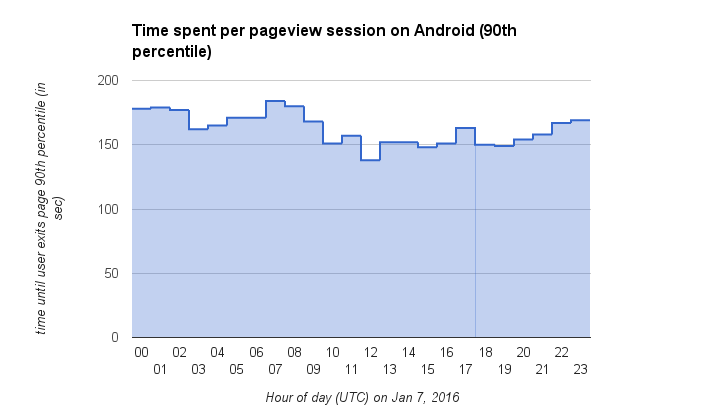
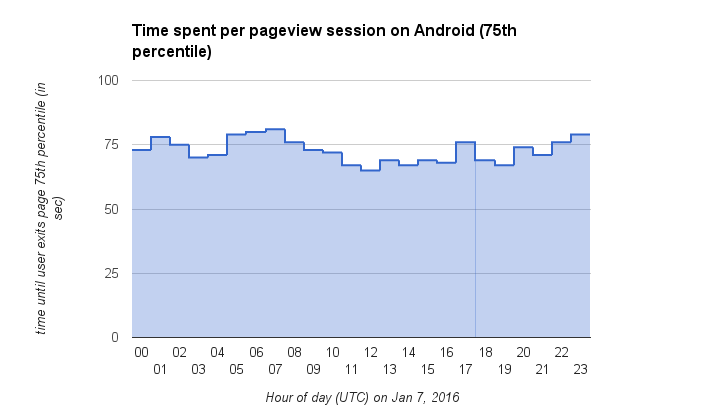
  • 3. Take into account what we know about usage of separate TOC on mobile where available (e.g. from Android instrumentations for TOC and scroll usage?)
  • --> partial result (other parts affected by session sampling bug, see T128931#2293576)
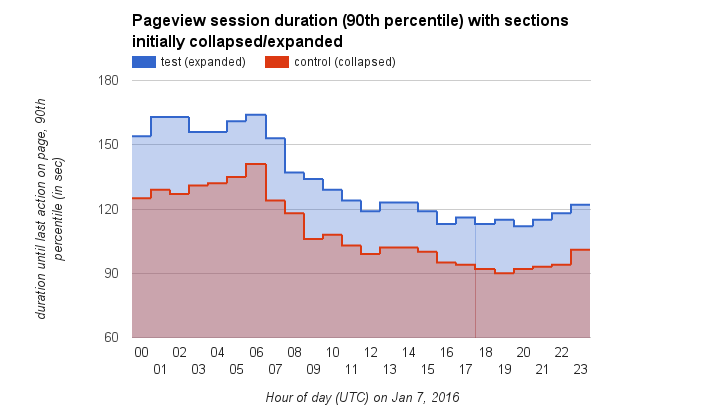
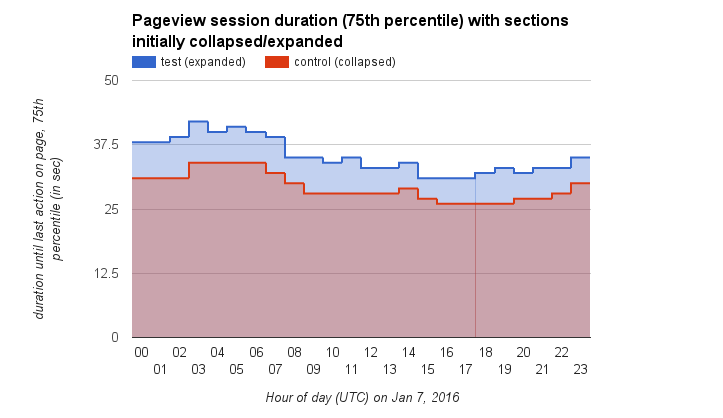
  • Compare user session lengths (defined as the number of pages viewed)? (not possible due to session sampling bug, see T128931#2293576)
  • 5. Compare pageview session durations (defined as the time between "entered" and the last event logged on the same page)
  • --> result

A more readable writeup of the most releveant results is being drafted at [[meta:Research:Collapsed vs uncollapsed section view on mobile web]]

Related Objects

Event Timeline

(work log; these are still just test queries covering a small timespan, for speed reasons:)

Regarding #1, I'm having trouble replicating the result about the frequency of section opening actions in the standard view from https://phabricator.wikimedia.org/T118041#1854054 in the new schema:

mysql:research@analytics-store.eqiad.wmnet [(none)]> SELECT sections_opened, COUNT(*) as number_of_pageviewsessions FROM (SELECT event_sessionId, event_PageId, wiki, (COUNT(*)-1) AS sections_opened FROM log.MobileWebSectionUsage_15038458 WHERE timestamp LIKE '2016010700%' AND (event_eventName = 'entered' OR event_eventName = 'opened') AND event_isTestA = FALSE AND event_isTablet = 0 AND event_namespace = 0 AND event_sessionId <> '' AND event_pageId <> 0 GROUP BY event_sessionId, event_PageId, wiki) AS pageviewsessions GROUP BY sections_opened ORDER BY sections_opened;
+-----------------+----------------------------+
| sections_opened | number_of_pageviewsessions |
+-----------------+----------------------------+
|               0 |                      30683 |
|               1 |                         69 |
|               2 |                          2 |
+-----------------+----------------------------+
3 rows in set (30 min 51.57 sec)

Maybe I made some stupid mistake while adapting that earlier query. Or something is wrong with the sampling in the control group.

For the test group on the other hand, the analogous numbers look plausible:

mysql:research@analytics-store.eqiad.wmnet [(none)]> SELECT sections_scrolled_into_view, COUNT(*) as number_of_pageviewsessions FROM (SELECT event_sessionId, event_PageId, wiki, (COUNT(*)-1) AS sections_scrolled_into_view FROM log.MobileWebSectionUsage_15038458 WHERE timestamp LIKE '20160107000%' AND (event_eventName = 'entered' OR event_eventName = 'scrolled-into-view') AND event_isTestA = TRUE AND event_isTablet = 0 AND event_namespace = 0 AND event_sessionId <> '' AND event_pageId <> 0 GROUP BY event_sessionId, event_PageId, wiki) AS pageviewsessions GROUP BY sections_scrolled_into_view ORDER BY sections_scrolled_into_view;
+-----------------------------+----------------------------+
| sections_scrolled_into_view | number_of_pageviewsessions |
+-----------------------------+----------------------------+
|                           0 |                       1950 |
|                           1 |                       1349 |
|                           2 |                        776 |
|                           3 |                        471 |
|                           4 |                        360 |
|                           5 |                        241 |
|                           6 |                        167 |
|                           7 |                        104 |
|                           8 |                         67 |
|                           9 |                         31 |
|                          10 |                         28 |
|                          11 |                         11 |
|                          12 |                         12 |
|                          13 |                          5 |
|                          14 |                          5 |
|                          15 |                          5 |
|                          16 |                          1 |
|                          17 |                          2 |
|                          18 |                          1 |
|                          19 |                          1 |
|                          24 |                          2 |
|                          28 |                          1 |
|                          46 |                          1 |
+-----------------------------+----------------------------+
23 rows in set (4 min 32.97 sec)

(work log) So, we've found the reason for the discrepancy (see T128931: investigate instrumentation of section opens/scrolls for details and discussion of an additional issue uncovered). Here is the result of the corrected query:

SELECT sections_opened, COUNT(*) as number_of_pageviewsessions FROM (SELECT event_sessionId, event_PageId, wiki, (COUNT(*)-1) AS sections_opened FROM log.MobileWebSectionUsage_15038458 WHERE timestamp LIKE '2016010700%' AND (event_eventName = 'entered' OR event_eventName = 'open-section') AND event_isTestA = FALSE AND event_isTablet = 0 AND event_namespace = 0 AND event_sessionId <> '' AND event_pageId <> 0 GROUP BY event_sessionId, event_PageId, wiki) AS pageviewsessions GROUP BY sections_opened ORDER BY sections_opened

sections_opened number_of_pageviewsessions
0       19085
1       6585
2       2857
3       1302
4       632
5       308
6       163
7       74
8       41
9       34
10      11
11      10
12      3
13      4
14      1
15      1
19      1
20      1
24      1
27      1

I.e. in 61% of the sessions no sections were opened, in 21% exactly one was opened, etc., which matches the earlier result from the previous schema version pretty well.

(work log) I've been most looking at 1, 4 and 5 recently. Regarding 5, the median pageview session duration (defined as the timespan from the entered event to the last event recorded for that session ID and page) is unsurprisingly 0 seconds, so I looked at the 90th percentile instead. On January 7, this was 117 seconds for the control group (collapsed) vs. 147 seconds for the experiment group (uncollapsed). [edited previous sentence to fix swapped numbers, see query results below] One needs to assess how significant this difference is, though, so I'm repeating this for a longer timespan and for several days in comparison. Will record the results here once the queries have finished.

SET @rownum = 0;
SELECT AVG(duration) AS duration_90thpercentile FROM
  (SELECT (@rownum:= @rownum +1) AS row_number, duration FROM (
    SELECT event_sessionId, (60*MID(maxtime,11,2)+MID(maxtime,13,2) - 60*MID(mintime,11,2)-MID(mintime,13,2) ) AS duration FROM (SELECT event_sessionId, event_PageId, wiki, MIN(timestamp) AS mintime, MAX(timestamp) AS maxtime FROM log.MobileWebSectionUsage_15038458 WHERE timestamp LIKE '20160107%' AND event_isTestA = 1 AND event_isTablet = 0 AND event_namespace = 0 AND event_sessionId <> '' AND event_pageId <> 0 GROUP BY event_sessionId, event_PageId, wiki) AS pageviewsessions) AS unnumberedlist
  ORDER BY duration) AS numberedlist
INNER JOIN
  (SELECT COUNT(*) AS total_rows FROM (SELECT event_sessionId, event_PageId, wiki FROM log.MobileWebSectionUsage_15038458 WHERE timestamp LIKE '20160107%' AND event_isTestA = 1 AND event_isTablet = 0 AND event_namespace = 0 AND event_sessionId <> '' AND event_pageId <> 0 GROUP BY event_sessionId, event_PageId, wiki)  AS pageviewsessions) AS row_counting
ON 1=1
WHERE
numberedlist.row_number >= row_counting.total_rows*0.9 AND
numberedlist.row_number <= row_counting.total_rows*0.9+1;

duration_90thpercentile
147


SET @rownum = 0;
SELECT AVG(duration) AS duration_90thpercentile FROM
  (SELECT (@rownum:= @rownum +1) AS row_number, duration FROM (
    SELECT event_sessionId, (60*MID(maxtime,11,2)+MID(maxtime,13,2) - 60*MID(mintime,11,2)-MID(mintime,13,2) ) AS duration FROM (SELECT event_sessionId, event_PageId, wiki, MIN(timestamp) AS mintime, MAX(timestamp) AS maxtime FROM log.MobileWebSectionUsage_15038458 WHERE timestamp LIKE '20160107%' AND event_isTestA = FALSE AND event_isTablet = 0 AND event_namespace = 0 AND event_sessionId <> '' AND event_pageId <> 0 GROUP BY event_sessionId, event_PageId, wiki) AS pageviewsessions) AS unnumberedlist
  ORDER BY duration) AS numberedlist
INNER JOIN
  (SELECT COUNT(*) AS total_rows FROM (SELECT event_sessionId, event_PageId, wiki FROM log.MobileWebSectionUsage_15038458 WHERE timestamp LIKE '20160107%' AND event_isTestA = FALSE AND event_isTablet = 0 AND event_namespace = 0 AND event_sessionId <> '' AND event_pageId <> 0 GROUP BY event_sessionId, event_PageId, wiki)  AS pageviewsessions) AS row_counting
ON 1=1
WHERE
numberedlist.row_number >= row_counting.total_rows*0.9 AND
numberedlist.row_number <= row_counting.total_rows*0.9+1;

duration_90thpercentile
117

(work log) Update regarding 5: So I had intended to compare the daily 90th percentile pageview session duration for the test and control group over a longer timespan like two weeks, to assess the statistical noise (in lieu of calculating an actual confidence interval, which I wasn't sure how to do here without making rather adventurous assumptions about the underlying distribution). However, these nested queries take a long time - more than realtime in fact (i.e. a test query for three hours' worth of data took more than three hours to complete, etc.) So I settled for instead querying only one day first, divided into 24 hours and anticipating that there would be some diurnal variation. The result is consistent with the assumption that engaged readers tend to stay longer on a page if the sections are expanded initially:

Pageview session duration (90th percentile) with sections initially collapsed vs expanded.png (418×723 px, 21 KB)

However, I will still run another query to examine more data in order to further check this result (e.g. one small weirdness in the chart is that on the right hand side it doesn't quite go back up to the level 23h before, although there might be a weekly pattern or other influences overlaying the diurnal pattern. There is also a small truncation effect because only events until midnight were considered, but that should not affect the numbers a lot.)

Data source (both queries ran on s1-analytics-slave.eqiad.wmnet):


SET @prev_dayhour = 0;
SET @rownum = 0;
SELECT numberedlist.dayhour, AVG(numberedlist.duration) AS percentile_duration, AVG(rows_per_dayhour.total_rows) AS samples FROM
  (SELECT IF(@prev_dayhour <> ordered_data.dayhour, @rownum:=1, @rownum:= @rownum +1) AS row_number, @prev_dayhour:= ordered_data.dayhour, ordered_data.dayhour AS dayhour, ordered_data.duration AS duration FROM
       (SELECT LEFT(mintime, 10) AS dayhour, ( 60*MID(maxtime,11,2)+MID(maxtime,13,2) - 60*MID(mintime,11,2)-MID(mintime,13,2) ) AS duration FROM
                 (SELECT event_sessionId, event_PageId, wiki, MIN(timestamp) AS mintime, MAX(timestamp) AS maxtime FROM log.MobileWebSectionUsage_15038458 WHERE timestamp LIKE '20160107%' AND event_isTestA = 1 AND event_isTablet = 0 AND event_namespace = 0 AND event_sessionId <> '' AND event_pageId <> 0 GROUP BY event_sessionId, event_PageId, wiki) AS pageviewsessions
           ORDER BY dayhour, duration )
       AS ordered_data
  ORDER BY dayhour, duration) AS numberedlist
INNER JOIN
  (SELECT COUNT(*) AS total_rows, LEFT(mintime, 10) AS dayhour FROM
           (SELECT event_sessionId, event_PageId, wiki, MIN(timestamp) AS mintime FROM log.MobileWebSectionUsage_15038458 WHERE timestamp LIKE '20160107%' AND event_isTestA = 1 AND event_isTablet = 0 AND event_namespace = 0 AND event_sessionId <> '' AND event_pageId <> 0 GROUP BY event_sessionId, event_PageId, wiki) AS pageviewsessions GROUP BY dayhour)
   AS rows_per_dayhour
ON numberedlist.dayhour = rows_per_dayhour.dayhour
WHERE
numberedlist.row_number >= rows_per_dayhour.total_rows*0.9 AND
numberedlist.row_number <= rows_per_dayhour.total_rows*0.9+1
GROUP BY numberedlist.dayhour
ORDER BY numberedlist.duration;


SET @prev_dayhour = 0;
SET @rownum = 0;
SELECT numberedlist.dayhour, AVG(numberedlist.duration) AS percentile_duration, AVG(rows_per_dayhour.total_rows) AS samples FROM
  (SELECT IF(@prev_dayhour <> ordered_data.dayhour, @rownum:=1, @rownum:= @rownum +1) AS row_number, @prev_dayhour:= ordered_data.dayhour, ordered_data.dayhour AS dayhour, ordered_data.duration AS duration FROM
       (SELECT LEFT(mintime, 10) AS dayhour, ( 60*MID(maxtime,11,2)+MID(maxtime,13,2) - 60*MID(mintime,11,2)-MID(mintime,13,2) ) AS duration FROM
                 (SELECT event_sessionId, event_PageId, wiki, MIN(timestamp) AS mintime, MAX(timestamp) AS maxtime FROM log.MobileWebSectionUsage_15038458 WHERE timestamp LIKE '20160107%' AND event_isTestA = 0 AND event_isTablet = 0 AND event_namespace = 0 AND event_sessionId <> '' AND event_pageId <> 0 GROUP BY event_sessionId, event_PageId, wiki) AS pageviewsessions
           ORDER BY dayhour, duration )
       AS ordered_data
  ORDER BY dayhour, duration) AS numberedlist
INNER JOIN
  (SELECT COUNT(*) AS total_rows, LEFT(mintime, 10) AS dayhour FROM
           (SELECT event_sessionId, event_PageId, wiki, MIN(timestamp) AS mintime FROM log.MobileWebSectionUsage_15038458 WHERE timestamp LIKE '20160107%' AND event_isTestA = 0 AND event_isTablet = 0 AND event_namespace = 0 AND event_sessionId <> '' AND event_pageId <> 0 GROUP BY event_sessionId, event_PageId, wiki) AS pageviewsessions GROUP BY dayhour)
   AS rows_per_dayhour
ON numberedlist.dayhour = rows_per_dayhour.dayhour
WHERE
numberedlist.row_number >= rows_per_dayhour.total_rows*0.9 AND
numberedlist.row_number <= rows_per_dayhour.total_rows*0.9+1
GROUP BY numberedlist.dayhour
ORDER BY numberedlist.duration;

(work log)
Regarding no. 4 (number of page views per browser session), I started a query to compare this metric for both groups during the timespan of one week, January 3 to January 9. It launched a three and a half days ago and is still running.

Regarding no. 3, I checked the current usage of the TOC on the Android app: 17.1% of daily users open the TOC at least once, and 13.4% actually use it, i.e. click on at least one section in the TOC. If one sees the group of collapsed sections in the default view on mobile web as a kind of TOC, one can directly compare the latter app metric with the ratio of mobile web browser sessions on a given day where at least one collapsed section is opened. I'm going to run a query for that next. We already know that even in a single pageview, at least one section is opened in about 40% of cases, and the ratio per session and day will likely (although not certainly) be higher than that.

Data source: (average of daily ratios from November 20, 2015 to March 23, 2016)

hive (default)> SELECT CONCAT(year,"-",LPAD(month,2,"0"),"-",LPAD(day,2,"0")) as date, unique_count AS Android_DAU FROM wmf.mobile_apps_uniques_daily WHERE platform = 'Android';
SELECT COUNT(DISTINCT event_appInstallID) AS TOCusers, LEFT(timestamp, 8) AS date FROM log.MobileWikiAppToCInteraction_14585319 WHERE event_action = 'click' AND userAgent LIKE '%Android%' GROUP BY date;
SELECT COUNT(DISTINCT event_appInstallID) AS TOCusers, LEFT(timestamp, 8) AS date FROM log.MobileWikiAppToCInteraction_14585319 WHERE event_action = 'open' AND userAgent LIKE '%Android%' GROUP BY date;

(work log)
Update on no. 4: Below is the result on the number of page views per browser session for both groups during the timespan of one week (January 3 to January 9).

The difference is minuscule, e.g. the average number of views per session is 1.0870 for the test group (all sections expanded initially) vs. 1.0872 for the control group (all collapsed).

This is a bit surprising, and on the other hand both values seem quite low, compared to what I seem to recall from earlier analyses of session depth on mobile web (need to look up the actual data). It might be worth checking the mechanics of the instrumentation once more here.

pages_entered%browser sessions for control (collapsed)%browser sessions for isTestA=1 (uncollapsed)
195.82%95.85%
22.87%2.84%
30.53%0.53%
40.23%0.23%
50.14%0.14%
60.09%0.10%
70.07%0.07%
80.05%0.05%
90.04%0.04%
100.03%0.03%
110.03%0.03%
120.02%0.02%
130.02%0.02%
140.01%0.01%
150.01%0.01%
160.01%0.01%
170.01%0.01%
180.01%0.01%
190.00%0.00%
200.00%0.00%

...

Data source:

SELECT event_isTestA, pages_entered, COUNT(*) as number_of_browsersessions 
FROM (
  SELECT event_isTestA, event_sessionId, COUNT(*) AS pages_entered 
  FROM log.MobileWebSectionUsage_15038458 
  WHERE (timestamp BETWEEN '20160103' AND '20160110') 
    AND event_eventName = 'entered' AND event_isTablet = 0 AND event_namespace = 0 AND event_sessionId <> '' AND event_pageId <> 0 
  GROUP BY event_isTestA, event_sessionId) AS browsersessions 
GROUP BY event_isTestA, pages_entered ORDER BY pages_entered


event_isTestA   pages_entered   number_of_browsersessions
NULL    1       94
0       1       3281949
1       1       3283886
NULL    2       3
0       2       98207
1       2       97389
0       3       18085
1       3       18194
0       4       7849
1       4       7729
0       5       4751
1       5       4713
1       6       3258
0       6       3228
1       7       2386
0       7       2378
1       8       1844
0       8       1818
NULL    9       1
1       9       1431
0       9       1476
0       10      1186
1       10      1133
1       11      914
0       11      940
0       12      727
1       12      771
NULL    13      1
1       13      541
0       13      536
1       14      440
0       14      458
0       15      340
1       15      320
1       16      275
0       16      293
0       17      218
1       17      222
0       18      172
1       18      174
0       19      134
1       19      147
0       20      98
1       20      119
1       21      78
0       21      90
1       22      58
0       22      50
0       23      53
1       23      48
1       24      34
0       24      23
0       25      22
1       25      26
0       26      15
1       26      23
0       27      11
1       27      19
1       28      12
0       28      8
0       29      6
1       29      11
1       30      5
0       30      4
0       31      5
1       31      3
1       32      1
0       33      2
1       33      1
1       34      1
0       34      2
1       35      1
0       37      1
1       43      1
1       53      1
0       56      1

The query ran on s1-analytics-slave.eqiad.wmnet.

(work log)
Update on 5 (pageview durations):
After looking at the 90th percentile of pageview durations (again, defined as the time from the first "entered" event to the last recorded event by the same user on the same page within a given hour), I also looked at the 75th percentile. This is still only for one day's worth of data, but confirms the notion that interested readers spend a longer time on the page when the sections are not collapsed initially:

Pageview session duration (75th percentile) with sections initially collapsed vs.expanded.png (418×723 px, 21 KB)

Like for the 90th percentile, it appears that there might be a diurnal pattern. I started a query for one week's worth of data which is still running.

I checked the median too, more on that later.

Data source:

SET @prev_dayhour = 0;
SET @rownum = 0;
SELECT numberedlist.dayhour, AVG(numberedlist.duration) AS percentile_duration, AVG(rows_per_dayhour.total_rows) AS samples FROM
  (SELECT IF(@prev_dayhour <> ordered_data.dayhour, @rownum:=1, @rownum:= @rownum +1) AS row_number, @prev_dayhour:= ordered_data.dayhour, ordered_data.dayhour AS dayhour, ordered_data.duration AS duration FROM
       (SELECT LEFT(mintime, 10) AS dayhour, ( 60*MID(maxtime,11,2)+MID(maxtime,13,2) - 60*MID(mintime,11,2)-MID(mintime,13,2) ) AS duration FROM
                 (SELECT event_sessionId, event_PageId, wiki, MIN(timestamp) AS mintime, MAX(timestamp) AS maxtime FROM log.MobileWebSectionUsage_15038458 WHERE timestamp LIKE '20160107%' AND event_isTestA = 1 AND event_isTablet = 0 AND event_namespace = 0 AND event_sessionId <> '' AND event_pageId <> 0 GROUP BY event_sessionId, event_PageId, wiki) AS pageviewsessions
           ORDER BY dayhour, duration )
       AS ordered_data
  ORDER BY dayhour, duration) AS numberedlist
INNER JOIN
  (SELECT COUNT(*) AS total_rows, LEFT(mintime, 10) AS dayhour FROM
           (SELECT event_sessionId, event_PageId, wiki, MIN(timestamp) AS mintime FROM log.MobileWebSectionUsage_15038458 WHERE timestamp LIKE '20160107%' AND event_isTestA = 1 AND event_isTablet = 0 AND event_namespace = 0 AND event_sessionId <> '' AND event_pageId <> 0 GROUP BY event_sessionId, event_PageId, wiki) AS pageviewsessions GROUP BY dayhour)
   AS rows_per_dayhour
ON numberedlist.dayhour = rows_per_dayhour.dayhour
WHERE
numberedlist.row_number >= rows_per_dayhour.total_rows*0.75 AND
numberedlist.row_number <= rows_per_dayhour.total_rows*0.75+1
GROUP BY numberedlist.dayhour
ORDER BY numberedlist.dayhour;


dayhour percentile_duration     samples
2016010700      38      26406.0000
2016010701      38      26127.0000
2016010702      39      26381.0000
2016010703      42      26353.0000
2016010704      40      23404.0000
2016010705      41      22085.0000
2016010706      40      20830.0000
2016010707      39      19949.0000
2016010708      35      20112.0000
2016010709      35      20516.0000
2016010710      34      21635.0000
2016010711      35      23900.0000
2016010712      33      26673.0000
2016010713      33      29035.0000
2016010714      34      29615.0000
2016010715      31      29534.0000
2016010716      31      29351.0000
2016010717      31      29104.0000
2016010718      32      29006.0000
2016010719      33      30300.0000
2016010720      32      32415.0000
2016010721      33      33260.0000
2016010722      33      30984.0000
2016010723      35      26945.0000


SET @prev_dayhour = 0;
SET @rownum = 0;
SELECT numberedlist.dayhour, AVG(numberedlist.duration) AS percentile_duration, AVG(rows_per_dayhour.total_rows) AS samples FROM
  (SELECT IF(@prev_dayhour <> ordered_data.dayhour, @rownum:=1, @rownum:= @rownum +1) AS row_number, @prev_dayhour:= ordered_data.dayhour, ordered_data.dayhour AS dayhour, ordered_data.duration AS duration FROM
       (SELECT LEFT(mintime, 10) AS dayhour, ( 60*MID(maxtime,11,2)+MID(maxtime,13,2) - 60*MID(mintime,11,2)-MID(mintime,13,2) ) AS duration FROM
                 (SELECT event_sessionId, event_PageId, wiki, MIN(timestamp) AS mintime, MAX(timestamp) AS maxtime FROM log.MobileWebSectionUsage_15038458 WHERE timestamp LIKE '20160107%' AND event_isTestA = 0 AND event_isTablet = 0 AND event_namespace = 0 AND event_sessionId <> '' AND event_pageId <> 0 GROUP BY event_sessionId, event_PageId, wiki) AS pageviewsessions
           ORDER BY dayhour, duration )
       AS ordered_data
  ORDER BY dayhour, duration) AS numberedlist
INNER JOIN
  (SELECT COUNT(*) AS total_rows, LEFT(mintime, 10) AS dayhour FROM
           (SELECT event_sessionId, event_PageId, wiki, MIN(timestamp) AS mintime FROM log.MobileWebSectionUsage_15038458 WHERE timestamp LIKE '20160107%' AND event_isTestA = 0 AND event_isTablet = 0 AND event_namespace = 0 AND event_sessionId <> '' AND event_pageId <> 0 GROUP BY event_sessionId, event_PageId, wiki) AS pageviewsessions GROUP BY dayhour)
   AS rows_per_dayhour
ON numberedlist.dayhour = rows_per_dayhour.dayhour
WHERE
numberedlist.row_number >= rows_per_dayhour.total_rows*0.75 AND
numberedlist.row_number <= rows_per_dayhour.total_rows*0.75+1
GROUP BY numberedlist.dayhour
ORDER BY numberedlist.dayhour

dayhour percentile_duration     samples
2016010700      31      27540.0000
2016010701      31      27335.0000
2016010702      31      27238.0000
2016010703      34      27394.0000
2016010704      34      24550.0000
2016010705      34      22681.0000
2016010706      34      21994.0000
2016010707      32      20716.0000
2016010708      30      21043.0000
2016010709      28      21791.0000
2016010710      28      22667.0000
2016010711      28      25082.0000
2016010712      28      27700.0000
2016010713      28      30025.0000
2016010714      29      30874.0000
2016010715      27      31007.0000
2016010716      26      30412.0000
2016010717      26      30596.0000
2016010718      26      30468.0000
2016010719      26      31638.0000
2016010720      27      33740.0000
2016010721      27      34542.0000
2016010722      28      32467.0000
2016010723      30      28487.0000

(work log)
Update on 3 and 5:
The page scroll instrumentation on Android mentioned in the task description also measures time spent ("Amount of time, in seconds, that the user spent reading this page, before leaving the page for any reason (going to another page, another part of the app, leaving the app, etc.)"). I looked at the 75 and 90th percentile there too, for comparison with the above result on mobile web. (edit: replaced with correctly labeled chart)

Time spent per pageview session on Android (90th percentile).png (418×723 px, 18 KB)

Data source:

SET @prev_dayhour = 0;
SET @rownum = 0;
SELECT numberedlist.dayhour, 
  AVG(numberedlist.timespent) AS percentile_timespent, 
  AVG(rows_per_dayhour.total_rows) AS samples 
FROM (
  SELECT IF(@prev_dayhour <> ordered_data.dayhour, @rownum:=1, @rownum:= @rownum +1) AS row_number, 
    @prev_dayhour:= ordered_data.dayhour,
    ordered_data.dayhour AS dayhour, 
    ordered_data.timespent AS timespent
  FROM (
    SELECT LEFT(timestamp, 10) AS dayhour, event_timeSpent AS timespent, 
      event_appInstallID, event_PageId, wiki 
    FROM log.MobileWikiAppPageScroll_14591606
    WHERE  timestamp LIKE '20160107%'  
      AND event_pageId <> 0 
    GROUP BY event_appInstallID, event_PageId, wiki
    ORDER BY dayhour, timespent) AS ordered_data )
  AS numberedlist
INNER JOIN (
  SELECT COUNT(*) AS total_rows, LEFT(timestamp, 10) AS dayhour
  FROM (
    SELECT timestamp, event_appInstallID, event_PageId, wiki, 
      event_timeSpent AS timespent
    FROM log.MobileWikiAppPageScroll_14591606 
    WHERE  timestamp LIKE '20160107%'
      AND event_pageId <> 0 
    GROUP BY event_appInstallID, event_PageId, wiki) 
    AS pageviewsessions 
    GROUP BY dayhour)
  AS rows_per_dayhour
ON numberedlist.dayhour = rows_per_dayhour.dayhour 
WHERE
numberedlist.row_number >= rows_per_dayhour.total_rows*0.9 AND
numberedlist.row_number <= rows_per_dayhour.total_rows*0.9+1
GROUP BY numberedlist.dayhour
ORDER BY numberedlist.dayhour
--------------

dayhour	percentile_timespent	samples
2016010700	178.0000	4652.0000
2016010701	179.0000	3889.0000
2016010702	177.0000	3929.0000
2016010703	162.0000	3242.0000
2016010704	165.0000	3225.0000
2016010705	171.0000	3086.0000
2016010706	171.0000	3512.0000
2016010707	184.0000	3455.0000
2016010708	180.0000	3262.0000
2016010709	168.0000	3659.0000
2016010710	151.0000	3663.0000
2016010711	157.0000	4106.0000
2016010712	138.0000	4632.0000
2016010713	152.0000	4704.0000
2016010714	152.0000	4950.0000
2016010715	148.0000	5031.0000
2016010716	151.0000	5062.0000
2016010717	163.0000	5017.0000
2016010718	150.0000	5431.0000
2016010719	149.0000	5809.0000
2016010720	154.0000	6357.0000
2016010721	158.0000	6257.0000
2016010722	167.0000	5525.0000
2016010723	169.0000	4818.0000

(query ran on s1-analytics-slave.eqiad.wmnet )

(work log)
Update on 5:
And here is the same chart for the 75th percentile of time-to-exist on Android. One gets the impression that the times there might be 30-40 seconds longer than on mobile web with sections uncollapsed (again, not measuring the same).

Time spent per pageview session on Android (75th percentile).png (418×723 px, 17 KB)

Data source:

SET @prev_dayhour = 0;
SET @rownum = 0;
SELECT numberedlist.dayhour,
  AVG(numberedlist.timespent) AS percentile_timespent,
  AVG(rows_per_dayhour.total_rows) AS samples
FROM (
  SELECT IF(@prev_dayhour <> ordered_data.dayhour, @rownum:=1, @rownum:= @rownum +1) AS row_number,
    @prev_dayhour:= ordered_data.dayhour,
    ordered_data.dayhour AS dayhour,
    ordered_data.timespent AS timespent
  FROM (
    SELECT LEFT(timestamp, 10) AS dayhour, event_timeSpent AS timespent,
      event_appInstallID, event_PageId, wiki
    FROM log.MobileWikiAppPageScroll_14591606
    WHERE  timestamp LIKE '20160107%'
      AND event_pageId <> 0
    GROUP BY event_appInstallID, event_PageId, wiki
    ORDER BY dayhour, timespent) AS ordered_data )
  AS numberedlist
INNER JOIN (
  SELECT COUNT(*) AS total_rows, LEFT(timestamp, 10) AS dayhour
  FROM (
    SELECT timestamp, event_appInstallID, event_PageId, wiki,
      event_timeSpent AS timespent
    FROM log.MobileWikiAppPageScroll_14591606
    WHERE  timestamp LIKE '20160107%'
      AND event_pageId <> 0
    GROUP BY event_appInstallID, event_PageId, wiki)
    AS pageviewsessions
    GROUP BY dayhour)
  AS rows_per_dayhour
ON numberedlist.dayhour = rows_per_dayhour.dayhour
WHERE
numberedlist.row_number >= rows_per_dayhour.total_rows*0.75 AND
numberedlist.row_number <= rows_per_dayhour.total_rows*0.75+1
GROUP BY numberedlist.dayhour
ORDER BY numberedlist.dayhour

dayhour percentile_timespent    samples
2016010700      73.0000 4652.0000
2016010701      78.0000 3889.0000
2016010702      75.0000 3929.0000
2016010703      70.0000 3242.0000
2016010704      71.0000 3225.0000
2016010705      79.0000 3086.0000
2016010706      80.0000 3512.0000
2016010707      81.0000 3455.0000
2016010708      76.0000 3262.0000
2016010709      73.0000 3659.0000
2016010710      72.0000 3663.0000
2016010711      67.0000 4106.0000
2016010712      65.0000 4632.0000
2016010713      69.0000 4704.0000
2016010714      67.0000 4950.0000
2016010715      69.0000 5031.0000
2016010716      68.0000 5062.0000
2016010717      76.0000 5017.0000
2016010718      69.0000 5431.0000
2016010719      67.0000 5809.0000
2016010720      74.0000 6357.0000
2016010721      71.0000 6257.0000
2016010722      76.0000 5525.0000
2016010723      79.0000 4818.0000

(query ran on s1-analytics-slave.eqiad.wmnet )

(work log)
Regarding no. 3 in a slightly modified version, I've been looking at the number of actions (of all four kinds) during one pageview that were not followed by another one within 3 seconds, calling them "read events" (as opposed to navigation events). Below is a first result:

Read events per pageview (January 7, 2016 0h-1h).png (371×600 px, 13 KB)

This is covering one hour's worth of data only, with a longer query still running. With that caveat (that we yet have to get a sense of how much the data varies), it seems that in the test condition - by default uncollapsed - there are somewhat fewer "read events".

Data source:

SELECT isTestA, number_of_readevents, COUNT(*) AS number_of_pageviewsessions FROM
	(SELECT isTestA, sessionId, pageId, wiki, COUNT(*) AS number_of_readevents FROM
		(SELECT isTestA, @prev_timest:=ordered_data.timest, @prev_sessionId:=ordered_data.sessionId, ordered_data.sessionId AS sessionId, ordered_data.timest AS timest, ordered_data.eventName AS eventName, ordered_data.PageId AS PageId, ordered_data.wiki AS wiki FROM
		  (SELECT event_isTestA AS isTestA, event_sessionId AS sessionId, 86400*MID(timestamp,7,2)+3600*MID(timestamp,9,2)+60*MID(timestamp,11,2)+MID(timestamp,13,2) AS timest, event_eventName AS eventName, event_PageId AS PageId, wiki 
		   FROM log.MobileWebSectionUsage_15038458 WHERE timestamp LIKE '2016010700%' AND event_isTablet = 0 AND event_namespace = 0 AND event_pageId <> 0
		   ORDER BY event_sessionId, timest) AS ordered_data
		   HAVING (timest > @prev_timest + 2) OR (sessionId > @prev_sessionId)
		ORDER BY isTestA, sessionId, pageId, wiki, timest)  AS readevents_by_sessions
	GROUP BY isTestA, sessionId, pageId, wiki) AS pageviewsession_with_counts
GROUP BY number_of_readevents, isTestA
ORDER BY number_of_readevents, isTestA;

Update regarding 5 (compare pageview session durations for test and control group, defined as the time between "entered" and the last event logged on the same page):

I compared the hourly 90th percentile for a longer timespan than one day (the initial result above), namely the week from January 2-8, 2016 (as already mentioned earlier):

Pageview session duration (90th percentile) with sections initially collapsed vs expanded, 2016-01-02..08.png (418×868 px, 31 KB)

This confirms the conclusion that interested readers spend considerably more time on the page when the sections are not collapsed initially.

Two small caveats about the data:

  1. For the day examined in the earlier query (January 7), these hourly numbers don't match exactly. For now I'm assuming that - apart from the aforementioned small truncation effects in the first and last hour of Jan 7 - this is most likely to the (long known but still unresolved) EventLogging data corruption issues documented in T131236, whereby the same query gives different results depending on whether it is run on s1 or store. (The one-week query was run on store, the one-day query was run on s1.)
  2. Considering that the numbers were quite high on the first day examined (Saturday Jan 2), it would be desirable to examine a longer timespan of two or more weeks to examine weekly patterns. But considering that this query already took more than 11 days to complete and that on the other hand we are now getting DBA pushback regarding some long/un-optimized queries, I eschewed that for now.

Data source:

SET @prev_dayhour = 0;
SET @prev_isTestA = 0;
SET @rownum = 0;
SELECT numberedlist.dayhour, numberedlist.isTestA,
  AVG(numberedlist.duration) AS percentile_duration,
  AVG(rows_per_dayhour_and_isTestA.total_rows) AS samples
FROM (
  SELECT IF(@prev_dayhour <> ordered_data.dayhour OR @prev_isTestA <> isTestA, @rownum:=1, @rownum:= @rownum +1) AS row_number,
    @prev_dayhour:= ordered_data.dayhour, @prev_isTestA:= isTestA,
    ordered_data.dayhour AS dayhour,
    ordered_data.isTestA AS isTestA,
    ordered_data.duration AS duration
  FROM (
    SELECT LEFT(mintime, 10) AS dayhour, isTestA,
      ( 60*MID(maxtime,11,2)+MID(maxtime,13,2) - 60*MID(mintime,11,2)-MID(mintime,13,2) ) AS duration
    FROM (
      SELECT event_isTestA AS isTestA, event_sessionId, event_PageId, wiki,
        MIN(timestamp) AS mintime, MAX(timestamp) AS maxtime
      FROM log.MobileWebSectionUsage_15038458
      WHERE  (timestamp BETWEEN '20160102' AND '20160109')
        AND event_isTablet = 0 AND event_namespace = 0 AND event_sessionId <> '' AND event_pageId <> 0
      GROUP BY isTestA, event_sessionId, event_PageId, wiki) AS pageviewsessions
      ORDER BY dayhour, isTestA, duration )
    AS ordered_data
    ORDER BY dayhour, isTestA, duration)
  AS numberedlist
INNER JOIN (
  SELECT COUNT(*) AS total_rows, LEFT(mintime, 10) AS dayhour, isTestA
  FROM (
    SELECT event_isTestA AS isTestA, event_sessionId, event_PageId, wiki,
      MIN(timestamp) AS mintime
    FROM log.MobileWebSectionUsage_15038458
    WHERE  (timestamp BETWEEN '20160102' AND '20160109')
      AND event_isTablet = 0 AND event_namespace = 0 AND event_sessionId <> '' AND event_pageId <> 0
    GROUP BY isTestA, event_sessionId, event_PageId, wiki)
    AS pageviewsessions
    GROUP BY dayhour, isTestA)
  AS rows_per_dayhour_and_isTestA
ON numberedlist.dayhour = rows_per_dayhour_and_isTestA.dayhour
  AND numberedlist.isTestA = rows_per_dayhour_and_isTestA.isTestA
WHERE
numberedlist.row_number >= rows_per_dayhour_and_isTestA.total_rows*0.9 AND
numberedlist.row_number <= rows_per_dayhour_and_isTestA.total_rows*0.9+1
GROUP BY numberedlist.dayhour, isTestA
ORDER BY numberedlist.dayhour, isTestA

(accessing analytics-store.eqiad.wmnet)

Update regarding 2 (scroll/open events that are not followed by another event within the next 5 seconds, to distinguish focused reading from navigation activities):

We decided to look at this in terms of the time a reader spent reading vs. navigating on a page. A timespan between events that are 5 seconds or more apart is assumed to consist of reading, and if subsequent events are 4 seconds or less apart, they are assumed to form part of a continued navigating activity. (I.e. the time the reader spends on a page is split into alternating periods of reading and navigating, with navigating periods ending with a scroll/open event that is not followed by another one within 4 seconds. As with the duration calculation above, a limitation is that we only cover the time until the last event on the page, i.e. disregard the last reading period before the reader leaves the page.)
After sorting out a lot of technical problems and circumventing some unresolved mysteries regarding our MySQL environment, here are some results. The takeaway is that readers in the test condition spend considerably more time reading, and somewhat less time navigating.

Time spent reading a particular page:

condition90th percentile75th percentilemedian
test (expanded)190 sec53 sec6sec
control (collapsed)146 sec38 sec5sec

Time spent navigating a particular page:

condition90th percentile75th percentilemedian
test (expanded)4 sec1 sec0 sec
control (collapsed)6 sec3 sec0 sec

(Note that these numbers don't necessarily add up to those for the total pageview session duration in the charts above, for example because here the percentiles were taken separately for reading and navigating times.)

Data source

(All numbers refer to a 24 hour sample from January 7, 2016. Due to the limitations of EventLogging, all durations can only be measured in integer multiples of a second. As a sanity check, to examine how much the above momenta might vary randomly, I arbitrarily and randomly divided the sample into 16 subgroups per the first character of the sessionId, and calculated the 90th percentile of the reading time for each. The result - below - makes it safe to assume that the difference between test and control observed above for this momentum is indeed significant.)


CREATE TABLE staging.tbayer_readnavevents_20160107 (isTestA tinyint(1), sessionId varbinary(191), wiki varbinary(191), pageId bigint(20), timest int, eventName varbinary(191));
SET @timest =0;
SET @prev_timest=0;
SET @prev_session_Id ='';
SET @prev_PageId = 0;
SET @prev_wiki = '' COLLATE utf8_unicode_ci;
INSERT INTO staging.tbayer_readnavevents_20160107
SELECT event_isTestA AS isTestA, event_sessionId AS sessionId,
         wiki, event_PageId AS PageId,         86400*MID(timestamp,7,2)+3600*MID(timestamp,9,2)+60*MID(timestamp,11,2)+MID(timestamp,13,2) AS timest,
        event_eventName AS eventName
                FROM log.MobileWebSectionUsage_15038458
                WHERE timestamp LIKE '20160107%' AND event_isTablet = 0 AND event_namespace = 0 AND event_pageId <> 0
                ORDER BY isTestA, event_sessionId, pageId, wiki, timest

CREATE TABLE staging.tbayer_readnavtimesessions5sec_20160107 (readtime int, navtime int, isTestA tinyint(1), sessionId varbinary(191), pageId bigint(20), wiki varbinary(191));
SET @evtimest =0;
SET @prev_evtimest=0;
SET @prev_session_Id ='';
SET @prev_PageId = 0;
SET @prev_wiki = '' COLLATE utf8_unicode_ci;
INSERT INTO staging.tbayer_readnavtimesessions5sec_20160107
SELECT SUM(readseconds) AS readtime, SUM(navseconds) AS navtime, isTestA, sessionId, PageId, wiki FROM
        (SELECT
                @evtimest:=timest,
                IF( (@evtimest > @prev_evtimest +4) AND (sessionId = @prev_sessionId) AND (pageId = @prev_PageId) AND (wiki = @prev_wiki),
                   @evtimest - @prev_evtimest, 0) AS readseconds,
                IF( (@evtimest <= @prev_evtimest +4) AND (sessionId = @prev_sessionId) AND (pageId = @prev_PageId) AND (wiki = @prev_wiki),
                   @evtimest - @prev_evtimest, 0) AS navseconds,
                isTestA,
                @prev_evtimest:= @evtimest, @prev_sessionId:=sessionId, @prev_PageId:=PageId, @prev_wiki:=wiki,
                sessionId, eventName,
                PageId,
                wiki
        FROM staging.tbayer_readnavevents_20160107
        ORDER BY isTestA, sessionId, pageId, wiki, timest) AS events_with_readnavtime
GROUP BY isTestA, sessionId, pageId, wiki
ORDER BY isTestA, sessionId, pageId, wiki;
SELECT * FROM staging.tbayer_readnavtimesessions5sec_20160107 WHERE navtime > 0 LIMIT 20;
DROP TABLE staging.tbayer_readnavtimesessions5sec_20160107 ;
# repeat exactly the same
CREATE TABLE staging.tbayer_readnavtimesessions5sec_20160107 (readtime int, navtime int, isTestA tinyint(1), sessionId varbinary(191), pageId bigint(20), wiki varbinary(191));
SET @evtimest =0;
SET @prev_evtimest=0;
SET @prev_session_Id ='';
SET @prev_PageId = 0;
SET @prev_wiki = '' COLLATE utf8_unicode_ci;
INSERT INTO staging.tbayer_readnavtimesessions5sec_20160107
SELECT SUM(readseconds) AS readtime, SUM(navseconds) AS navtime, isTestA, sessionId, PageId, wiki FROM
        (SELECT
                @evtimest:=timest,
                IF( (@evtimest > @prev_evtimest +4) AND (sessionId = @prev_sessionId) AND (pageId = @prev_PageId) AND (wiki = @prev_wiki),
                   @evtimest - @prev_evtimest, 0) AS readseconds,
                IF( (@evtimest <= @prev_evtimest +4) AND (sessionId = @prev_sessionId) AND (pageId = @prev_PageId) AND (wiki = @prev_wiki),
                   @evtimest - @prev_evtimest, 0) AS navseconds,
                isTestA,
                @prev_evtimest:= @evtimest, @prev_sessionId:=sessionId, @prev_PageId:=PageId, @prev_wiki:=wiki,
                sessionId, eventName,
                PageId,
                wiki
        FROM staging.tbayer_readnavevents_20160107
        ORDER BY isTestA, sessionId, pageId, wiki, timest) AS events_with_readnavtime
GROUP BY isTestA, sessionId, pageId, wiki
ORDER BY isTestA, sessionId, pageId, wiki;
SELECT * FROM staging.tbayer_readnavtimesessions5sec_20160107 WHERE navtime > 0 LIMIT 20;

 (yes, for some crazy reason this query, and some others, failed to produce valid results on the first try every time, generating NULL values; but produced valid data - checked in various ways - when repeated immediately afterwards. Maybe some kind of timeout issue on the DB server?)


SELECT isTestA, COUNT(*)  FROM staging.tbayer_readnavtimesessions5sec_20160107  WHERE isTestA IS NOT NULL GROUP BY isTestA;
+---------+----------+
| isTestA | COUNT(*) |
+---------+----------+
|       0 |   749410 |
|       1 |   748945 |
+---------+----------+
2 rows in set (0.47 sec)


SET @rownum = 0;
SET @prev_isTestA = -1;
SELECT numberedlist.isTestA AS isTestA, AVG(readtime) AS 90pc_readtime FROM
  (SELECT isTestA, IF(@prev_isTestA <> isTestA, @rownum:=1, @rownum:= @rownum +1) AS row_number, 
  readtime, @prev_isTestA:= isTestA FROM (
    SELECT isTestA, readtime FROM staging.tbayer_readnavtimesessions5sec_20160107 
     WHERE isTestA IS NOT NULL 
     ORDER BY isTestA, readtime) AS ordered_data
  ORDER BY isTestA, readtime) AS numberedlist
INNER JOIN
  (SELECT isTestA, COUNT(*) AS total_rows 
  FROM staging.tbayer_readnavtimesessions5sec_20160107
   WHERE isTestA IS NOT NULL 
   GROUP BY isTestA) AS row_counting
ON numberedlist.isTestA = row_counting.isTestA
WHERE
numberedlist.row_number >= row_counting.total_rows*0.9 AND
numberedlist.row_number <= row_counting.total_rows*0.9+1
GROUP BY isTestA;
+---------+---------------+
| isTestA | 90pc_readtime |
+---------+---------------+
|       0 |      146.0000 |
|       1 |      190.0000 |
+---------+---------------+
2 rows in set (2.99 sec)

(and mutatis mutandis for other percentiles, and with navtime instead of readtime)


SET @rownum = 0;
SET @prev_isTestA = -1;
SET @prev_idgroup = -1;
SELECT numberedlist.idgroup, numberedlist.isTestA AS isTestA, AVG(readtime) AS 90pc_readtime FROM
  (SELECT idgroup, isTestA, IF(@prev_idgroup <> idgroup OR @prev_isTestA <> isTestA, @rownum:=1, @rownum:= @rownum +1) AS row_number, 
  readtime, @prev_isTestA:= isTestA, @prev_idgroup:= idgroup FROM (
    SELECT LEFT(sessionId, 1) AS idgroup,
      isTestA, readtime FROM staging.tbayer_readnavtimesessions5sec_20160107 WHERE isTestA IS NOT NULL ORDER BY isTestA, readtime) AS ordered_data
  ORDER BY idgroup, isTestA, readtime) AS numberedlist
INNER JOIN
  (SELECT LEFT(sessionId, 1) AS idgroup, isTestA, COUNT(*) AS total_rows 
  FROM staging.tbayer_readnavtimesessions5sec_20160107  WHERE isTestA IS NOT NULL 
  GROUP BY idgroup, isTestA) AS row_counting
ON numberedlist.idgroup = row_counting.idgroup AND numberedlist.isTestA = row_counting.isTestA
WHERE
numberedlist.row_number >= row_counting.total_rows*0.9 AND
numberedlist.row_number <= row_counting.total_rows*0.9+1
GROUP BY idgroup, isTestA
ORDER BY isTestA, idgroup;

+---------+---------+---------------+
| idgroup | isTestA | 90pc_readtime |
+---------+---------+---------------+
| 0       |       0 |      151.0000 |
| 1       |       0 |      144.0000 |
| 2       |       0 |      144.0000 |
| 3       |       0 |      145.0000 |
| 4       |       0 |      149.0000 |
| 5       |       0 |      147.0000 |
| 6       |       0 |      145.0000 |
| 7       |       0 |      144.0000 |
| 8       |       0 |      146.0000 |
| 9       |       0 |      149.0000 |
| a       |       0 |      144.0000 |
| b       |       0 |      147.0000 |
| c       |       0 |      147.0000 |
| d       |       0 |      145.0000 |
| e       |       0 |      147.0000 |
| f       |       0 |      146.0000 |
|         |       1 |      198.0000 |
| 0       |       1 |      192.0000 |
| 1       |       1 |      197.0000 |
| 2       |       1 |      199.0000 |
| 3       |       1 |      189.0000 |
| 4       |       1 |      185.0000 |
| 5       |       1 |      185.0000 |
| 6       |       1 |      185.0000 |
| 7       |       1 |      193.0000 |
| 8       |       1 |      192.0000 |
| 9       |       1 |      186.0000 |
| a       |       1 |      187.0000 |
| b       |       1 |      190.0000 |
| c       |       1 |      192.0000 |
| d       |       1 |      194.0000 |
| e       |       1 |      189.0000 |
| f       |       1 |      187.0000 |
+---------+---------+---------------+
33 rows in set (5.43 sec)

Update re 1 (compare how many sections are scrolled into view in the uncollapsed view with how many are opened in the collapsed view):

Here is a direct comparison in form of a histogram showing the frequency of pageviews (or pageview sessions) where a certain number of sections was opened/scrolled into view.

Number of sections 'touched' in collapsed vs. uncollapsed condition (histogram).png (441×714 px, 21 KB)

Note that this is a bit apples to oranges for various reasons, including the fact that sometimes sections are already scrolled into view on pageload without any user action - but per the discussion here we assume these cases are rare enough. Opening a section is normally a deliberate decision based on the content of its headline, whereas (almost per definition) the reader doesn't yet know what a section is about when it is scrolled into view. With all that in mind though, it is still reasonable to interpret the result as a strong indication that readers in the test group are more engaged with the content below the (always expanded) lead section.

Data sources:

See above for the control condition. For the test condition:

SELECT sections_scrolled_into_view, COUNT(*) as number_of_pageviewsessions FROM (SELECT event_sessionId, event_PageId, wiki, (COUNT(*)-1) AS sections_scrolled_into_view FROM log.MobileWebSectionUsage_15038458 WHERE timestamp LIKE '2016010700%' AND (event_eventName = 'entered' OR event_eventName = 'scrolled-into-view') AND event_isTestA = TRUE AND event_isTablet = 0 AND event_namespace = 0 AND event_sessionId <> '' AND event_pageId <> 0 GROUP BY event_sessionId, event_PageId, wiki) AS pageviewsessions GROUP BY sections_scrolled_into_view ORDER BY sections_scrolled_into_view
--------------

sections_scrolled_into_view     number_of_pageviewsessions
0       10631
1       7055
2       4242
3       2702
4       2123
5       1501
6       1045
7       670
8       458
9       259
10      209
11      124
12      85
13      59
14      29
15      17
16      12
17      11
18      7
19      6
20      3
21      2
22      3
23      2
24      5
25      3
26      1
27      1
28      1
29      1
31      1
33      2
39      1
46      1
50      1
58      1
87      1

(ca. 28 minutes)

Regarding no. 3, I checked the current usage of the TOC on the Android app: 17.1% of daily users open the TOC at least once, and 13.4% actually use it, i.e. click on at least one section in the TOC. If one sees the group of collapsed sections in the default view on mobile web as a kind of TOC, one can directly compare the latter app metric with the ratio of mobile web browser sessions on a given day where at least one collapsed section is opened. I'm going to run a query for that next. We already know that even in a single pageview, at least one section is opened in about 40% of cases, and the ratio per session and day will likely (although not certainly) be higher than that.

Update: Unfortunately, the sampling bug subsequently encountered in the instrumentation (see T128931#2293576 ) that made subtask 4 impossible is thwarting this plan for subtask 3, too - it turned out we don't have valid browser session data in this schema.

One could think about instead comparing the aforementioned per-pageview result from the web ("at least one section is opened in about 40% of cases") or more generally the above histogram with suitable data for the TOC on Android. Sadly though the Android instrumentation lacks the analogue of the "entered" event when the page is first opened, i.e. there is no baseline on how often a page is opened without any TOC interaction.

Also, I don't see a valid way to directly compare the scroll flux data in the Android scroll schema with the "scrolled-into-view" events for sections here.

So regarding 3., we are left with the above result about time spent per pageview, from the separate scroll instrumentation on Android: "... the times there might be 30-40 seconds longer than on mobile web with sections uncollapsed" - one caveat being, as mentioned, that the web data does not count the time after the last section open/scroll event when the user is still reading the page before leaving it. Still, 30-40 seconds would seem rather long for that. Such a difference would be consistent with the notions that app readers are more engaged in general. But in any case it is not terribly relevant for the main question of this task.

This comment was removed by Tbayer.

There are still various interesting open questions and unexplored avenues for examining this data, some of which we might revisit, but by now all planned analyses have been completed and results documented here (or for those which were not possible as planned due to bugs, that fact has been documented here instead.) I am writing up a more readable summary of the main results at https://meta.wikimedia.org/wiki/Research:Collapsed_vs_uncollapsed_section_view_on_mobile_web