Page MenuHomePhabricator

slow indexing of new Items on Wikidata?
Closed, ResolvedPublic

Description

We have some anecdodal evidence that recently indexing of new Items in the search index on Wikidata takes longer - in the order of 10 to 15 minutes. Do we have any stats to confirm this?

In the past we have added special handling to get newly created Items added to the search index fast. This was done because the search index powers the entity selector for making new statements. The workflow of creating a new Item and then immediately wanting to select that Item as the value of a new statement is frequent and hindered by a large lack. (It's still possible to add the value by using the Item's ID but it's not great.)

Event Timeline

Restricted Application added a subscriber: Aklapper. · View Herald Transcript

Lexemes are also taking longer than they used to to show up, although I haven't checked whether it's taking as long as items.

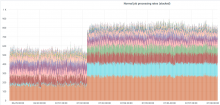
Looking at the metrics of the cirrusElasticaWrite job it seems that its backlog time was greatly degraded just after the DC switch (June 28). I don't see anything particular in other dashboards that could explain such difference in latency.

Checked a few things, looking for why this job would have increased it's backlog. Most notable metric change is that eqiad was processing ElasticaWrites at a rate of ~150 for the partitioned topic. codfw is currently averaging over 250, Where did the extra 100 comes from (and what unit are they?).

Sources ruled out:

  • ElasticaWrite jobs can retry, and these aren't marked as part of the normal job queue retries. Observability comes through logsmatching ElasticaWrite job reported failure on cluster. July logs show we peak at a few hundred per hour, not large enough to influence this.

The ElasticaWrite job seems to be receiving roughly the same amount of messages (150/s per partition on average) before and after the switch.
Looking at the partitioned topic ElasticWrite it's heavily backlogged since the switch:

Capture d’écran du 2021-07-29 10-57-33.png (663×1 px, 235 KB)

A huge backlog of 5 million messages have been accumulated from jun 28 and starts to be absorbed since jul 2. It matches a big bump in processing rates of changeprop consumers which is explained by a restart of some of the cpjobqueue pods that were behaving poorly :

Capture d’écran du 2021-07-29 15-15-03.png (678×1 px, 360 KB)

Job timings as reported by changeprop do not suggest an increase (quite the opposite) but looking at cirrus backend logs for send_data_write there is clearly a bump in request_time (see P16924, roughly + 15ms) but could perhaps be explained because jobrunners running in codfw now have to write 2 distant elasticsearch clusters (prod-eqiad and cloudelastic) as opposed to one. Also the jobqueue reports a processing time of 250 to 300ms both before and after the switch so I'm not sure that +15ms between mw and elastic could cause such a change.

The consumer group lag suggests that we lack processing power but we don't seem to produce more ElasticaWrite jobs or I can't find any evidence...
The increase in processing rate could perhaps be explained by the backlog causing the jobqueue to consume messages in bursts?

So possible cause of the backlog:

  • more messages produced to cirrusElasticWrite after the switch?
    • the week before the switch this topic ingested 128,916,000 messages the week after 147,295,000 (+14%).
  • processing time of the job increased?
    • can't find any evidence of this except a small increase in mw <-> elastic timings but not visible in the job processing time
  • changeprop not giving enough room to this job?
    • seemed to have been the case just after switch but then the processing rates went higher then usual

Hi @hnowlan in case you have ideas, we're investigating why the cirrusSearchElasticaWrite job is being backlogged more frequently since the switch. There does not seem to be more messages produced to it nor we see more indexing requests sent to elastic (this job is responsible for sending data to elasticsearch) but the processing rate suggests that we're processing a lot more than before the switch.

Hi @hnowlan in case you have ideas, we're investigating why the cirrusSearchElasticaWrite job is being backlogged more frequently since the switch. There does not seem to be more messages produced to it nor we see more indexing requests sent to elastic (this job is responsible for sending data to elasticsearch) but the processing rate suggests that we're processing a lot more than before the switch.

Hey, apologies for the delay, I've been PTO. Unfortunately I don't have any good explanations for the time being. It appears that there's been some contention on the k8s cluster leading to evictions, and one jobqueue process might have been in a bad state due to memory usage issues. I've done a full redeploy to iron out any potential issues that might be there, and I'm going to monitor the usage throughout the day today to see if we need to increase our resource thresholds a little more. It would be odd if we need to as both eqiad and codfw have the same, but similar has happened before with changeprop. Tagging @Pchelolo to see if he has any ideas too

Current rates and backlog on ElasticaWrite look reasonable, p99 backlog is under 10m, roughly comparable to the numbers we saw in eqiad. Overall looks healthy.

Quasi relatedly though, the backlog on cirrusSearchIncomingLinkCount has increased recently. The backlog is typically under 2 min but it's been 2 hours for the last couple days. This job is less worrying though, it's updating some statistics used for search relevance and lagged updates won't cause any visible regressions. This job should perhaps be monitored, but nothing to do now.

Overall this seems resolved from our side, but I'm not sure how to really call it done. Ideally we'd have a metric indicating the user-perceived update lag but that doesn't exist today.

I wrote a quick script (P17040) to read the public event streams to get revision timestamps, and then poll the mediawiki api's to find out which revision we have indexed in search. I haven't run any fancy stats over it, but the output over a few minutes of running is all numbers in the 10-60s range. Plausibly the concept of this script could be expanded into a prometheus metric that can go on a dashboard somewhere.

@EBernhardson That is a very nice script! Thanks for annotating it, so I almost understand everything going on. 😅
I just ran it for a few minutes and I saw lags of 70-162 seconds. The highest being of a lexeme.

Gehel claimed this task.

We have editors experiencing problems like this again. Can you have another look please?

I'm not sure if everybody knows what "60s" or "162s" (what may seem quick) actually means to editors: it's the time they wait between creating the item and adding it as a statement value (which there seems long).

Personally, I paste qids as search isn't efficient for this.

An alternative could be to finally build a feature that allows creating new items directly from statement entry (e.g. type a label, click "create person item").

To do something about this some number needs to be decided on. What is the appropriate amount of acceptable lag? From the search engine perspective a minute or even five is considered fully working. If we set a particular number though we can then monitor it and try and look for ways to get it consistently below that number. Lower numbers will be more difficult, but we can ponder ways.

I'm not sure if everybody knows what "60s" or "162s" (what may seem quick) actually means to editors: it's the time they wait between creating the item and adding it as a statement value (which there seems long).

I would have to argue that this workflow is built on a sandy base. Search has never been able to guarantee quick turnaround, and should likely not be used in any case where the user is likely to have just created an item. Alternatively some process might be able to either query or keep track of all the things the user has created in the last few minutes and brute force search through that small pile in javascript/php or some such.