Page MenuHomePhabricator

Change graphite aggregation function for cassandra 'count' metrics
Closed, ResolvedPublic

Description

As seen on the Cassandra storage load dashboard:

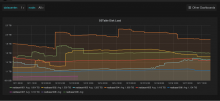
Viewing the last 7 days, the values seem correct:

Grafana - RESTBase :: Cassandra :: System 2015-12-17 13-42-03.png (588×1 px, 73 KB)

Viewing the last 30 days, the values jump by an order of magnitude:

Grafana - RESTBase :: Cassandra :: System 2015-12-17 13-42-17.png (588×1 px, 89 KB)

Using the same query string in Graphite directly (aliasByNode(cassandra.restbase1*.org.apache.cassandra.metrics.Storage.Load.count, 1)):
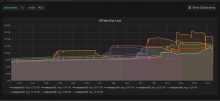
9.png (439×1 px, 37 KB)

Related Objects

Event Timeline

Eevans raised the priority of this task from to Needs Triage.
Eevans updated the task description. (Show Details)
Eevans added projects: SRE, RESTBase-Cassandra.
Eevans subscribed.

I think that has to do on how we aggregated .count metrics

[count]
aggregationMethod = sum
pattern = \.count$
xFilesFactor = 0.01

and the retention

[default]
pattern = .*
retentions = 1m:7d,5m:14d,15m:30d,1h:1y
Andrew triaged this task as Medium priority.Apr 14 2016, 7:45 PM

I think that has to do on how we aggregated .count metrics

[count]
aggregationMethod = sum
pattern = \.count$
xFilesFactor = 0.01

and the retention

[default]
pattern = .*
retentions = 1m:7d,5m:14d,15m:30d,1h:1y

Yes. This would make sense. Do you remember why we aggregated these like this? The \.count$ metrics in Cassandra should be treated as a gauge, I think, and aggregated by-average instead.

Eevans moved this task from Backlog to In-Progress on the Cassandra board.

I think it comes from statsd recommendation on how to aggregate graphite metrics (https://github.com/etsy/statsd/blob/master/docs/graphite.md). Reading the carbon code it seems the schemas are a list, so we could match the cassandra specific .count metrics first and aggregate on average instead

fgiunchedi renamed this task from Grafana bugginess; Graph scales sometimes off by an order of magnitude to change graphite aggregation function for cassandra 'count' metrics.May 26 2016, 11:27 AM
fgiunchedi set Security to None.

If this is really a gauge, should the cassandra metric reporter perhaps report it as such?

graphite has no metric type per-se so everything is a gauge, though the .count naming convention to indicate counters is statsd's not graphite's

If this is really a gauge, should the cassandra metric reporter perhaps report it as such?

@fgiunchedi and I discussed this; It would be trivial to do.

The downsides are that it would be the first breaking change to metric name compatibility with the in-built Cassandra reporter (other than the histograms that were unusable anyway). It would also break all of the effected dashboards (easy enough to fix I guess, just tedious). And, it seems that the metric reporter has other users now, so it would similarly break things for them.

I suggested that if we do go this route, that we implement it as a generic name rewriting feature (which would still be pretty trivial to implement). That only addresses the latter of the above concerns though.

Eevans renamed this task from change graphite aggregation function for cassandra 'count' metrics to Change graphite aggregation function for cassandra 'count' metrics.Aug 18 2016, 1:51 PM

Taking this, I'll be changing graphite's storage_aggregation to account for cassandra's count metrics

Change 316810 had a related patch set uploaded (by Filippo Giunchedi):
graphite: change Cassandra '.count' metrics aggregation

https://gerrit.wikimedia.org/r/316810

Change 316810 merged by Filippo Giunchedi:
graphite: change Cassandra '.count' metrics aggregation

https://gerrit.wikimedia.org/r/316810

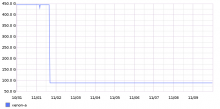
I've updated xenon and cerium aggregation methods for all .count metrics, @Eevans let's compare those in a week or so

Mentioned in SAL (#wikimedia-operations) [2016-11-09T23:38:37Z] <godog> update cassandra aggregation scheme for 'count' metrics - T121789

This is complete, aggregation method changed everywhere.