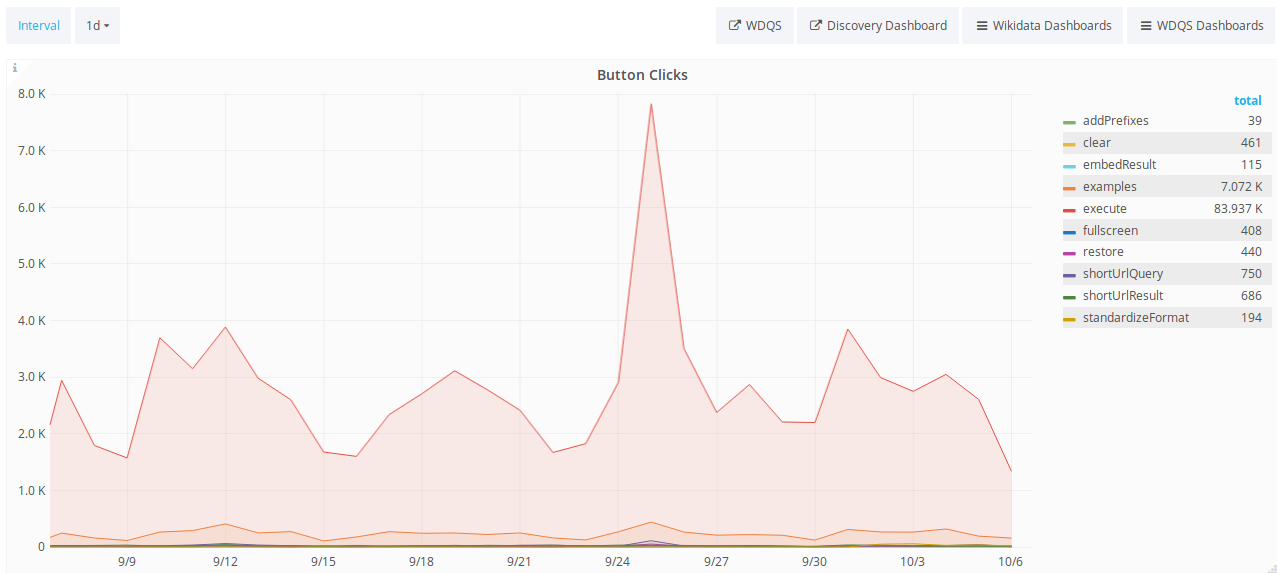
Please set a logarithmic scale for the y axis of the "Button Clicks" panel, part of the "Query Service UI" Grafana dashboard. The action "execute" has too many clicks, which causes the graph doesn't show relevant insights.
| abian | |
| Oct 6 2018, 3:37 PM |
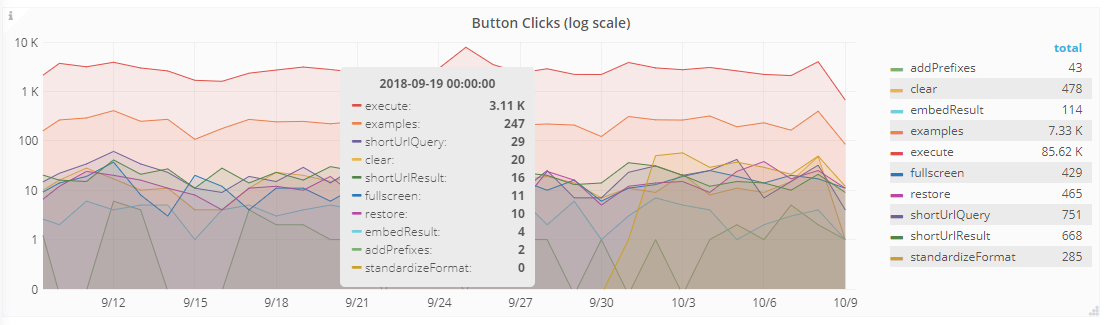
| F26436776: image.png | |
| Oct 9 2018, 9:31 AM |
| F26337476: l-graph.png | |
| Oct 6 2018, 3:37 PM |
Please set a logarithmic scale for the y axis of the "Button Clicks" panel, part of the "Query Service UI" Grafana dashboard. The action "execute" has too many clicks, which causes the graph doesn't show relevant insights.