Page MenuHomePhabricator

INCIDENT: k8s@codfw prometheus queries disabled -- very slow to execute some queries
Closed, ResolvedPublic

Description

At 20:35UTC on Mar 5th, we were paged for the prometheus codfw svc IP, as well as grafana.

The apache on grafana1001 was unhealthy, as was the apache on prometheus2004. CPU usage on prometheus2004 was very high. (prometheus2003 is depooled for the prom2.x migration.)

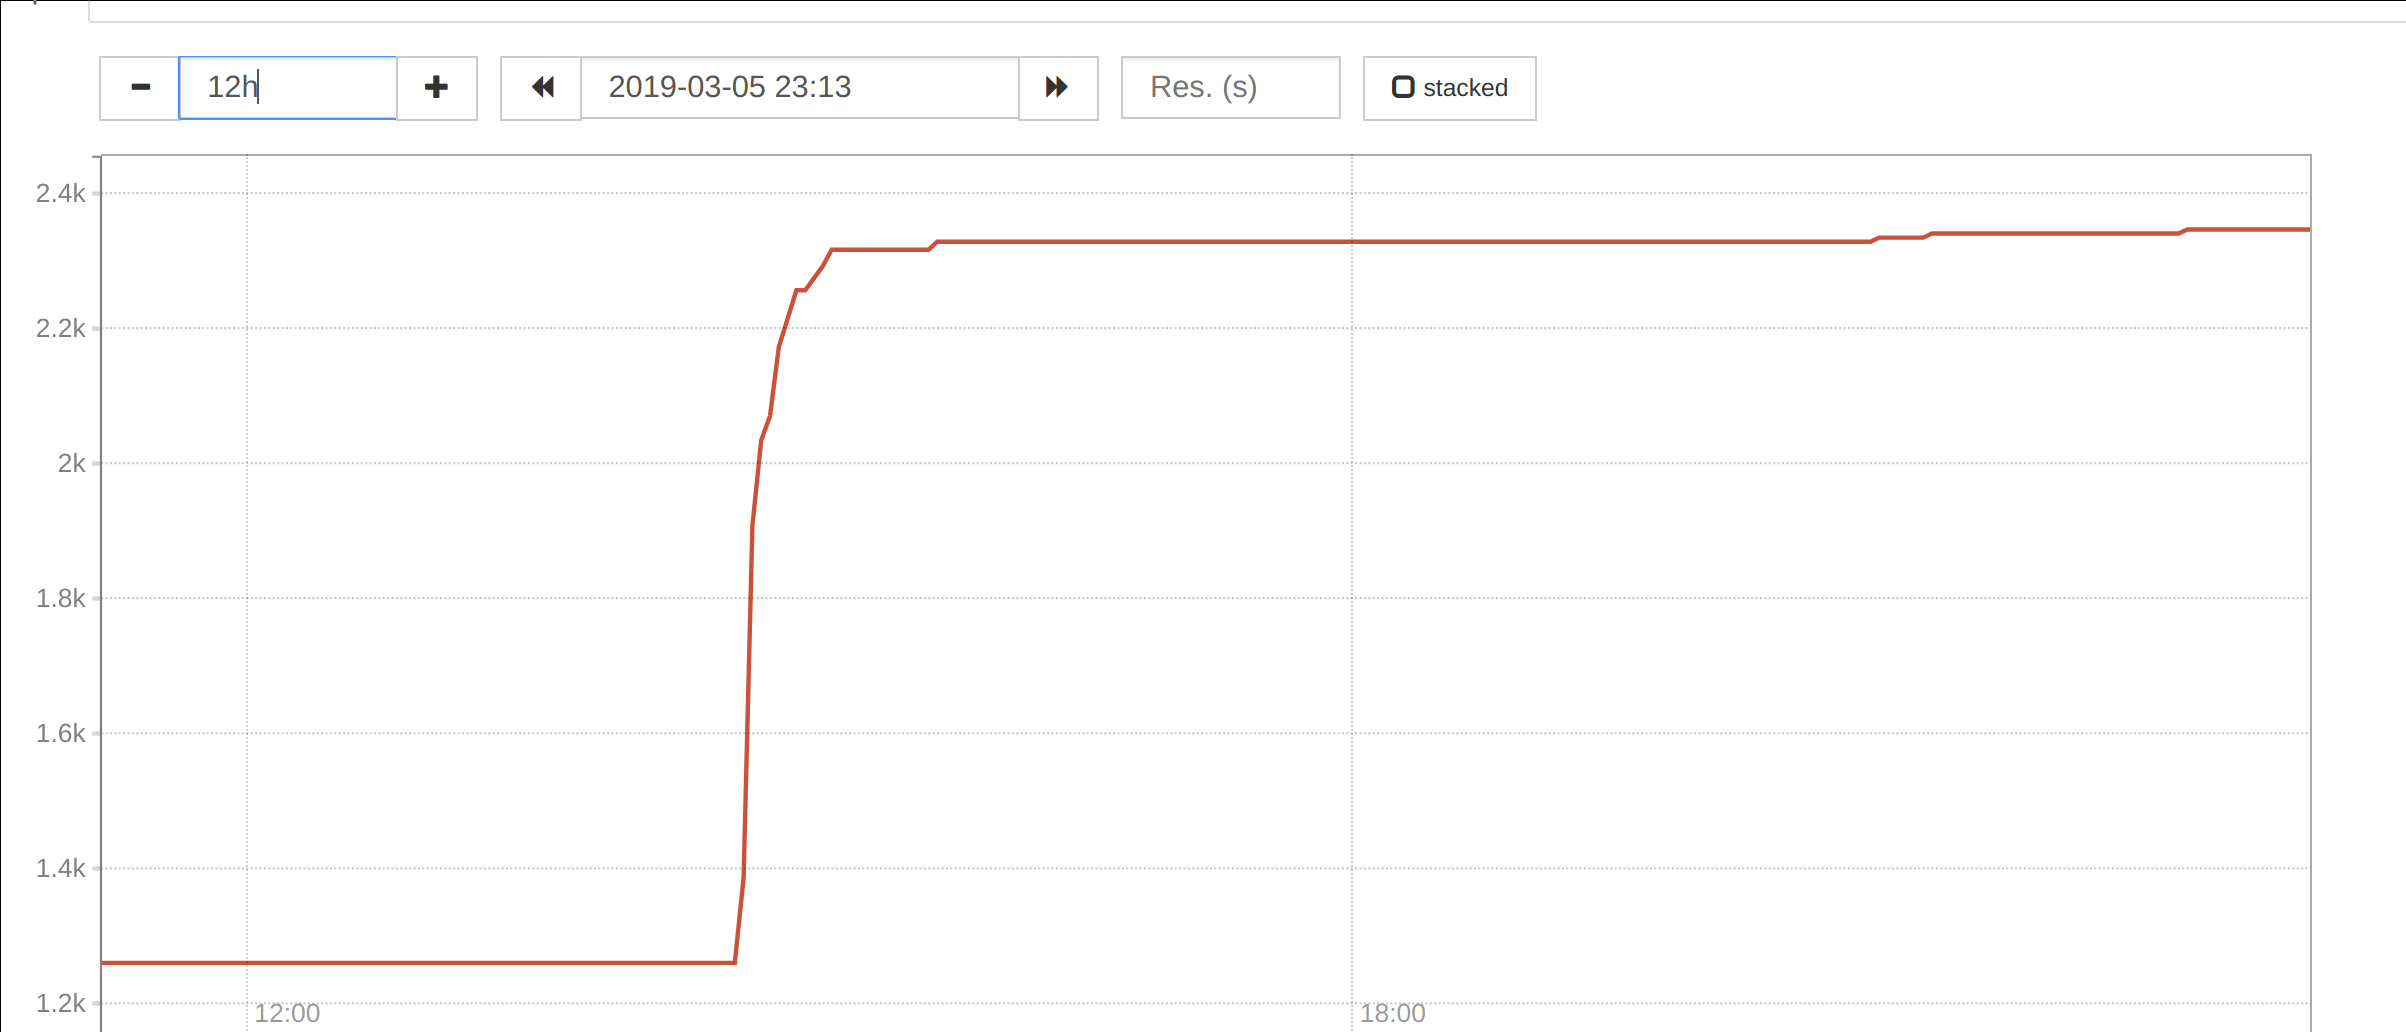
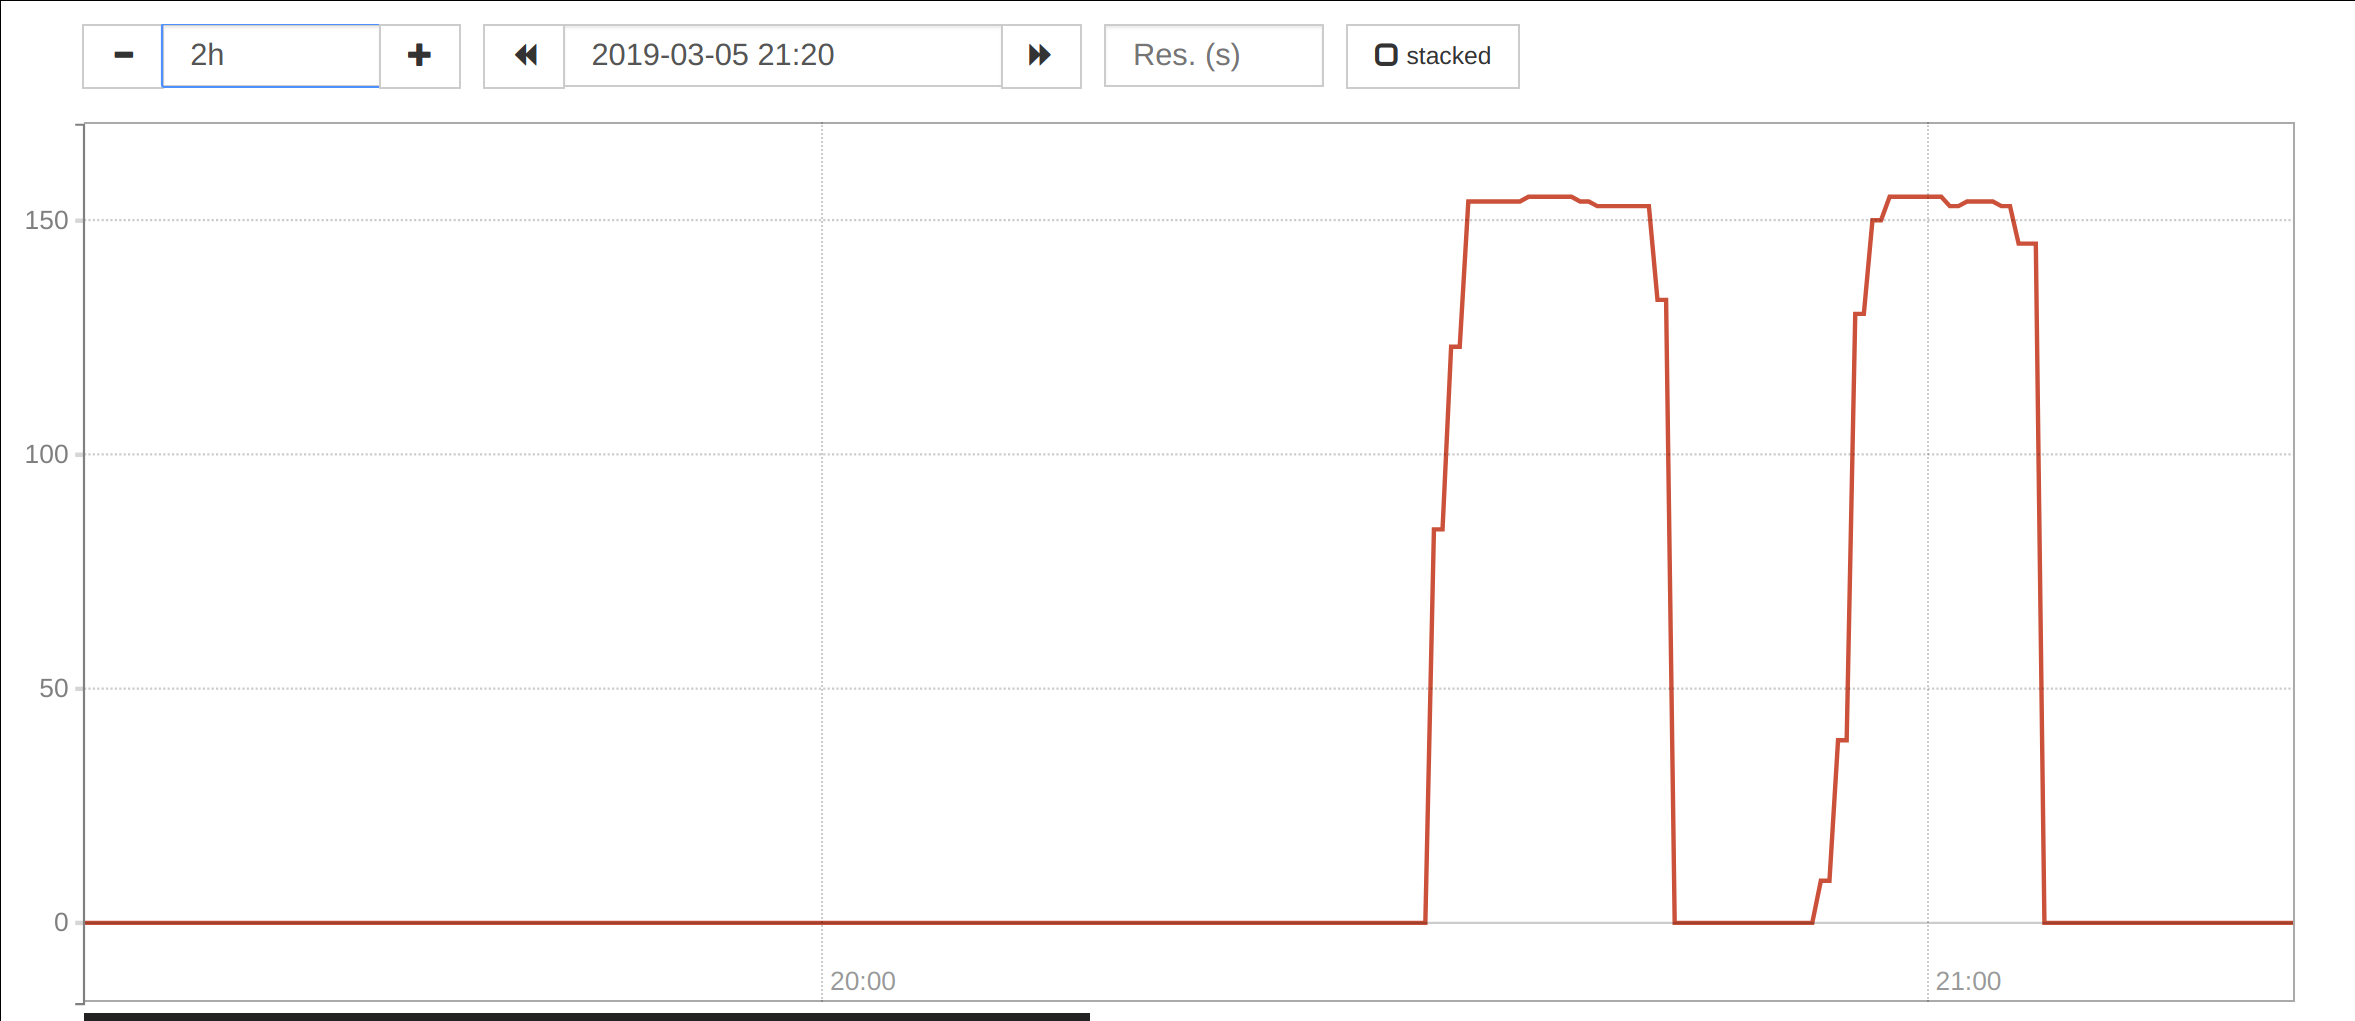
An inspection of the apache logs on prometheus2004 showed many queries that were taking an inordinate amount of time (10-50 seconds) to evaluate:
https://phabricator.wikimedia.org/P8161 (NDA'd because it is unsanitized)

These same queries took ~200x less time when evaluated at 15:00 UTC just hours ago.

It is not clear why. Probably inspecting the prometheus tsdb and engaging with upstream will be necessary to diagnose this.

As a temporary mitigation, @fgiunchedi disabled queries against the k8s prometheus.

Event Timeline

CDanis triaged this task as High priority.Mar 5 2019, 10:36 PM
CDanis updated the task description. (Show Details)
CDanis added a subscriber: fgiunchedi.

Thanks @CDanis and other folks that helped investigate!

Off top of my head other problems that will need followup:

  • grafana queries concurrency towards a single datasource
  • prometheus apache limit concurrency towards each ProxyPass to avoid overwhelming prometheus instance

Change 494685 had a related patch set uploaded (by Filippo Giunchedi; owner: Filippo Giunchedi):
[operations/puppet@production] prometheus: introduce query/connection limits parameters

https://gerrit.wikimedia.org/r/494685

I've examined apache logs on prometheus2004 for the k8s instance looking for clues, even before the incident it seems queries in these forms took long to execute:

histogram_quantile(0.9, sum by (method, le) (rate(service_runner_request_duration_seconds_bucket{service="citoid"}[5m])))
histogram_quantile(0.9, sum by (uri, le) (rate(service_runner_request_duration_seconds_bucket{service="citoid"}[5m])))

And indeed that metric service_runner_request_duration_seconds_bucket did go up in cardinality as we spun up more citoid instances yesterday count(service_runner_request_duration_seconds_bucket).

2019-03-06-102746_2406x1032_scrot.png (1×2 px, 77 KB)

At the time of the incidents there were 150+ concurrent queries either executing or waiting to run: prometheus_engine_queries

2019-03-06-102707_2355x1021_scrot.png (1×2 px, 88 KB)

And likely these factors combined with a long time span from the dashboard overwhelmed prometheus server with CPU load and connections, which rippled into apache on prometheus hosts running out of workers. Grafana apache also suffered from overload hitting maxrequestworkers.

Note that eqiad also experienced similar problems but didn't result in overload, likely due to the fact that there are two prometheus hosts in service there at the moment.

In terms of mitigations I'm thinking of starting on the Prometheus side, namely limiting web connections concurrency at the very least, i.e. connections to the API, and limiting query maximum execution time as well. Similarly on the apache (prometheus and perhaps grafana as well) we should enforce stricter concurrency limits, I couldn't find ATM if grafana supports limiting concurrency towards a datasource, if it does we should do that as well.

For the problematic queries themselves we should switch to using recording rules to precalculate results to use in dashboards. Also making sure url label can't grow with unbounded cardinality. Finally having a "query profiler" to run from apache logs will help identifying expensive queries in the future.

Change 494700 had a related patch set uploaded (by Filippo Giunchedi; owner: Filippo Giunchedi):
[operations/puppet@production] prometheus: add recording rules for service runner percentiles

https://gerrit.wikimedia.org/r/494700

Ouch, sorry about that.

In terms of mitigations I'm thinking of starting on the Prometheus side, namely limiting web connections concurrency at the very least, i.e. connections to the API, and limiting query maximum execution time as well. Similarly on the apache (prometheus and perhaps grafana as well) we should enforce stricter concurrency limits, I couldn't find ATM if grafana supports limiting concurrency towards a datasource, if it does we should do that as well.

Sure, fine by me.

For the problematic queries themselves we should switch to using recording rules to precalculate results to use in dashboards.

+1ed already. Thanks!

Also making sure url label can't grow with unbounded cardinality.

How do we enforce that though?

Also making sure url label can't grow with unbounded cardinality.

How do we enforce that though?

It's hard to enforce, but should be possible to monitor:
https://www.robustperception.io/which-are-my-biggest-metrics
Unfortunately/paradoxically this query is expensive to run, so we'll have to see if it works.

In 2.x there are better options:
https://www.robustperception.io/using-tsdb-analyze-to-investigate-churn-and-cardinality
This looks at the tsdb files on disk and we could turn it into a cronjob.

There's also a management API for 2.x that, if enabled, allows you to drop specific timeseries from the database,
https://www.robustperception.io/deleting-time-series-from-prometheus
So we can in theory clean up cardinality mistakes once made.

Change 494700 merged by Filippo Giunchedi:
[operations/puppet@production] prometheus: add recording rules for service runner percentiles

https://gerrit.wikimedia.org/r/494700

Turns out those queries weren't actually expensive to execute at all. Here's the highest-cardinality metrics on k8s@codfw prometheus:

container_network_tcp_usage_total{}5137
service_runner_request_duration_seconds_bucket{}2358
container_tasks_state{}2335
container_fs_reads_total{}2107
container_fs_writes_total{}2107
container_fs_reads_bytes_total{}1905
container_fs_writes_bytes_total{}1905
container_memory_failures_total{}1868
container_network_udp_usage_total{}1868
apiserver_request_latencies_bucket{}1504
rest_client_request_latency_seconds_bucket{}1309
apiserver_admission_controller_admission_latencies_seconds_bucket{}1236
apiserver_response_sizes_bucket{}1232
apiserver_request_latencies_summary{}564
container_spec_memory_reservation_limit_bytes{}467
container_spec_memory_swap_limit_bytes{}467
container_memory_max_usage_bytes{}467
container_spec_cpu_shares{}467
container_memory_failcnt{}467
container_cpu_user_seconds_total{}467

None of these look unreasonable to me -- AIUI Prometheus is expected to scale to (100 labels)*(1k machines) for a max cardinality of around 100k for a given metric.

So hopefully between recording rules and the 2.x upgrade things get a lot faster?

CDanis claimed this task.

Resolving this; there's followup work to be done but the 'incident' proper is over.

reopening as this just reoccurred

may I ask for the actual (emergency) actions you took, in case it happens again and you are not around? Assuming they are safe to do in an all down scenario.

Change 496750 had a related patch set uploaded (by Filippo Giunchedi; owner: Filippo Giunchedi):
[operations/puppet@production] prometheus: maximum connections to proxypass

https://gerrit.wikimedia.org/r/496750

Mentioned in SAL (#wikimedia-operations) [2019-03-15T11:16:48Z] <godog> reenable prometheus@k8s on prometheus2004 with mod_proxy connection limits - T217715

may I ask for the actual (emergency) actions you took, in case it happens again and you are not around? Assuming they are safe to do in an all down scenario.

For sure, it is safe to do since I've stopped the read path (i.e. queries) whereas metrics will be still collected as normal. I've documented the procedure here: https://wikitech.wikimedia.org/wiki/Prometheus#Stop_queries_on_problematic_instances

Change 496750 merged by Filippo Giunchedi:
[operations/puppet@production] prometheus: maximum connections to proxypass

https://gerrit.wikimedia.org/r/496750

Resolving since the mitigations in place have been working as expected (i.e. a single slow prometheus instance will timeout queries but not exhaust all apache workers)

Mentioned in SAL (#wikimedia-operations) [2019-04-02T11:14:39Z] <akosiaris> T217715 Update mathoid, citoid, cxserver, eventgate grafana dashboards to use the new recording rules for the quantiles

Filippo, did you decide r494685 wasn't necessary?

Change 494685 abandoned by Filippo Giunchedi:
prometheus: introduce query/connection limits parameters

Reason:
Not needed for now, limiting apache workers instead

https://gerrit.wikimedia.org/r/494685

Filippo, did you decide r494685 wasn't necessary?

Indeed, turns out limiting apache workers is the real fix, keeping prometheus options as much default as possible for now. Abandoned the review